Abstract
Introduction
Neuronal cells are sensitive to mechanical properties of extracellular matrix (ECM) such as stiffness and topography. Cells contract and exert a force on ECM to detect the microenvironment, which activates the signaling pathway to influence the cell functions such as differentiation, migration, and proliferation. There are numerous transmembrane proteins that transmit signals; however, integrin and neural cellular adhesion molecules (NCAM) play an important role in sensing the ECM mechanical properties. Mechanotransduction of cell–ECM is the key to understand the influence of ECM stiffness and topography; therefore, in this study, we develop a multiscale computational model to investigate these properties.
Methods
This model couples the molecular behavior of integrin and NCAM to microscale interactions of neuronal cell and the ECM. We analyze the atomistic/molecular behavior of integrin and NCAM due to mechanical stimuli using steered molecular dynamics. The microscale properties of the neuronal cell and the ECM are simulated using non-linear finite element analysis by applying cell contractility.
Results
We predict that by increasing the ECM stiffness, a neuronal cell exerts greater stress on the ECM. However, this stress reaches a saturation value for a threshold stiffness of ECM, and the saturation value is affected by the ECM thickness, topography, and clustering of integrin and NCAMs. Further, the ECM topography leads to asymmetric stress and deformation in the neuronal cell. Predicted stress distribution in neuronal cell and ECM are consistent with experimental results from the literature.
Conclusion
The multiscale computational model will guide in selecting the optimal ECM stiffness and topography range for in vitro studies.
Electronic supplementary material
The online version of this article (10.1007/s12195-020-00615-2) contains supplementary material, which is available to authorized users.
Keywords: Multiscale modeling, Neuronal cell, ECM stiffness, Cell–ECM interactions, Integrin α1β1, Neural Cellular Adhesion Molecule (NCAM)
Introduction
One of the most critical aspects of recent advancements in regenerative medicine is directing stem cell differentiation toward a specific lineage.70 It is especially challenging to guide them to differentiate and mature as a neuronal cell.11In vivo neuronal cell differentiation and proliferation are guided by complex chemical and microenvironment factors; it is difficult to understand the niches of specific microenvironment influence. Thus, in vitro studies help to identify the influence of microenvironment, and to better understand the cell signaling pathway.65 Generally, in vitro studies use an extracellular matrix (ECM) to mimic the microenvironment of neuronal cells. Experimental studies have varied the mechanical properties of ECM, which changes the microenvironment between the cell and ECM.16,52,63
An ECM has a range of mechanical properties that have been identified to influence cell differentiation, such as ECM composition, stiffness, topography, and growth factors.14 An experimental study has demonstrated that an increase in ECM stiffness has yielded an increase in neuronal cell differentiation.14 However, experiments to find ECM stiffness or the mechanosensing range at which maximum cell differentiation occurs have thus far produced ambiguous results.46,55 The ECM stiffness or Young’s modulus (E) is an equivalent measure of the resistance to applied deformation.2 Experiments that test cell response to change in ECM mechanical properties often utilize synthetic ECM, since its stiffness can be varied by changing the concentration.63 Commonly used biocompatible synthetic materials are polyelectrolyte multilayers (PEMs), polyacrylamide hydrogels, and Matrigel®.50,58 In particular, Matrigel has resulted in higher neuronal cell differentiation when compared to other synthetic materials, and its stiffness can also be tuned similar to in vivo conditions.21 Numerous experiments have shown that when ECM topography changes, it can significantly influence the neuronal cell differentiation.8,14,37,44
Dowell et al.14 conducted neuronal cell growth experiments on the laminin-coated patterned substrate (arrays of microposts) have exhibited an increase in neuronal cell growth when there is an increase in ECM stiffness. They demonstrated that as the stiffness of microposts increases, there is an increase in stress, cell area, and the number of receptors. The maximum force on the microposts also showed dependence on substrate stiffness. On flat substrates, the study by Polacheck et al.43 has shown that an increase in cell spreading area is dependent on substrate stress for applied cell contractility. Despite numerous experimental observations, it is still unclear how the patterned ECM surface influences the stress on cells. There is also a lack of understanding about the stress and deformation asymmetry response in patterned ECM surfaces.29
Cells react to differences in ECM mechanical properties by pushing and pulling on ECM via myosin-induced contractility in the cytoplasm. This is referred to as cell contractility.1,56 Due to cell contractility, mechanical force is transmitted from receptors (intracellular proteins) to ligands (ECM proteins), and they form a mechanical anchor and play a crucial role in mechanosensing and mechanotransduction.47 There are numerous receptors that bind with ligands, but integrin and neural cellular adhesion molecules (NCAM) are the main mediators for sensing ECM properties.35 Cell culture experiments have shown that suppressing the integrin using antibodies has negligible influence on neuronal cell deformation.3 Similarly, NCAM has been found to mediate cell–ECM and cell–cell adhesion.35 NCAM binding also stimulates intracellular signaling for neuronal cell differentiation and cell–cell interconnection.60 It was observed that the distribution of integrin and NCAM is predominantly concentrated on the periphery of the cell membrane and cytoplasm. However, it is unclear how an increase in ECM stiffness affects the integrin and NCAM clustering.68
Several theoretical models have studied the influence of ECM stiffness and topography. However, the complex molecular mechanisms of cell–ECM interconnection still need to be understood. Multiscale models can investigate these mechanisms since they can couple mechanosensing of cell and ECM at multiple length scales.10 Modeling the behavior of ECM is a challenging task since ECM is composed of numerous proteins such as collagen, laminin, and fibronectin.20,36,64 These proteins form a cross-linked network of the fibrous structure. Few computational models have been developed for these fibrous structures.19,36 Although the behavior of ECM can be predicted by these models, these fibrous structures have enabled the model dependent on many parameters. An analytical model based on two-layers with consideration of receptors and ECM interactions has shown that receptors prefer to cluster on stiffer ECM substrate.16,32,48 A few other models based on coupling analytical equations and finite element based models were developed to analyze the cell contractility mechanism based on focal adhesion dynamics.30,39,67 They showed that the remodeling of receptors are affected by cell–ECM adhesion and cell contractility force. Biomechanical models for cytoplasm based on the change in cell contractility have found that receptors will aggregate near the cell periphery region.3,13 Models were also developed to predict topography influence on cell stresses and deformation.13,40 These models considered pillars and microposts as elastic spring and calculated the traction force at the cell–ECM interface. It was found out that by increasing the elastic spring constant of microposts resulted in higher traction force. Similarly, cells cultured on the micropost patterned ECM has a higher traction force when compared to a flat ECM surface.44,49 Previous studies have individually modeled the influence of multiple parameters such as cell contractility, receptors clustering, ECM stiffness, and topography. However, these modeling studies only investigated cell structure and ECM, neglecting the consideration of dendrites, which also plays an important role in the transfer of signal from adhesion molecules to cell during cell contractility.71 Moreover, these adhesion molecules are modeled as linear elastic springs,20 neglecting the nonlinear behavior of protein structures such as integrin and NCAM.
It is challenging to experimentally examine these open questions due to the number of parameters involved. Therefore, in this study, we use a multiscale computational model by considering a neuronal cell attached to an ECM via receptors integrin and NCAM. At the atomistic scale, these receptors form the connection between neuronal cell and the ECM. We examine the mechanotransduction of receptors to capture non-linear behavior at the atomistic scale using molecular dynamics. At the continuum scale, we investigate how neuronal cell contractility deforms the ECM using nonlinear finite element analysis (FEA). We study the effect of ECM stiffness and topography on neuronal cell, which involves coupling multiple length scales. The computational model includes essential pathways of cell contractility on the ECM, and we compare our results to analytical equations. The model developed here can predict a change in mechanosensing range due to an increase in ECM stiffness and topography. Parametric studies are carried out to find the integrin and NCAM clustering influence on neuronal cell stress and deformation. Results from this study will be useful in finding an optimal ECM stiffness and topography for neuronal cell studies.
Materials and Methods
Mechanotransduction of Cell–ECM
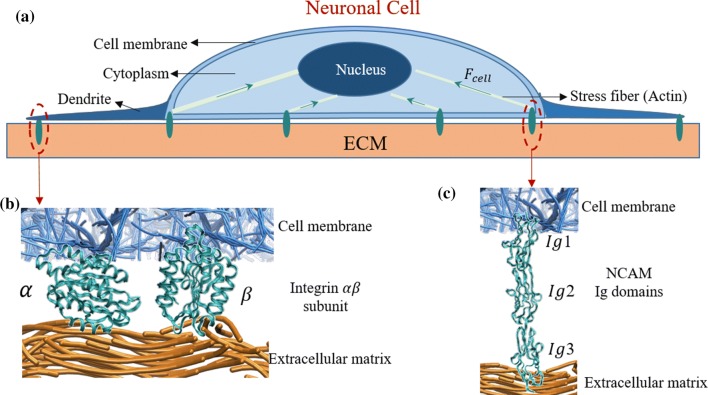
Cells reside within a complex microenvironment; therefore, it is necessary to decouple factors to understand biochemical and biophysical cues on cells.23 The focus on biophysical cues arises due to interaction with the ECM, and it has been shown that there are multiple pathways near the interface between the cell and ECM.15 These multiple possibilities of force transfer exist due to numerous adhesion proteins that are connected to ECM ligands. Recent experiments have shown the importance of transmembrane protein complexes such as integrin and NCAM in the role of sensing and transmitting mechanical and biochemical stimuli.26 A schematic representation of the cell–ECM interactions are shown in Fig. 1, which describes integrin and NCAM mediated mechanotransduction in the cell.
Figure 1.
(a) Schematic representation of the neuronal cell. ECM–cell interaction, and their intracellular signalling pathways. Receptor binding between the extracellular matrix (fibrous structure) and the cell membrane is shown for (b) integrin , and (c) NCAM.
The cell has three important subcomponents; the outer cell membrane, cytoplasm, and inner nucleus. The nucleus is the central unit for receiving the signal and control the biochemical cues, while the cytoplasm is the fibrous structure with multiple proteins.4 The vital function of cytoplasm is to generate cell contractility using actomyosin (stress fibers) against the ECM. These myosins generated forces transmit to the ECM via transmembrane molecules, such as integrin and NCAM. Due to the physical connectivity from integrin to nucleus, cells sense the properties of ECM. This process of bidirectional sensing is shown schematically in Fig. 1a. Transmembrane molecules such as integrin and NCAM form the linkage between the neuronal cell and ECM through individual interactions between a receptor and an ECM ligand (Figs. 1b and 1c). On the cell membrane, integrin is connected to the cytoplasm through an assembly of multiple proteins. The fibrous structure of the ECM is comprised of protein ligands such as laminin, collagen, and fibronectin. However, modeling the fibrous structure of the ECM with all ligands is a tedious process. Hence, an efficient way to model the fibrous structure of ECM is by using an equivalent approximation technique.67 Also, the current study focuses on the influence of variation in ECM stiffness on a neuronal cell rather than the physical structure of the ECM.
Experimentally, changing the mechanical properties of ECM without altering other system characteristics can be challenging. However, computational models can decouple such variables and study the influence of individual change in material properties. Furthermore, an effective computational model is one that can characterize the behavior of the complex system while predicting qualitative results similar to those observed in experiments. We develop a multiscale model of neuronal cell and ECM to study the effect of change in ECM stiffness and topography on cell deformation. This model captures the essential signaling pathway mechanism, as shown in Fig. 1. Details of the multiscale model, the required geometrical parameters for cell, dendrite, and ECM structures are explained in the following sections.
Geometrical Details
Neuronal Cell
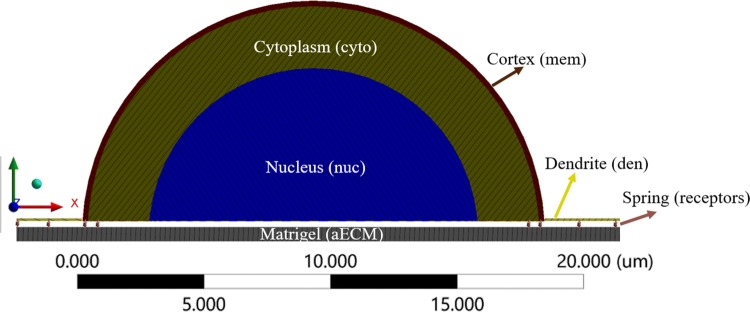
Computational studies by Wong et al.67 represented neuronal cell as a single entity with homogenous mechanical properties. However, few studies have considered the layered components of the neuronal cell such as cell membrane, cytoplasm, and nucleus, as shown in Fig. 2. It is necessary to capture the geometry and material properties of all neuronal cell components, to study the force transmission across the nucleus of a neuronal cell. Analysis of the signaling pathway in the previous study38 has shown that transmembrane proteins send the signal to cytoplasm which is internally connected to the nucleus. Therefore, modeling the cell membrane, cytoplasm, and nucleus are essential. Indentation of neuronal cell using atomic force microscopy (AFM) has examined the geometry variation in the rat cortical neuronal cell.6 They found an average diameter and height of neuronal cell using “cross-diameter” estimates.61 Here, we assume the semi-spheroid shape with an average height of 7.9 µm, and a diameter of 16.8 µm for the neuronal cell, based on the experimental study.6 The neuronal cell and ECM are connected via receptors (refer; Fig. 2); therefore the neuronal cell remodeling or spreading is not considered in this study.
Figure 2.
Neuronal cell cross-sectional view that consists of cortex (cell membrane) outer layer, middle layer cytoplasm, and inner nucleus region and dendrite (green line). The dendrite is connected to the cell membrane, and the ECM (Matrigel) via receptors (springs).
Dendrites
Experimental studies by Soba et al.54 shows the importance of dendrite contribution in sensing the microenvironment properties of ECM. However, dendrite properties were not included in previous computational studies by assuming that dendrite is not connected to the ECM.10 Recent Traction Force Microscopy (TFM) study have revealed that intracellular molecules such as integrin and NCAM mediate the dendrite growth process.22 The computational model developed in this study includes dendrite, and they protrude from the cell body and tapers along the length, as shown in Fig. 2. Based on experimental observation,54 dendrite shape and size fluctuate over a certain range. Hence, we assume an average size (1.17 µm in width, 0.80 µm in height and length 6 µm), tapered shape, and four dendrites per neuronal cell53,54 in our model.
Extracellular Matrix (ECM)
Matrigel is made up of ligands such as laminin, collagen, and heparin21,59 and is widely used in cell proliferation, migration, and differentiation due to its biocompatibility and enhanced cell adhesion21 properties. In this study, Matrigel is considered as the ECM substrate. In experimental studies, changing the stock concentration varies the stiffness of Matrigel. Therefore, we vary the ECM stiffness from 4 Pa to 5000 Pa to study the stiffness effects.
Patterned ECM Substrate
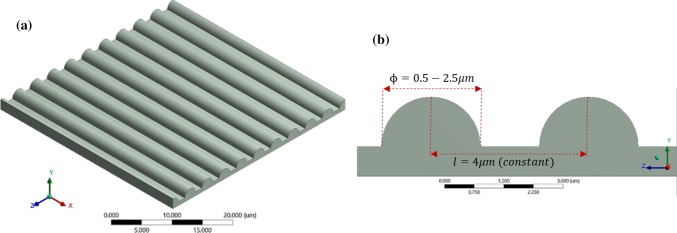
Experimental studies on the effect of patterned substrate on cell differentiation, proliferation, and migration have shown significant influence due to the geometry of the pattern.28 A variation in cell behavior was observed for different patterned substrates consisting of pillars, microholes, and gratings. Particularly, gratings show directional cell growth and enhanced cell differentiation.18,57 Varying the width of grating have yielded a higher neuron growth when compared to changing the gap between the gratings.14 In this study, we generate gratings made with a cylindrical asperity by varying asperity diameter (ϕ), with a constant gap between asperities, as shown in Fig. 3.
Figure 3.
Patterned ECM substrate with cylindrical asperity aligned along the x-direction. (a) ECM with 2.5 µm asperity diameter (), (b) shows the schematic of the patterned substrate. The diameter is varied from 0.5 to 2.5 µm. The spacing between the asperities is 4 µm.
Multiscale Modeling of Neuronal Cell and ECM
Interaction between the neuronal cell and ECM occurs at multiple length scales, and it is challenging to describe the transfer of force from the nanoscale to microscale. As described in “Mechanotransduction of Cell–ECM” section, mechanotransduction of cell–ECM process of bidirectional sensing is a multiscale process, where receptors such as integrin and NCAM transfer force at nanoscale while the neuronal cell contractility occurs at the microscale. To capture this, we develop the geometry of the neuronal cell, dendrite and ECM at microscale using non-linear finite element analysis (FEA). At the nanoscale, we model integrin and NCAM using the molecular dynamics method as implemented in LAMMPS.42 Figure 4a shows schematics of the multiscale model of neuronal cell and the ECM. The dendrite structure and its connection to the cell membrane layer are shown in Fig. 4b. The coupling between the microscale and nanoscale is captured by a spring element, which characterizes the non-linear behavior of integrin and NCAM. Springs are connected between cell–ECM and dendrite–ECM as shown in Fig. 4c. The protein structure of NCAM and integrin are extracted from the protein database (PDB), and their atomic structures are shown in Fig. 4d. To analyze the neuronal cell and ECM in FEA, we require a material model that predicts the mechanical behavior of cell and ECM, details of the model are discussed in the Supplementary Material.
Figure 4.
(a) The neuronal cell and ECM models, with geometric dimensions obtained from Jerusalem et al.24. (b) Dendrites are connected to the cell membrane, and their structure is modeled based on the experimental observation by Smith et al.53 (c) Longitudinal springs are distributed randomly at the ECM–cell and dendrite–ECM periphery. (d) The protein structure of NCAM and integrin .
Nanoscale Material Properties and Deformation of Integrin and NCAM
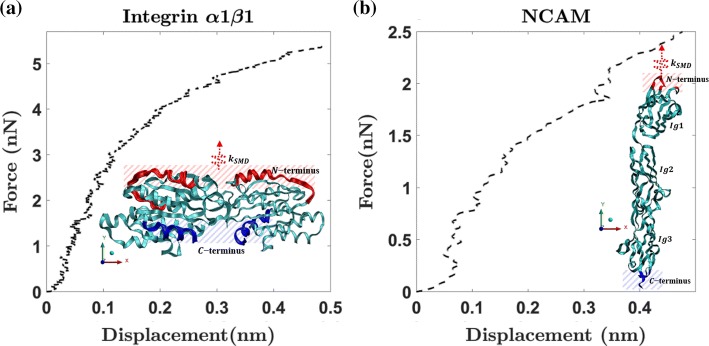
To understand the atomistic behavior of integrin and NCAM, we use the molecular dynamics method. The protein structure of receptors such as integrin (1CK4 pdb41) and NCAM Ig 1-2-3 (1QZ1 pdb60) of Rattus norvegicus are extracted from protein database.5 Deformation characteristics of an individual receptor at the atomistic scale are analyzed using steered molecular dynamics31 (SMD). The SMD method mimics an atomic force microscopy study of proteins. SMD applies an external force using a virtual spring with a stiffness and displaces atoms that are connected to the spring at a constant velocity. This method enables us to predict the receptor deformation mechanisms for an externally applied mechanical force. Integrin and NCAM protein structures consist of amino acid residues. Previous studies have predicted mechanical behavior of protein using the Chemistry at HARvard Macromolecular Mechanics (CHARMM) force field,33,34 and the predictions were consistent with experimental results.66 We use the CHARMM force field along with SMD to predict the force–deformation behavior of integrin and NCAM (see Figs. 5a and 5b). The integrin and NCAM intracellular adhesion molecule binding region is considered as the C and N terminus41,60 (refer Figs. 5a and 5b insets). We first minimize the integrin and NCAM structures and then equilibrate them by maintaining pressure and temperature of 1 atm and 300 K. To find the position and velocity of atoms at each time step, we use the Nose–Hoover method. The equilibration of proteins is carried out until the root mean square deviation ~ 1 Å.
Figure 5.
The force–displacement response of (a) integrin and (b) NCAM under tensile loading. Inset shows the SMD boundary and loading conditions. The C-terminus chains are fixed, and a displacement boundary condition is applied to N-terminus chains.
Atomic force microscopy (AFM) studies on integrins have used pulling velocity range of 0.1–10 μm/s and inferred that for different rate of pulling there is fluctuation in the unfolding force. However, rate of pulling has a negligible variation on integrin stiffness. After performing parametric studies using SMD simulations, we have chosen spring constant and velocity of pulling as . The non-linear force–displacement data of integrin and NCAM are shown in Figs. 5a and 5b. The atom position and forces are extracted by recording the trajectories every 200 fs. Extracted force–displacement data are smoothened using moving average method.12 This force–displacement behavior is then assigned to the non-linear spring elements in the FEA model. The spring elements mimic the nanoscale non-linear behavior of integrin and NCAM when there is a force transmission between the neuronal cell and ECM.
Finite Element Analysis and Modeling
To predict the influence of ECM mechanical properties on cell, we use a commercially available software ANSYS®, which can capture the geometry of cell and represent the material behavior using constitutive laws (see Supplementary Material for details). A 3D FEA model of cell–ECM is meshed using higher-order solid elements (refer to the supplemental material for a detailed description of FEA formulation and analysis procedure). We perform convergence studies to optimize the mesh density (refer the supplemental material for the information on mesh convergence results). Figure 6 shows FEA mesh with substrate thickness t = 1 µm. We assume that ECM and dendrite as nearly incompressible ( = 0.49) and linear elastic isotropic material. Considering an elastic modulus range of 4–5000 Pa and different thicknesses (t = 6, 3, 1, and 0.5 µm) for ECM will provide an insight into how geometry and material property will influence the distribution of stress and deformation in neuronal cell and the ECM.
Figure 6.
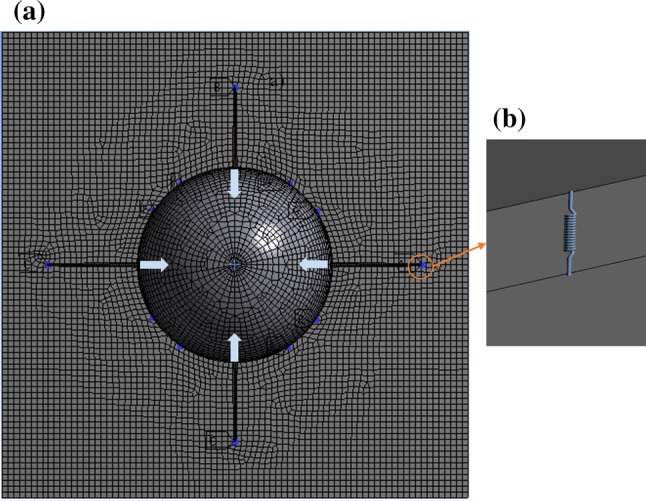
(a) FEA mesh of the neuronal cell and ECM, with arrows representing the applied load. The condition of neuronal cell contractility displacement in the cell membrane and the connection region of NCAM and integrin are shown as well. Also, number of integrins and NCAM are represented as blue dots. (b) Visualization of integrin and NCAM as a spring element, which connects the ECM and cell membrane
Boundary Conditions of the Multiscale Model
As discussed in “Mechanotransduction of Cell–ECM” section, during mechanotransduction of cell–ECM, cell sense microenvironment by contracting, which is induced by stress fibers on ECM via receptors (refer Fig. 1). However, the magnitude of cell contractility is based on cell type, maturation, and cell area. Few experimental studies have quantified deformation and traction stress of ECMs due to cell contractility using Traction Force Microscopy (TFM).49 An experimental study on migratory neurons has shown that ECM deformation has varied from 0.2 to 0.4 µm due to neuronal cell contractility.25 Therefore, we apply average cell contractility of 0.3 µm as a displacement boundary condition on the cell membrane in our model (see Fig. 6a). The spring elements between cell membrane and the ECM represents properties of integrin and NCAM (refer Fig. 6b). The results of stress and deformation that follows have an applied cell contractility of 0.3 µm on the cell membrane.
Results and Discussion
Effect of ECM Stiffness on Neuronal Cell
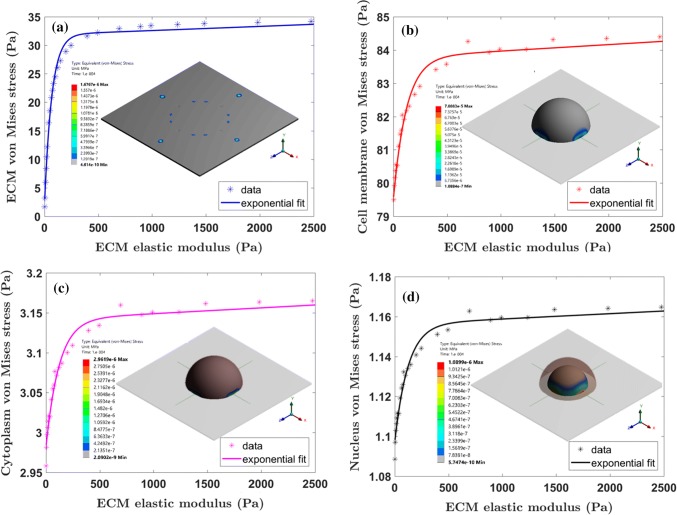
Neuronal cell detect change in ECM properties due to variation in force transfer from adhesion molecules and leads to cell contractility. In this multiscale model, the cell contractility results in mesh elements to move inwards. Cell contractility causes the dendrite to move inward as well, which in turn applies a tensile force to the spring elements (integrin and NCAM) attached to the ECM. Stress that develops in ECM is due to force transfer from integrin and the NCAM. We determine the von Mises effective stress for the cell and ECM. From Fig. 7a, we observe that by increasing the ECM elastic modulus, the maximum stress increases in the cell and ECM. However, the maximum stress value saturates and further increase of ECM stiffness from ~ 500 Pa, the rate of stress increase is low. We also observe similar stress saturation behavior in the cell membrane, cytoplasm, and nucleus (refer Figs. 7b–7d respectively). The results show that the cell membrane experiences a higher stress magnitude, and stress transfer to the nucleus is mediated by cytoplasm. The neuronal cell culture experiments use diluted stock concentration of Matrigel varying from 1 to 7%,21 and this variation in Matrigel stock concentration changes the ECM stiffness within the range of 40–5000 Pa.
Figure 7.
The maximum von Mises stress variation for the ECM, cell membrane, cytoplasm, and nucleus with respect to change in the ECM elastic modulus are shown in (a)–(d) respectively. The stress variation shows a non-linear trend up to the threshold ECM elastic modulus (E = 495 Pa). The von Mises stress distribution at E = 495 Pa for ECM, cell membrane, cytoplasm, and nucleus are shown in the inset of each figure.
Distribution of stress in ECM (refer Fig. 7a inset) is localized in the region of integrin and NCAM connection points. Similar stress distribution has been observed in cell culture experiments25 and it was observed that the stress distribution is controlled by integrin distribution on the cell periphery. We observe that by varying the stiffness of the ECM, the stress distribution doesn’t change in ECM and reaches a saturation value. The cell membrane and cytoplasm stress distribution are at a maximum at the periphery, indicating that the dendrite connection region dominates the integrin and NCAM pulling force (refer Fig. 7b and 7c insets). However, the nucleus experiences a biaxial compression from cytoplasm which results in maximum stress distribution at the nucleus periphery (refer Fig.7d inset).
Few analytical and theoretical models have investigated the influence of ECM properties on cell deformations; however, these models have a limitation in predicting the ECM pattern (3D geometry) influence on neuronal cell. It will be intriguing to compare the prediction of ECM stiffness influence on neuronal cell using analytical two spring model48 and the multiscale model developed here. The two-spring model assumes that ECM and intracellular components are in series; it neglects the difference in stiffness of receptors and cell membrane. Here we extend the two-spring model to a three-spring model, which considers ECM, receptors, and cell membrane in series. As shown in Fig. 8a springs in series will result in the decomposition of deformation (), and same force transfer (F) in the system. Consequently, from the superposition principle, the independent deformations are added together to find the total displacement (U) (see Eq. 1). The displacements can be found from stiffness and force relation (). Total deformation (refer Eq. 1) and effective stiffness (refer Eq. 2) equations are derived by combining the deformation and stiffness of each component of the neuronal cell and ECM.
| 1 |
| 2 |
The stiffness for cell membrane () is a function of displacement and are calculated from the assumed neo-Hookean model properties (refer to Supplementary Material Eq. 1 and Table S2). The receptors (integrin and NCAM) stiffness are extracted from the force displacement curves (Fig. 5), assuming linear elastic stiffness for the ECM. For an applied cell contractility, we increase the stiffness of ECM to calculate the total deformation. By varying the stiffness of ECM, we vary deformation nonlinearly and saturate at the threshold stiffness of the ECM (refer Fig. 8b). We normalize the deformation and stiffness of ECM with the maximum value to show the characteristic difference between multiscale model and the analytical three-spring system. The multiscale model shows good agreement with the analytical three-spring system, with a variation of 5%. The saturation we observe in multiscale model is due to number of variables such as nonlinear behavior of receptors (integrin and NCAM), and rate-dependent behavior of neuronal cell. However, for three-spring system the saturation is due to difference in stiffness of the ECM, receptors, and cell membrane. For threshold region, the stiffness of receptors and cell membrane dominates over ECM; thus, the cell can sense the change in ECM stiffness. However, above ECM threshold value, stiffness dominates over receptors and cell membrane, which leads to cell being unable to sense the ECM stiffness change. Similar saturation behavior has been observed in experiments for different cell types.27,63 The prediction from three-spring analytical model is similar to multiscale modeling prediction of ECM stiffness effect on neuronal cell (refer Fig. 8b). However, the multi-scale model has the ability to predict the effect of ECM topography on neuronal cell and can capture the 3D model features compared to the analytical model. FEA approach can also assess the impact of topographical shapes on neuronal cell stress and deformation compared to three-spring analytical model. Hence, three spring analytical model is limited to the prediction of ECM stiffness and its effects on the neuronal cell.
Figure 8.
(a) The three-spring model representation of ECM influence on a neuronal cell. (b) The ECM deformation dependence as the ECM stiffness varies.
We also observe that neuronal cell morphology or shape changes as the stiffness of the ECM increases. The cytoplasm in the neuronal cell reorganizes its stress fibers based on the ECM stiffness that induces the change in cell shape. In the current approach of finite element modeling, the simulation of these stress fibers in the cytoplasm is a tedious process. We, therefore, considered cytoplasm as a homogenous medium with equivalent material characteristics. Therefore, the multiscale model lacks a forecast of cell shape change based on stress fiber remodeling. We predicted the neuronal cell deformations based on ECM stiffness, which indicates minor shape variations (refer Supplementary Fig. S4).
Effect of ECM Thickness on Stress Distribution in the ECM
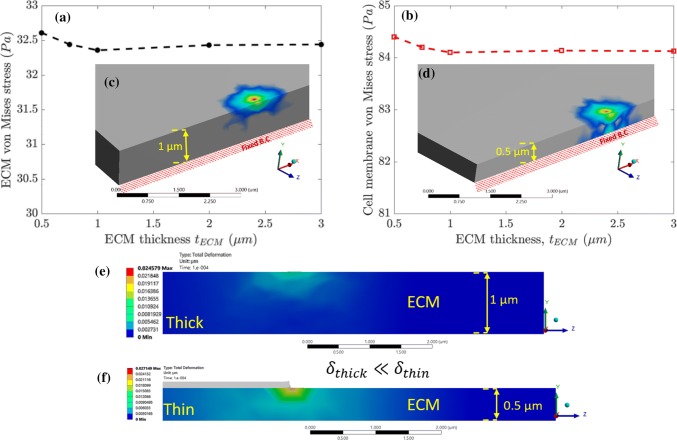
To examine the influence of ECM thickness on von Mises stress and deformation in ECM and cell, we vary the thickness of ECM from 0.5 to 3 µm. Figures 9a and 9b show the maximum von Mises stress on ECM and cell membrane respectively as a function of ECM thickness. We observe that above 1 µm thickness, change in von Mises stress for ECM, and cell membrane are negligible. However, stress in the neuronal cell increases if the ECM thickness is below 1 µm. Therefore, in our multiscale model we use an ECM thickness of 1 µm. Results for the critical thickness of ECM and the cross-sectional view of stress distribution along the ECM thickness are shown in Figs. 9c and 9d. We observe that for a 0.5 µm thick ECM, the stress distribution spans below the ECM surface (see Fig. 9d). Consequently, if ECM thickness is below 0.5 µm thick, the stress distribution in ECM and cell membrane will be influenced by the thickness. However, for 1 µm thick sample, stress distribution reaches only half of the total ECM thickness (refer to Fig. 9c). For an ECM thickness of 1 µm and above, the effect of stress distribution in ECM and cell membrane is minimal. We observe a similar trend in total deformation for 1 and 0.5 µm thick ECM substrates as shown in Figs. 9e, and 9f. Stem cell experiments have shown that for thicker ECMs, cells can deform more than for thinner ECMs.50 The quantitative effect of ECM thickness on the stress distribution of the ECM suggests that the ECM thickness over 1 µm does not influence the stress distribution on neuronal cell (refer Fig. 9). This finding will be useful for designing in vitro experiments for reducing or eliminating the impact of ECM thickness on neuronal cell mechanical behavior.
Figure 9.
Maximum von Mises stress (Pa) for ECM and cell membrane as a function of ECM thickness are plotted in (a) and (b), respectively. We observe that below a critical ECM thickness, there is a significant change in stress for cell membrane and ECM. Also, (c) and (d) shows the von Mises stress distribution. (e) and (f) shows the total deformation variation in ECM for 1 and 0.5 µm cases.
Effect of Integrin and NCAM Clustering
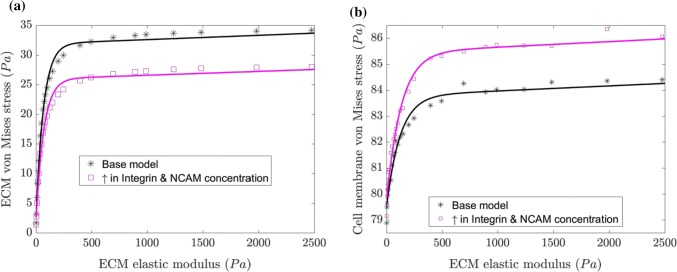
The cell–ECM interaction depends on the number of receptors such as integrin and NCAM. Recent experiments have shown that as the receptor number increases there is an increase in ECM stiffness.3,7 The increase in number of receptors is needed to balance the traction forces and to strengthen the adhesion. Therefore, it is important to study the influence of an increase in the number of integrin and NCAM in our multiscale model. Since the number of integrins and NCAM in the cell–ECM interface is unknown from experiments, we have assumed a random number of receptors in our multiscale model. We change the number of integrins and NCAMs in our study from 16 to 32, to find the change in von Mises stress for ECM and cell membrane. Figures 10a and 10b shows the maximum von Mises stress for an increase in integrins and NCAMs by varying the stiffness of the ECM. We observe that von Mises stress for ECM decreases, while cell membrane stress increases when increasing the integrin and NCAM concentration. This may be due to the higher force requirement for cell membrane layer to pull at an increased number of integrins and NCAMs. The ECM stress decrease may be due to the additional support contributed by the number of integrins and NCAMs. To understand the effect of random receptor distribution (integrin and NCAM) on neuronal cell and ECM, we performed three additional simulations by varying the location of receptors (nonlinear springs) in the multi-scale model. Results indicate that the von Mises stress in neuronal cells and ECM differs by less than 10% due to receptor position change (refer Fig. S3, Supplementary Material). This inference is also consistent with the observed trend in the experimental results for cancer cell, where the traction of cell increased with the number of integrins.38 Also, these findings suggest that through the clustering of receptors in cell culture, experiments could generate higher adhesion energy between the neuronal cell and ECM.
Figure 10.
Effect of increase in the concentration of integrin and NCAM on von Mises maximum stress (Pa) for (a) ECM, and (b) cell membrane of the neuronal cell.
ECM Topography Effects
To study the topography or pattern of ECM and its influence on neuronal cell deformation, we generate several ECM surfaces with varying asperity diameters. Asperity or grating in ECM has been widely studied experimentally to determine the influence of geometrical changes to its pattern on cell behavior such as cell differentiation, migration, and proliferation.9,51,57 In this study, we select asperity surface dimensions based on experimental work discussed in “Patterned ECM Substrate” section. We study stress variation for asperity diameters (ϕ) ranging from 0.5 to 2.5 µm. The results for change in von Mises stress due to an increase in ECM elastic modulus are shown in Fig. 11. Increasing the asperity diameter leads to decrease in ECM von Mises stress compared to a flat ECM surface. This is obvious from the bar graphs in Fig. 11 for ECM elastic modulus values of 49.5, 495 and 4950 Pa (refer, Fig. 11). The decrease in stress is more evident at lower stiffness (, max. 38% decrease) than higher stiffness (, max. 15% decrease).
Figure 11.
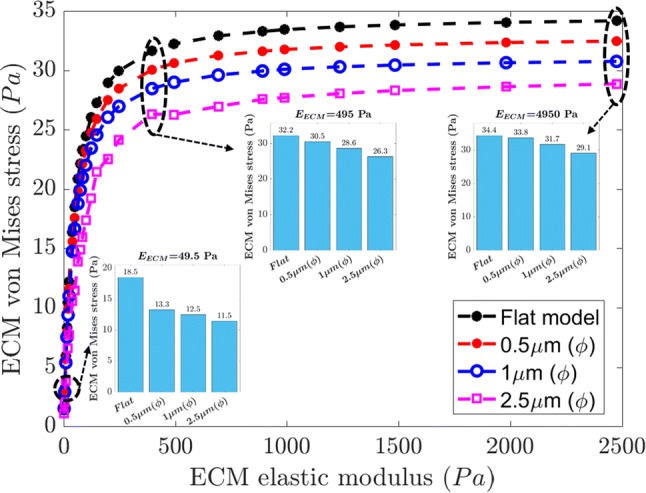
Effect of change in ECM topography on ECM von Mises stress. An increase in asperity diameter (ϕ) leads to a decrease in the von Mises stress. The bar plots at various ECM stiffnesses () show there is a consistent decrease in von Mises stress with an increase in asperity diameter.
Asymmetrical Deformation Behavior of ECM Asperity
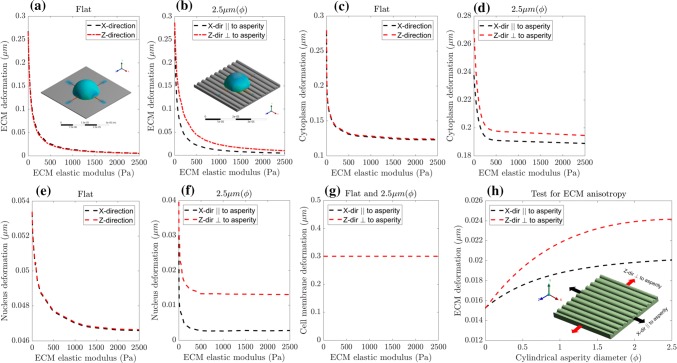
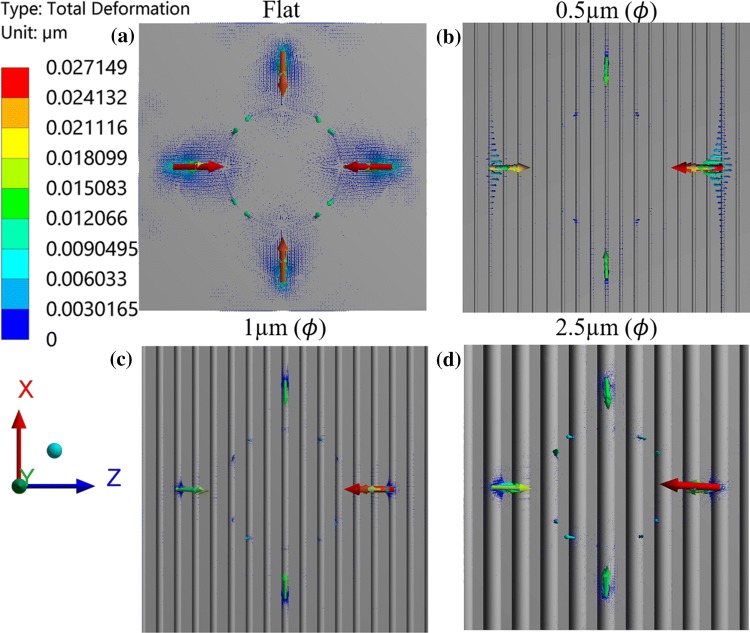
Based on experimental studies on various cell types, we hypothesize that stress and deformation in ECM and cell are dependent on the geometry and stiffness properties of the patterned surface.17,62,69 Our von Mises stress results indicate that when there is an increase in asperity diameter, neuronal cell stress decreases (refer, Fig. 11). To investigate the effect of ECM topography shape and size on the neuronal cell, we plot the ECM and neuronal cell directional deformation in X and Z-directions (refer Figs. 12a–12g). This shows that flat surface ECM exhibits symmetric deformation along X and Z-directions (refer Fig. 12a), while ECM with an asperity diameter of 2.5 µm (refer Fig. 12b) show asymmetric deformation along X and Z-directions. The cytoplasm and nucleus follow a similar symmetric and asymmetric deformation (refer Figs. 12c–12d and 12e–12f, respectively). However, asymmetric effects are more evident in the directional deformation of the nucleus (refer to Fig. 12d) than in the cytoplasm (refer to Fig. 12f). Further, when the asymmetry is higher, the ECM stiffness is closer to the ECM elastic modulus threshold. In the case of cell membrane deformation, constant maximum deformation is observed along X and Z-directions because we apply cell contractility to the cell membrane (refer Fig. 12g).
Figure 12.
(a–g) The directional deformation (X and Z directions) of ECM and neuronal cell components (nucleus, cytoplasm, and cell membrane) as a function of ECM elastic modulus. (a) That for a flat ECM surface, deformation along X and Z directions are symmetric; however, (b) ECM surface with asperity (ϕ = 2.5 µm) shows an asymmetric deformation along X (∥ to asperity) and Z (⊥ to asperity). A similar effect of symmetric deformations in the cytoplasm (c–d), and nucleus (e–f) is observed for a flat ECM, and an asymmetric deformation for asperity surface (ϕ = 2.5 µm) respectively. Inset in (a), and (b) visualizes the distribution of total deformation distribution on flat and ECM surfaces with asperity (ϕ = 2.5 µm) respectively. We perform an anisotropy test on the ECM surface with varying asperity diameter (ϕ), to test the reason for an asymmetric deformation behavior in the neuronal cell. (h) The ECM deformation along X (∥ to asperity) and Z (⊥ to asperity) as a function of cylindrical asperity diameter (ϕ). Inset in (h) shows the representation of simulated anisotropy test (by applying constant force, in X and Z directions).
From a mechanics perspective, this asymmetric behavior may be due to the anisotropic behavior of ECM asperity. In this context, anisotropy is defined as the difference in the elastic modulus along X and Z directions due to the shape and size of the ECM asperity. To further quantify the anisotropic mechanical behavior, we test ECM asperities for a constant applied force ( nN) along parallel (||) and perpendicular () directions to the asperity length (refer, Fig. 12h inset). ECM deformation for X and Z-directions are plotted in Fig. 12h with respect to increase in the cylindrical asperity diameter. This plot shows that for the same applied force, the asperity deforms more easily along the Z-direction than the X-direction. These results agree with experimental work of Rim et al.,45 which showed an asymmetric behavior of elastic modulus of gratings along the X and Z-directions. They also constructed an empirical relation which shows that the ratios of elastic modulus along the X and Z-directions ( and respectively) are inversely proportional to the ratios of deformations along the X and Z-directions ( and respectively) to a power of n (refer Eq. 3). From their experiments with ECM grating patterns, they fitted the equation and found the exponent (n) to be 0.25. To find the exponent for our ECM asperity, we fit our model results to the empirical relation and found n to be 0.1.
| 3 |
To examine the asymmetry caused by ECM asperity, we plot the vector field corresponding to total deformation of ECM (refer Fig. 13) for a flat surface and surface with asperity diameter of ϕ = 0.5, 1 and 2.5 µm respectively. The length of the vector and color code signifies the intensity and magnitude of the total deformation. From Fig. 13a, it is obvious that the flat ECM surface has a symmetric response in deformation as indicated by the vector field. However, Figs. 13b–13d shows deformation vector magnitude in Z-direction being larger than the X-direction for all ECM surfaces with asperity diameter of ϕ = 0.5–2.5 µm. These findings verify that the asymmetric elastic properties of ECM asperities along X and Z directions lead to the observed asymmetric response in neuronal cell behavior. These conclusions suggest that experiments can develop and utilize various topographies to control the directionality of neuronal cell growth.
Figure 13.
Effect of change in ECM topography on total deformation of ECM. a) Flat ECM shows the symmetric total deformation vector (red arrow). By increasing the asperity diameter (, as shown in b–d), we observe an increase in the asymmetry (red and green arrow) of the total deformation vector in the X and Z directions.
Dependence of Mechanosensing on Cell Contractility and ECM Asperity
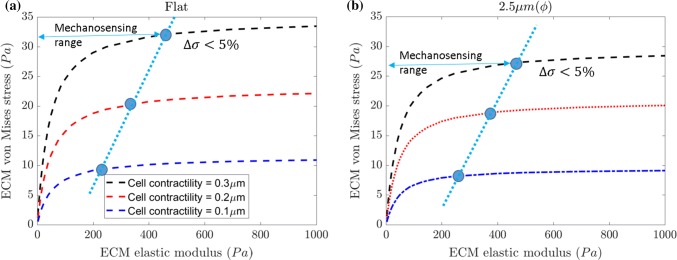
Mechanosensing of neuronal cell based on change in ECM stiffness is important to understand when selecting different ECM concentrations.2 In this study, we select an ECM concentration based on the recommendation of manufactures of ECM, and a previous study.63 We need determine how to select an ECM concentration range for maximum cell response. Depending on the cell type and its mechanical properties, the mechanosensing range will differ. The multiscale model can predict mechanosensing range, if cell mechanical properties and cell receptor properties are known. From previous experiments, we know that by increasing ECM elastic modulus, stress experienced by ECM increases due to an applied cell contractility.56 These experiments also showed that at higher ECM elastic modulus (hard gels) the change in stress is negligible. In our current multiscale model, we evaluate the mechanosensing range on the criteria that the difference in von Mises stress () should not exceed 5%. Figure 14a shows the von Mises stress due to neuronal cell contractility along with mechanosensing range point (blue dots), which is decided based on . We observe that as the cell contractility displacement decreases, the mechanosensing range also decreases (refer Fig. 14a). Similar observations were made in experiments, where decreasing the cell contractility decreased the neuronal cell differentiation.1 To examine the influence of ECM asperity we analyze for ϕ = 2.5 µm case and find that there is reduction in mechanosensing range when compared to the flat ECM surface (refer Fig. 14b).
Figure 14.
The mechanosensing range dependence on cell contractility for (a) flat surface and (b) 2.5 µm () asperity ECM
Conclusions
In this study, we developed a multiscale model that couples molecular behavior of receptors (integrin and NCAM) to the microscale neuronal cell–ECM interactions using non-linear FEA. The neuronal cell model consists of a cell membrane, cytoplasm, and nucleus and is governed by neo-Hookean and viscoelastic material models. We model dendrites such that they attach to ECM via integrins rather than assuming them to be free-standing. To study the influence of ECM stiffness and topography on the neuronal cell, we apply cell contractility and vary the ECM asperity diameter (ϕ) as a function of ECM stiffness.
An increase in ECM stiffness results in an increase in maximum von Mises stress in neuronal cell and the ECM. This ECM stiffness has a threshold elastic modulus of ≈ 500 Pa and above this value it saturates. We also observe similar saturation behavior in the cell membrane, cytoplasm, and the nucleus. Below the threshold elastic modulus point, stiffness of cell and receptors dominates the ECM stiffness, which results in a significant change to the ECM stress and displacement. We also find that ECM thickness will influence the mechanosensing of cells, if the ECM thickness is below a critical value of 1 µm. This is due to ECM stress distribution not reaching below the ECM surface. By increasing the clustering of receptors at cell–ECM interface, we observe an increase in von Mises stress of cell membrane and a decrease in ECM stress. This is consistent with experimental results, where an increase in traction is observed due to an increase in cell receptors.38
Patterned ECMs (cylindrical asperity) influences von Mises stress and deformations for both neuronal cell and the ECM. Increase in geometrical factor (asperity diameter) leads to decrease in von Mises stress and increases the displacement. This shows that asymmetric elastic property of ECM asperity results in reduction of stress and an increase in deformation. This study also demonstrates that the observed asymmetric deformation is due to difference in elastic modulus of the asperity along X (∥ to asperity) and Z (⊥ to asperity) directions. These results are expected to guide experiments to select a patterned surface for cell growth directionality. Finally, we observe a reduction in mechanosensing range when we either increase the ECM asperity diameter or decrease the cell contractility displacement.
The multi-scale model cannot predict cell shape remodeling based on ECM stiffness due to the assumption of homogeneous material property for cytoplasm. Nevertheless, as shown in Supplementary Fig. S5 the model can predict the cell asymmetry response due to ECM topography. However, it can further be used to uncover several mechanisms. Previous studies,10 have shown that neuronal cell or any other cell type vary their mechanosensing range based on their ECM stiffness. Another important characteristic is to incorporate dendrite growth and their influence on cell–cell interactions. Experimental studies40 have found that dendrite growth directionality can be controlled by changing the ECM topography. The current multiscale model can also be extended to study how controlling anisotropy from ECM topography influences the dendrite growth directionality. It was experimentally observed that the adhesion of cell–cell interactions has drastically reduced the migration of neuronal cells.25 The multiscale model introduced here can be extended to study deformation and stress under multiple types of cell interactions and can also predict the influence of ECM stiffness and topography.
Electronic supplementary material
Below is the link to the electronic supplementary material.
Electronic supplementary material 1 (PDF 477 kb)
Acknowledgments
MY and AKN would like to acknowledge the support provided by the Center for Advanced Surface Engineering (CASE) from National Science Foundation [No. OIA 1457888], and the EPSCoR Arkansas Program. In addition, we also like to acknowledge the assistance from the Arkansas High-Performance Computing Center (AHPCC).
Conflict of interest
Mohan Yasodharababu and Arun K. Nair declare that they have no conflicts of interest.
Ethical Standards
No human studies were carried out by the authors for this article.
Footnotes
Publisher's Note
Springer Nature remains neutral with regard to jurisdictional claims in published maps and institutional affiliations.
References
- 1.Ankam S, Lim CK, Yim EK. Actomyosin contractility plays a role in MAP2 expression during nanotopography-directed neuronal differentiation of human embryonic stem cells. Biomaterials. 2015;47:20–28. doi: 10.1016/j.biomaterials.2015.01.003. [DOI] [PubMed] [Google Scholar]
- 2.Baeten KM, Akassoglou K. Extracellular matrix and matrix receptors in blood-brain barrier formation and stroke. Dev. Neurobiol. 2011;71:1018–1039. doi: 10.1002/dneu.20954. [DOI] [PMC free article] [PubMed] [Google Scholar]
- 3.Balcioglu HE, van Hoorn H, Donato DM, Schmidt T, Danen EH. The integrin expression profile modulates orientation and dynamics of force transmission at cell-matrix adhesions. J. Cell Sci. 2015;128:1316–1326. doi: 10.1242/jcs.156950. [DOI] [PubMed] [Google Scholar]
- 4.Bathe M, Heussinger C, Claessens MM, Bausch AR, Frey E. Cytoskeletal bundle mechanics. Biophys. J. 2008;94:2955–2964. doi: 10.1529/biophysj.107.119743. [DOI] [PMC free article] [PubMed] [Google Scholar]
- 5.Berman HM, Kleywegt GJ, Nakamura H, Markley JL. The Protein Data Bank archive as an open data resource. J. Comput. Aided. Mol. Des. 2014;28:1009–1014. doi: 10.1007/s10822-014-9770-y. [DOI] [PMC free article] [PubMed] [Google Scholar]
- 6.Bernick KB, Prevost TP, Suresh S, Socrate S. Biomechanics of single cortical neurons. Acta Biomater. 2011;7:1210–1219. doi: 10.1016/j.actbio.2010.10.018. [DOI] [PMC free article] [PubMed] [Google Scholar]
- 7.Bidone TC, Skeeters AV, Oakes PW, Voth GA. Multiscale model of integrin adhesion assembly. PLoS Comput. Biol. 2019;15:e1007077. doi: 10.1371/journal.pcbi.1007077. [DOI] [PMC free article] [PubMed] [Google Scholar]
- 8.Brunetti V, et al. Neurons sense nanoscale roughness with nanometer sensitivity. Proc. Acad. Natl. Sci. USA. 2010;107:6264–6269. doi: 10.1073/pnas.0914456107. [DOI] [PMC free article] [PubMed] [Google Scholar]
- 9.Chen W, et al. Nanotopography influences adhesion, spreading, and self-renewal of human embryonic stem cells. ACS Nano. 2012;6:4094–4103. doi: 10.1021/nn3004923. [DOI] [PMC free article] [PubMed] [Google Scholar]
- 10.Cheng B, et al. Cellular mechanosensing of the biophysical microenvironment: a review of mathematical models of biophysical regulation of cell responses. Phys. Life Rev. 2017;22–23:88–119. doi: 10.1016/j.plrev.2017.06.016. [DOI] [PMC free article] [PubMed] [Google Scholar]
- 11.Chivet M, Hemming F, Pernet-Gallay K, Fraboulet S, Sadoul R. Emerging role of neuronal exosomes in the central nervous system. Front. Physiol. 2012;3:1–6. doi: 10.3389/fphys.2012.00145. [DOI] [PMC free article] [PubMed] [Google Scholar]
- 12.Cleveland WS. Robust locally weighted regression and smoothing scatterplots. J. Am. Stat. Assoc. 1979;74:829–836. [Google Scholar]
- 13.Deshpande V, Mrksich M, McMeeking R, Evans A. A bio-mechanical model for coupling cell contractility with focal adhesion formation. J. Mech. Phys. Solids. 2008;56:1484–1510. [Google Scholar]
- 14.Dowell-Mesfin NM, et al. Topographically modified surfaces affect orientation and growth of hippocampal neurons. J. Neural Eng. 2004;1:78–90. doi: 10.1088/1741-2560/1/2/003. [DOI] [PubMed] [Google Scholar]
- 15.Du J, et al. Extracellular matrix stiffness dictates Wnt expression through integrin pathway. Sci. Rep. 2016;6:1–12. doi: 10.1038/srep20395. [DOI] [PMC free article] [PubMed] [Google Scholar]
- 16.Elosegui-Artola A, et al. Mechanical regulation of a molecular clutch defines force transmission and transduction in response to matrix rigidity. Nat. Cell Biol. 2016;18:540–548. doi: 10.1038/ncb3336. [DOI] [PubMed] [Google Scholar]
- 17.Flight MH. Dendrites: ensuring appropriate coverage. Nat. Rev. Neurosci. 2012;13:152–153. doi: 10.1038/nrn3191. [DOI] [PubMed] [Google Scholar]
- 18.Fozdar DY, Lee JY, Schmidt CE, Chen S. Selective axonal growth of embryonic hippocampal neurons according to topographic features of various sizes and shapes. Int. J. Nanomed. 2010;6:45–57. doi: 10.2147/IJN.S12376. [DOI] [PMC free article] [PubMed] [Google Scholar]
- 19.Gyoneva L, Hovell CB, Pewowaruk RJ, Dorfman KD, Segal Y, Barocas VH. Cell-matrix interaction during strain-dependent remodelling of simulated collagen networks. Interface Focus. 2016;6:20150069. doi: 10.1098/rsfs.2015.0069. [DOI] [PMC free article] [PubMed] [Google Scholar]
- 20.Hudson SV, et al. Modeling the Kinetics of Integrin Receptor Binding to Hepatic Extracellular Matrix Proteins. Sci. Rep. 2017;7:12444. doi: 10.1038/s41598-017-12691-y. [DOI] [PMC free article] [PubMed] [Google Scholar]
- 21.Hughes CS, Postovit LM, Lajoie GA. Matrigel: a complex protein mixture required for optimal growth of cell culture. Proteomics. 2010;10:1886–1890. doi: 10.1002/pmic.200900758. [DOI] [PubMed] [Google Scholar]
- 22.Hur SS, Zhao Y, Li YS, Botvinick E, Chien S. Live cells exert 3-dimensional traction forces on their substrata. Cell Mol. Bioeng. 2009;2:425–436. doi: 10.1007/s12195-009-0082-6. [DOI] [PMC free article] [PubMed] [Google Scholar]
- 23.Janmey PA, McCulloch CA. Cell mechanics: integrating cell responses to mechanical stimuli. Annu. Rev. Biomed. Eng. 2007;9:1–34. doi: 10.1146/annurev.bioeng.9.060906.151927. [DOI] [PubMed] [Google Scholar]
- 24.Jerusalem A, Dao M. Continuum modeling of a neuronal cell under blast loading. Acta Biomater. 2012;8:3360–3371. doi: 10.1016/j.actbio.2012.04.039. [DOI] [PMC free article] [PubMed] [Google Scholar]
- 25.Jiang J, Zhang Z, Yuan X, Poo M. Spatiotemporal dynamics of traction forces show three contraction centers in migratory neurons. J. Cell Biol. 2015;209:759. doi: 10.1083/jcb.201410068. [DOI] [PMC free article] [PubMed] [Google Scholar]
- 26.Khalili AA, Ahmad MR. A review of cell adhesion studies for biomedical and biological applications. Int. J. Mol. Sci. 2015;16:18149–18184. doi: 10.3390/ijms160818149. [DOI] [PMC free article] [PubMed] [Google Scholar]
- 27.Koch D, Rosoff WJ, Jiang J, Geller HM, Urbach JS. Strength in the periphery: growth cone biomechanics and substrate rigidity response in peripheral and central nervous system neurons. Biophys. J. 2012;102:452–460. doi: 10.1016/j.bpj.2011.12.025. [DOI] [PMC free article] [PubMed] [Google Scholar]
- 28.Kollmannsberger P, Bidan CM, Dunlop JWC, Fratzl P. The physics of tissue patterning and extracellular matrix organisation: how cells join forces. Soft Matter. 2011;7:9549. [Google Scholar]
- 29.Kornmuller A, Brown CFC, Yu C, Flynn LE. Fabrication of extracellular matrix-derived foams and microcarriers as tissue-specific cell culture and delivery platforms. J. Vis. Exp. 2017 doi: 10.3791/55436. [DOI] [PMC free article] [PubMed] [Google Scholar]
- 30.Li H, Mattson JM, Zhang Y. Integrating structural heterogeneity, fiber orientation, and recruitment in multiscale ECM mechanics. J. Mech. Behav. Biomed. Mater. 2019;92:1–10. doi: 10.1016/j.jmbbm.2018.12.023. [DOI] [PMC free article] [PubMed] [Google Scholar]
- 31.Lu H, Isralewitz B, Krammer A, Vogel V, Schulten K. Unfolding of titin immunoglobulin domains by steered molecular dynamics simulation. Biophys. J. 1998;75:662–671. doi: 10.1016/S0006-3495(98)77556-3. [DOI] [PMC free article] [PubMed] [Google Scholar]
- 32.Ma X, et al. Fibers in the extracellular matrix enable long-range stress transmission between cells. Biophys. J. 2013;104:1410–1418. doi: 10.1016/j.bpj.2013.02.017. [DOI] [PMC free article] [PubMed] [Google Scholar]
- 33.Mackerell AD, Feig M, Brooks CL. Extending the treatment of backbone energetics in protein force fields: limitations of gas-phase quantum mechanics in reproducing protein conformational distributions in molecular dynamics simulations. J. Comput. Chem. 2004;25:1400–1415. doi: 10.1002/jcc.20065. [DOI] [PubMed] [Google Scholar]
- 34.MacKerell AD, et al. All-atom empirical potential for molecular modeling and dynamics studies of proteins. J. Phys. Chem. B. 1998;102:3586–3616. doi: 10.1021/jp973084f. [DOI] [PubMed] [Google Scholar]
- 35.Maruthamuthu V, Schulten K, Leckband D. Elasticity and rupture of a multi-domain neural cell adhesion molecule complex. Biophys. J. 2009;96:3005–3014. doi: 10.1016/j.bpj.2008.12.3936. [DOI] [PMC free article] [PubMed] [Google Scholar]
- 36.Mayalu MN, Kim M, Asada HH. Multi-Cell ECM compaction is predictable via superposition of nonlinear cell dynamics linearized in augmented state space. PLoS Comput. Biol. 2019;15(9):e1006798. doi: 10.1371/journal.pcbi.1006798. [DOI] [PMC free article] [PubMed] [Google Scholar]
- 37.Micholt L, Gärtner A, Prodanov D, Braeken D, Dotti CG, Bartic C. Substrate topography determines neuronal polarization and growth in vitro. PLoS ONE. 2013;8:1–14. doi: 10.1371/journal.pone.0066170. [DOI] [PMC free article] [PubMed] [Google Scholar]
- 38.Mierke CT, Frey B, Fellner M, Herrmann M, Fabry B. Integrin α5β1 facilitates cancer cell invasion through enhanced contractile forces. J. Cell Sci. 2011;124:369. doi: 10.1242/jcs.071985. [DOI] [PMC free article] [PubMed] [Google Scholar]
- 39.Monti S, et al. Exploring the conformational and reactive dynamics of biomolecules in solution using an extended version of the glycine reactive force field. Phys. Chem. Chem. Phys. 2013;15:15062–15077. doi: 10.1039/c3cp51931g. [DOI] [PubMed] [Google Scholar]
- 40.Nguyen AT, Sathe SR, Yim EK. From nano to micro: topographical scale and its impact on cell adhesion, morphology and contact guidance. J. Phys. Condens. Matter. 2016;28:183001. doi: 10.1088/0953-8984/28/18/183001. [DOI] [PubMed] [Google Scholar]
- 41.Nolte M, Pepinsky RB, Venyaminov SY, Koteliansky V, Gotwals PJ, Karpusas M. Crystal structure of the α1β1 integrin I-domain: insights into integrin I-domain function. FEBS Lett. 1999;452:379–385. doi: 10.1016/s0014-5793(99)00666-3. [DOI] [PubMed] [Google Scholar]
- 42.Plimpton S. Fast parallel algorithms for short-range molecular dynamics. J. Comput. Phys. 1995;117:1–19. [Google Scholar]
- 43.Polacheck WJ, Chen CS. Measuring cell-generated forces: a guide to the available tools. Nat. Methods. 2016;13:415–423. doi: 10.1038/nmeth.3834. [DOI] [PMC free article] [PubMed] [Google Scholar]
- 44.Recknor JB, Sakaguchi DS, Mallapragada SK. Directed growth and selective differentiation of neural progenitor cells on micropatterned polymer substrates. Biomaterials. 2006;27:4098–4108. doi: 10.1016/j.biomaterials.2006.03.029. [DOI] [PubMed] [Google Scholar]
- 45.Rim NG, Yih A, Hsi P, Wang Y, Zhang Y, Wong JY. Micropatterned cell sheets as structural building blocks for biomimetic vascular patches. Biomaterials. 2018;181:126–139. doi: 10.1016/j.biomaterials.2018.07.047. [DOI] [PMC free article] [PubMed] [Google Scholar]
- 46.Saha K, et al. Substrate modulus directs neural stem cell behavior. Biophys. J. 2008;95:4426–4438. doi: 10.1529/biophysj.108.132217. [DOI] [PMC free article] [PubMed] [Google Scholar]
- 47.Schwartz MA. Integrins and extracellular matrix in mechanotransduction. Cold Spring Harb. Perspect. Biol. 2010;2:a005066. doi: 10.1101/cshperspect.a005066. [DOI] [PMC free article] [PubMed] [Google Scholar]
- 48.Schwarz US, Erdmann T, Bischofs IB. Focal adhesions as mechanosensors: the two-spring model. Biosystems. 2006;83:225–232. doi: 10.1016/j.biosystems.2005.05.019. [DOI] [PubMed] [Google Scholar]
- 49.Schwarz US, Soine JR. Traction force microscopy on soft elastic substrates: A guide to recent computational advances. Biochim. Biophys. Acta. 1853;3095–3104:2015. doi: 10.1016/j.bbamcr.2015.05.028. [DOI] [PubMed] [Google Scholar]
- 50.Sen S, Engler AJ, Discher DE. Matrix strains induced by cells: computing how far cells can feel. Cell. Mol. Bioeng. 2009;2:39–48. doi: 10.1007/s12195-009-0052-z. [DOI] [PMC free article] [PubMed] [Google Scholar]
- 51.Shah S, Solanki A, Lee KB. Nanotechnology-based approaches for guiding neural regeneration. Acc. Chem. Res. 2016;49:17–26. doi: 10.1021/acs.accounts.5b00345. [DOI] [PMC free article] [PubMed] [Google Scholar]
- 52.Smeal RM, Tresco PA. The influence of substrate curvature on neurite outgrowth is cell type dependent. Exp. Neurol. 2008;213:281–292. doi: 10.1016/j.expneurol.2008.05.026. [DOI] [PubMed] [Google Scholar]
- 53.Smith BA, Roy H, De Koninck P, Gru P. Dendritic spine viscoelasticity and soft-glassy nature: balancing dynamic remodeling with structural stability. Biophys. J. 2007;92(4):1419–1930. doi: 10.1529/biophysj.106.092361. [DOI] [PMC free article] [PubMed] [Google Scholar]
- 54.Soba P, et al. The Ret receptor regulates sensory neuron dendrite growth and integrin mediated adhesion. Elife. 2015 doi: 10.7554/eLife.05491. [DOI] [PMC free article] [PubMed] [Google Scholar]
- 55.Solanki A, Shah S, Memoli KA, Park SY, Hong S, Lee KB. Controlling differentiation of neural stem cells using extracellular matrix protein patterns. Small. 2010;6:2509–2513. doi: 10.1002/smll.201001341. [DOI] [PMC free article] [PubMed] [Google Scholar]
- 56.Sonam S, Sathe SR, Yim EK, Sheetz MP, Lim CT. Cell contractility arising from topography and shear flow determines human mesenchymal stem cell fate. Sci. Rep. 2016;6:20415. doi: 10.1038/srep20415. [DOI] [PMC free article] [PubMed] [Google Scholar]
- 57.Song M, Uhrich KE. Optimal micropattern dimensions enhance neurite outgrowth rates, lengths, and orientations. Ann. Biomed. Eng. 2007;35:1812–1820. doi: 10.1007/s10439-007-9348-0. [DOI] [PubMed] [Google Scholar]
- 58.Song BR, et al. Three dimensional plotted extracellular matrix scaffolds using a rapid prototyping for tissue engineering application. Tissue Eng. Regen. Med. 2015;12:172–180. [Google Scholar]
- 59.Soofi SS, Last JA, Liliensiek SJ, Nealey PF, Murphy CJ. The elastic modulus of Matrigel as determined by atomic force microscopy. J. Struct. Biol. 2009;167:216–219. doi: 10.1016/j.jsb.2009.05.005. [DOI] [PMC free article] [PubMed] [Google Scholar]
- 60.Soroka V, et al. Structure and interactions of NCAM Ig1-2-3 suggest a novel zipper mechanism for homophilic adhesion. Structure. 2003;11:1291–1301. doi: 10.1016/j.str.2003.09.006. [DOI] [PubMed] [Google Scholar]
- 61.Spagnoli C, Beyder A, Besch SR, Sachs F. Drift-free atomic force microscopy measurements of cell height and mechanical properties. Rev. Sci. Instrum. 2007;78:36111. doi: 10.1063/1.2534889. [DOI] [PubMed] [Google Scholar]
- 62.Staii C, et al. Distance dependence of neuronal growth on nanopatterned gold surfaces. Langmuir. 2011;27:233–239. doi: 10.1021/la102331x. [DOI] [PubMed] [Google Scholar]
- 63.Urbanski MM, Melendez-Vasquez CV. Preparation of matrices of variable stiffness for the study of mechanotransduction in Schwann cell development. Methods Mol. Biol. 2018;1739:281–297. doi: 10.1007/978-1-4939-7649-2_18. [DOI] [PubMed] [Google Scholar]
- 64.Van Liedekerke P, et al. Quantifying the mechanics and growth of cells and tissues in 3D using high resolution computational models. bioRxiv. 2019;1:470559. [Google Scholar]
- 65.Vanderburgh J, Sterling JA, Guelcher SA. 3D printing of tissue engineered constructs for in vitro modeling of disease progression and drug screening. Ann. Biomed. Eng. 2017;45:164–179. doi: 10.1007/s10439-016-1640-4. [DOI] [PMC free article] [PubMed] [Google Scholar]
- 66.Walton EB, Vanvliet KJ. Equilibration of experimentally determined protein structures for molecular dynamics simulation. Phys. Rev. E. 2006;74:61901. doi: 10.1103/PhysRevE.74.061901. [DOI] [PubMed] [Google Scholar]
- 67.Wong HC, Tang WC. Finite element analysis of the effects of focal adhesion mechanical properties and substrate stiffness on cell migration. J. Biomech. 2011;44:1046–1050. doi: 10.1016/j.jbiomech.2011.02.004. [DOI] [PubMed] [Google Scholar]
- 68.Wu X, Reddy DS. Integrins as receptor targets for neurological disorders. Pharmacol. Ther. 2012;134:68–81. doi: 10.1016/j.pharmthera.2011.12.008. [DOI] [PMC free article] [PubMed] [Google Scholar]
- 69.Yim EKF, Reano RM, Pang SW, Yee AF, Chen CS, Leong KW. Nanopattern-induced changes in morphology and motility of smooth muscle cells. Biomaterials. 2005;26:5405–5413. doi: 10.1016/j.biomaterials.2005.01.058. [DOI] [PMC free article] [PubMed] [Google Scholar]
- 70.Zaman MH. The role of engineering approaches in analysing cancer invasion and metastasis. Nat. Rev. Cancer. 2013;13:596–603. doi: 10.1038/nrc3564. [DOI] [PubMed] [Google Scholar]
- 71.Zhang Y, Abiraman K, Li H, Pierce DM, Tzingounis AV, Lykotrafitis G. Modeling of the axon membrane skeleton structure and implications for its mechanical properties. PLoS Comput. Biol. 2017;13:e1005407. doi: 10.1371/journal.pcbi.1005407. [DOI] [PMC free article] [PubMed] [Google Scholar]
Associated Data
This section collects any data citations, data availability statements, or supplementary materials included in this article.
Supplementary Materials
Electronic supplementary material 1 (PDF 477 kb)


