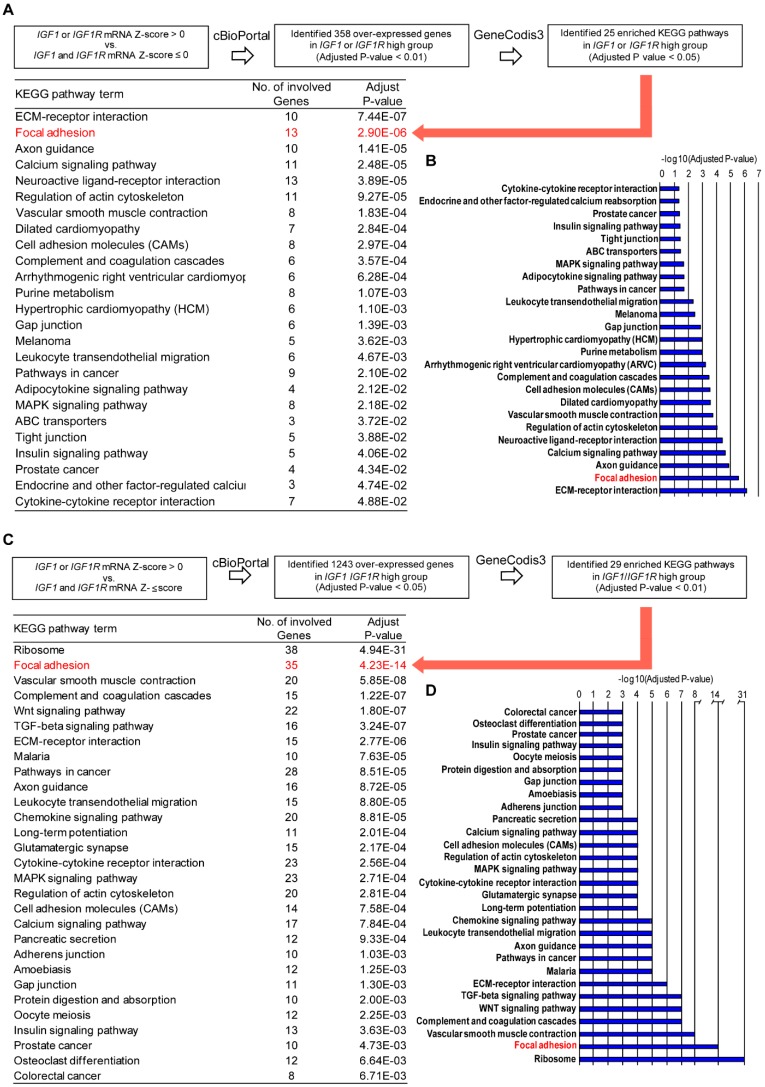
Figure 2.
Focal adhesion gene signature is a prominent enriched pathway in TNBC patients with high IGF1/IGF1R expression levels. (A) In silico analysis of IGF1/IGF1R-regulated pathways in TNBC patients in the TCGA cohort. The over-expressed genes (n. 358) in the IGF1/IGF1R high group with adjusted p-value 0.01 (Student’s t-test with Benjamini-Hochberg procedure) compared to the IGF1/IGF1R low group were chosen from the results of TNBC in the TCGA cohort. The genes were then analyzed and categorized with the KEGG Pathway Database using the GeneCodis3 pathway analysis program with the threshold of adjusted p-value < 0.05. Red arrow indicates Focal Adhesion as a prominent KEGG pathway. (B) Bar graph of the significant enrichment KEGG pathways in IGF1/IGF1R high group. (C) In silico analysis of IGF1/IGF1R-regulated pathways in TNBC patients of the METABRIC dataset. The over-expressed genes (n. 1243) in IGF1/IGF1R high group with adjusted p-value < 0.05 (Student’s t-test with Benjamini–Hochberg procedure) compared to IGF1/IGF1R low group were chosen from the results of TNBC in the METABRIC dataset. The genes were then analyzed and categorized with the KEGG Pathway Database using the GeneCodis3 pathway analysis program with the threshold of adjusted p-value < 0.01. Red arrow indicates Focal Adhesion as a prominent KEGG pathway. (D) Bar graph of the significant enrichment KEGG pathways in IGF1/IGF1R high group.

