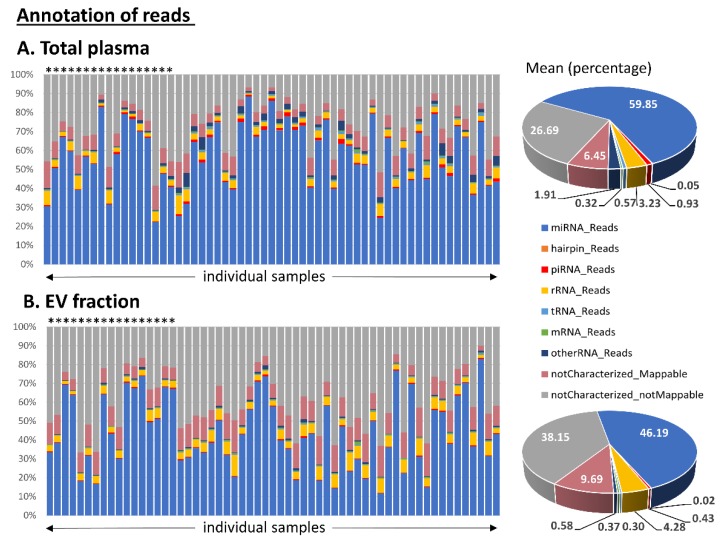
Figure 1.
Annotation of small RNA-seq data outputs of (A) total plasma samples and (B) samples from corresponding extracellular vesicles (EVs). The read percentage was calculated from the total number of annotated read counts after quality control filtering. Healthy control samples are marked with stars above the bars. The pie charts show the mean distribution of reads in the two types of material.

