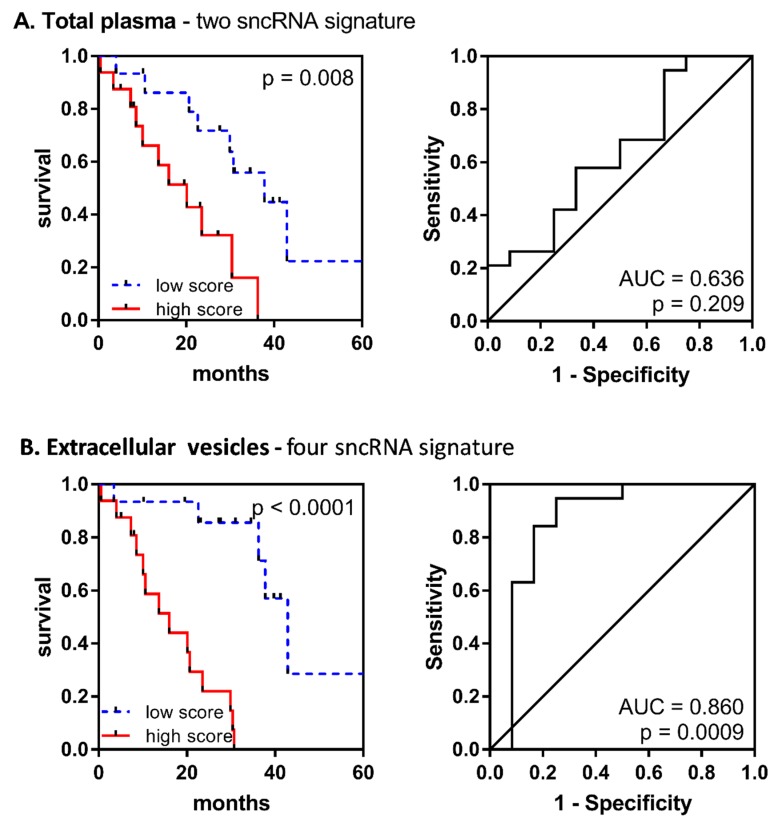
Figure 4.
Performance of the combined prognostic model for the overall survival of MDS patients. Kaplan–Meier curves and receiver operation characteristic (ROC) curves are shown for (A) a two-sncRNA signature (miR-1260b and miR-328-3p) in total plasma and (B) a four-sncRNA signature (miR-1237-3p, U33, hsa_piR_019420, and miR-548av-5p) in EVs.

