

Abstract
Loss of heterozygosity or mutation of the family with sequence similarity 46, member C (FAM46C) gene on chromosome band 1p12 is associated with shorter overall survival of patients with multiple myeloma (MM). In this study, using human MM cell lines (KMS‐11, OCI‐My5, and ANBL‐6), we generated FAM46C−/− cell clones and examined the effect of disruption of FAM46C on cell survival and cellular signaling. Cell proliferation assays showed increased clonogenicity of FAM46C−/− KMS‐11 cells compared to WT cells. Xenograft experiments showed significantly shorter overall survival of mice harboring the FAM46C−/− cell‐derived tumors than mice with the FAM46CWT cell‐derived tumors. Notably, levels of phosphorylated Akt and its substrates increased both in vitro and in vivo in the FAM46C−/− cells compared to WT cells. In addition, caspase activities decreased in the FAM46C−/− cells. Results of gene set enrichment analysis showed that loss of FAM46C significantly activated serum‐responsive genes while inactivating phosphatase and tensin homolog (PTEN)‐related genes. Mechanistically, loss of FAM46C decreased the PTEN activity, number of apoptotic cells, and caspase activities. PF‐04691502, a selective PI3K inhibitor, suppressed the augmented phosphorylation of Akt and its substrate FoxO3a. Treatment with afuresertib (a specific Akt inhibitor) in combination with bortezomib additively decreased FAM46C−/− MM cell survival. Collectively, this study is the first to report that loss of FAM46C triggers the concomitant activation of the PI3K‐Akt signaling pathway, which might be a therapeutic target for MM with abnormalities in the FAM46C gene.
Keywords: FAM46C, multiple myeloma, PI3K‐Akt, tumor suppressor, tumorigenesis
This study shows, for the first time, that FAM46C loss promotes the PI3K‐Akt signaling pathway in multiple myeloma cells. Notably, loss of FAM46C sensitized cells to specific inhibitor of PI3K‐Akt, afuresertib.

1. INTRODUCTION
Multiple myeloma (MM) is a complex plasma cell neoplasm, accounting for approximately 10% of all hematological malignancies. 1 , 2 , 3 Novel genetic evidence showed highly heterogenous molecular characteristics in patients with MM even within similar tumor types, and association of specific genetic abnormalities with the clinical outcome in patients with MM. 4 , 5 , 6 , 7 , 8 , 9 , 10 One of the chromosomal aberrations, deletion of 1p12, was associated with shorter overall survival (OS) of patients with MM. 11 In recent decades, whole‐genome sequencing approaches enabled the genomic analysis of myeloma. Somatic mutations and deletion in the FAM46C gene, located at 1p12, were detected in both patient‐derived MM cells and cell lines. 12 , 13 Because FAM46C has the fourth‐highest mutation frequency in MM, 12 , 14 it is important to understand the molecular basis underlying the involvement of mutation or deletion of FAM46C in the pathophysiology of MM.
FAM46C, also designated as terminal nucleotidyltransferase 5C (TENT5C), is located on chromosome 1p12. Loss of heterozygosity or mutation of the FAM46C gene has been identified in 5% to 13% of the patients. 7 , 8 , 9 , 12 , 14 The FAM46C gene abnormality has emerged as a novel predictor for shorter overall survival of patients with myeloma. 15 Recently, Zhu et al 16 reported that loss of FAM46C promotes cell survival in MM cells. In addition, Mroczek et al 17 reported that FAM46C acts as a tumor suppressor in MM through the activity of non‐canonical poly(A) polymerase. Although these studies elucidated the tumor‐suppressive role of FAM46C in MM cells, the relationship between loss of FAM46C and cellular signaling related to MM cell survival is still obscure.
In this study, we generated FAM46C‐deficient human MM cells using clustered regularly interspaced short palindromic repeats (CRISPR)‐Cas9 technology and investigated whether disruption of FAM46C affects cell growth, both in vitro and in vivo. We also describe the molecular mechanisms by which loss of FAM46C confers proliferative and survival advantage to MM cells.
2. MATERIALS AND METHODS
2.1. Reagents
RPMI‐1640, penicillin‐streptomycin solution, and trypsin‐EDTA solution were purchased from Wako Pure Chemical Industries. Plasmid pMSCV‐flag‐myr‐Akt1‐IRES‐GFP was a gift from Kira Gritsman and Jean Zhao (plasmid #65063; Addgene). 18 Plasmid pMSCV‐IRES‐GFP II (pMIG II) was a gift from Dario Vignali (plasmid #52107; Addgene). 19 Thiazolyl blue tetrazolium bromide (MTT) was purchased from Sigma‐Aldrich Japan. Rabbit polyclonal anti‐FAM46C Ab was obtained from Proteintech. Lenalidomide (LEN), pomalidomide (POM), bortezomib (BOR), PI3K inhibitor (PF‐0469162), 3‐phosphoinositide dependent protein kinase 1 (PDPK1) inhibitor (OSU‐03012), and Akt inhibitor (afuresertib) were from Selleck Chemicals.
2.2. Cell culture
Human MM cell lines KMS‐11, RPMI8226, KMM1, and FLAM‐76 were obtained from the Japanese Collection of Research Bioresources Cell Bank. The human MM cell line, UTMC‐2, was kindly provided by Dr Shuji Ozaki (Tokushima Prefectural Central Hospital). 20 Interleukin (IL)‐6‐dependent MM cell line ANBL‐6 was kindly provided by Dr Diane F. Jelinek (Mayo Clinic). 21 KMS‐11 and OCI‐My5 cells were maintained in RPMI‐1640 supplemented with 10% FBS (Nichirei Biosciences). The IL‐6‐dependent ANBL‐6 cells were maintained in RPMI‐1640 medium supplemented with 10% FBS in the presence of recombinant human IL‐6 (10 ng/mL; R&D Systems) at 37°C in a 5% CO2 humidified atmosphere.
2.3. Reverse transcription‐PCR and sequence analysis
The RT‐PCR analyses were undertaken as previously described. 22 The ORF of FAM46C was amplified using KOD Fxneo polymerase (Toyobo) and a specific primer set as described in Table S1. Sanger sequencing analysis was carried out using the BigDye Terminator version 3.1 Cycle Sequencing Kit (Thermo Fisher Scientific) and ABI 3500 Genetic Analyzer (Thermo Fisher Scientific).
2.4. FAM46C gene knockout using CRISPR‐Cas9 system
The CRISPR‐Cas9 system was used to disrupt the expression of the FAM46C gene, as described previously. 23 pSpCas9(BB)‐2A‐GFP (PX458) and lentiCRISPR v2 were gifted by Feng Zhang (plasmid #48138 for PX458 and plasmid #52961 for lentiCRISPR v2; Addgene). 24 , 25 A single guide RNA (sgRNA) sequence was selected using E‐CRISP (http://www.e-crisp.org/E-CRISP/designcrispr.html). The sgRNA sequences for FAM46C exon‐2 are shown in Table S1. For lentivirus preparation, 293T cells (4 × 10⁶ cells/dish) were seeded in a 10‐cm dish 1 day before transfection. Lentiviral lentiCRISPR v2 containing FAM46C sgRNA, viral packaging vector psPAX2 (a gift from Didier Trono; plasmid #12260; Addgene), and viral envelope vector pCMV‐VSV‐G (a gift from Bob Weinberg; plasmid #8454; Addgene) 26 were diluted at 4:3:2 ratio in Opti‐MEM medium (Thermo Fisher Scientific). A single clone was selected from a 96‐well plate, expanded in a 12‐well plate, and used for biological assays.
2.5. Cell viability (MTT) assay
The MM cells were seeded in 96‐well culture plates (1 × 10⁴ cells/well) and incubated in the culture medium. After incubation for 72 hours, an MTT assay was carried out as described previously. 23 The absorbance at 545 nm was measured using a SpectraMAX M5 spectrophotometer (Molecular Devices).
2.6. Annexin V assay
The MM cells were seeded in 6‐well culture plates (5 × 10⁵ cells/well) and incubated in the culture medium for 48 hours, followed by incubation with annexin V (AxV)‐FITC (Medical & Biological Laboratories) at room temperature (25°C) for 15 minutes. Finally, fluorescence intensities were determined by FACS using FACSCantoII (BD Biosciences).
2.7. Cell cycle analysis
The MM cells (5 × 10⁵ cells/well) were seeded and incubated as described above. Cell cycle analysis was undertaken as described previously. 27 Briefly, the cultured cells were fixed in ice‐cold 70% ethanol overnight. After fixation, the cells were treated with RNase A (100 μg/mL) and stained with propidium iodide (PI; 100 μg/mL). The cell cycle was analyzed with FACSCanto II (BD Biosciences). The percentages of cells in the sub‐G1, G1, S, and G2‐M phases were measured using FlowJo software (Tree Star).
2.8. Cellular caspase‐3/7 activity assay
The caspase‐3/7 assay was undertaken using a Caspase‐Glo 3/7 Assay Systems (Promega) following the manufacturer’s instructions. Briefly, cells (1 × 10⁴ cells/well) were seeded in a 96‐well culture plate and incubated for 24 hours. After the incubation, the cell suspension was transferred to a 96‐well white plate (Thermo Fisher Scientific) and 100 µL of caspase‐3/7 reagent was added to each well. Luminescence was measured using a SpectraMax M5 spectrophotometer (Molecular Devices). For normalization, data were expressed relative to caspase‐3/7 activity in parental cells, which was arbitrarily set at 100%.
2.9. Western blot analysis
Western blot analysis was carried out as described previously. 28 The Abs used in this study are described in Table S2. Immune complexes were detected using ImmunoStar LD (Wako Pure Chemical Industries) in conjunction with Amersham Imager 600 (GE Healthcare).
2.10. Gene expression analysis
FAM46C‐WT and FAM46C‐KO MM cell clones were seeded in a 6‐well plate (5 × 10⁵ cells/well) and incubated for 48 hours. Total RNA was extracted using NucleoSpin RNA with DNase treatment (TaKaRa Bio). The experimental procedure for the cDNA microarray analysis was based on the manufacturer’s protocol (Agilent Technologies), and as described previously. 23 The Cy3‐labeled cRNA was purified, fragmented, and hybridized onto a SurePrint G3 Human Gene Expression 8 × 60K v3 Chip containing 26 083 Entrez Gene RNAs, using a Gene Expression Hybridization kit (Agilent Technologies). The raw and normalized microarray data have been submitted to the GEO database at NCBI (http://www.ncbi.nlm.nih.gov/geo/query/acc.cgi?acc=GSE119451; https://www.ncbi.nlm.nih.gov/geo/query/acc.cgi?acc=GSE119451). Gene set enrichment analysis (GSEA) was undertaken according to the instructions (https://software.broadinstitute.org/gsea/index.jsp). 29 , 30
2.11. Soft‐agar colony formation assay
FAM46C‐WT and FAM46C‐KO KMS‐11 cell clones (1 × 10³ cells/well) were cast in 2 mL of 0.4% agarose (top‐layer) (Bacto agar; BD Biosciences) and poured on top of a 2 mL of 0.6% agarose (bottom layer) in 6‐well plates. After incubation for 14‐17 days, the colonies were stained with MTT solution (5 mg/mL) in PBS. Photographs were taken under bright‐field microscopy using a microscope (IX‐73; Olympus).
2.12. Xenograft experiment
Female FOX CHASE SCID C.B‐17/lcr‐scid/scidJcl mice were purchased from CLEA Japan. Mice were bred at the Institute of Animal Experiments, Aichi Medical University and 6‐ to 8‐week‐old mice were used in the experiments. The FAM46C‐WT or FAM46C‐KO KMS‐11 and OCI‐My5 cell clones (2 × 10⁷ cells) were injected into the s.c. space in the backside of Scid mice. Tumors were measured every 3 or 4 days, and tumor volumes were calculated using the modified ellipsoid formula 1/2(length × width2). Mouse survival was analyzed with Kaplan‐Meier‐based method (n = 6).
2.13. Statistical analysis
Results are expressed as mean ± SE. Statistical significance between groups was determined using one‐way ANOVA and Student’s t test. Statistical analyses were carried out using the SPSS 23.0 program (SPSS) and EZR software. 31
3. RESULTS
3.1. Disruption of FAM46C promotes tumorigenicity of myeloma cells
We first undertook western blot analysis to investigate FAM46C protein expression level using a series of human MM cell lines. Among the 12 human MM cell lines, FAM46C protein expression was detectable in KMS‐11, OCI‐My5, U266, ANBL‐6, RPMI8226, AMU‐MM1, INA‐6, and FLAM‐76 cells. However, it was barely detectable in the UTMC‐2 and NCU‐MM1 cells (Figure 1A). The FISH analysis with FAM46C/134N8 probe showed the loss of 1 copy of the FAM46Cs located on chromosome 1p in KMS‐11 cells, whereas the copy number of FAM46C was intact in ANBL‐6 and OCI‐My5 cells (Figure S1). In addition, Sanger sequence analysis did not detect FAM46C gene mutations in KMS‐11, ANBL‐6, or OCI‐My5 cells (data not shown). To disrupt the FAM46C gene in these cell lines, we utilized the CRISPR‐Cas9 system by targeting exon‐2 of FAM46C (Figure 1B). Sequencing analysis confirmed the detection of small indels in the KMS‐11 cell lines (Figure S2A). Western blot analysis showed the absence of FAM46C protein in the FAM46C‐KO cell clones, whereas it was readily detectable in the control FAM46C‐WT cell clones (Figure 1C), suggesting complete disruption of FAM46C in the FAM46C‐KO cell clones. We next examined the effect of FAM46C disruption on the proliferation of MM cells. Soft agar‐based colony formation assay showed that the size of colonies in FAM46C‐KO cell clones was significantly larger than that in the FAM46C‐WT cell clones (Figures 1D and S2B). The MTT assay showed no significant differences in proliferation ratio between the FAM46C‐KO and FAM46C‐WT KMS‐11 cells (Figure S2C), whereas the FAM46C‐KO OCI‐My5 cells significantly grew faster than the FAM46C‐WT isogenic control cells (Figure S2D). Based on the in vitro results, we undertook xenograft experiments using immunodeficient SCID mice. Importantly, the tumor growth ratio derived from FAM46C‐KO cells was substantially faster than that derived from FAM46C‐WT cells (Figure 1E,F). Furthermore, Kaplan‐Meier survival analysis showed significantly shorter survival of xenografted mice with FAM46C‐KO cell‐derived tumor (FAM46C‐KO tumor) than with FAM46C‐WT cell‐derived tumor (FAM46C‐WT tumor) (Figure 1G), suggesting that FAM46C could play a pivotal role in tumorigenesis both in vitro and in vivo.
Figure 1.

Generation of biallelic loss of the FAM46C gene in multiple myeloma (MM) cells. A, Western blot analysis showing FAM46C expression in 12 human MM cell lines. Protein lysate (10 µg) was subjected to western blot analysis to detect FAM46C protein. GAPDH was used as an internal control. B, Schematic summary of gene targeting for exon‐2 of FAM46C. A single guide RNA (arrow) sequence was designed against the exon 2 of FAM46C gene loci. C, Western blot analysis of FAM46C protein expression. FAM46C‐WT and FAM46C‐KO cells were seeded in a 6‐well plate. D, Cell clones (1000 cells/well) were resuspended in medium containing 0.3% agar and seeded in a 6‐well plate (n = 3). Data are expressed relative to the relative colony volume (%) of FAM46C‐WT KMS‐11 cells, which was defined arbitrarily as 100%. The relative colony volume was calculated using the modified ellipsoid formula 1/2 (length × width2). ** P < .005. E‐G, FAM46C‐WT or FAM46C‐KO KMS‐11 cell clone (2 × 10⁷ cells/mouse) was implanted s.c. in immunodeficient SCID mice. E, Representative photographs of tumor‐bearing mice in each group are shown. F, Each line graph shows the tumor volume (mm3), calculated using the modified ellipsoid formula 1/2(length × width2). G, Line graph shows the percentage of mouse survival (n = 6)
3.2. Loss of FAM46C upregulates serum‐responsible genes and downregulates PTEN‐related genes
To delineate the molecular mechanism by which loss of FAM46C enhances the proliferation of MM cells, we next undertook comprehensive gene expression analysis and GSEA with OCI‐My5, KMS‐11, and ANBL‐6 cells. Heatmap analysis showed that loss of FAM46C showed distinct gene expression profiles from those of FAM46C‐WT cells (Figure 2A). Notably, GSEA of oncogenic signatures in the FAM46C‐KO cells indicated significant activation of serum‐responsible genes (CSR_EARLY_UP.V1_UP) with significant inactivation of genes related to a tumor suppressor gene, phosphatase and tensin homolog (PTEN; PTEN_DN.V1_DN) (Figure 2B,C). Our gene expression analysis also showed that the genes related to PI3K‐Akt signaling are upregulated or downregulated in the FAM46C‐KO MM cells compared to FAM46C‐WT cells (Tables S3 and S4). Additionally, the GSEA analysis showed significant activation of sonic hedgehog signaling (GCNP_SHH_UP_LATE.V1_UP and GCNP_SHH_UP_EARLY.V1_UP) in the FAM46C‐KO cells (Figure S3). Furthermore, the result of the GSEA of genes using hallmark gene sets showed significant activation of IL6‐JAK‐STAT3 related genes in the FAM46C‐KO cells (HALLMARK_IL6_JAK_STAT3_SIGNALING; Figure 2D). We compared our gene expression data with previously published data (http://www.ncbi.nlm.nih.gov/geo/query/acc.cgi?acc=GSE99356 and http://www.ncbi.nlm.nih.gov/geo/query/acc.cgi?acc=GSE99358). 16 We found that there were few similarities among the gene expression profiles (Tables S5 and S6). 16 These results suggest that loss of FAM46C enhances cell proliferation by mediating oncogenic gene activation related to serum stimulation or dysregulation of the Akt signaling pathway.
Figure 2.

Gene expression analysis. cDNA microanalysis was carried out using SurePrint G3 Human 8 × 60K V3 format (Agilent). A, Heatmap of the top 50 upregulated and downregulated genes in the FAM46C‐KO cell clones. The heatmap, with the corresponding gene name on the right side, was constructed using GSEA version 2.2.4 software (Broad Institute). B‐D, All raw data were formatted and applied to oncogenic signatures (C6, B‐C) or hallmark gene sets (D). Representative GSEA enrichment plots and corresponding heatmap images of the indicated gene sets in FAM46C‐KO and FAM46C‐WT cell clones are shown. B, CSR_EARLY_UP.V1_UP signaling. C, KRAS.DF.V1_DN signaling. D, IL6_JAK_STAT3 signaling. Genes contributing to enrichment are shown in rows, and the sample is shown in one column on the heatmap. Expression level is represented as a gradient from high (red) to low (blue). FDR, false discovery rate; NES, normalized enrichment score
3.3. Loss of FAM46C enhances both in vitro and in vivo phosphorylated Akt levels
As our data suggest that PI3K‐Akt signaling could play an important role in the augmented tumorigenesis of FAM46C‐KO MM cells, we used western blot analysis to investigate the oncogenic molecules associated with the PI3K‐Akt signaling pathway. Interestingly, western blot analysis showed increased phosphorylation of Akt at both Thr308 and Ser473 in the FAM46C‐KO‐derived tumors compared to FAM46C‐WT‐derived tumors (Figure 3A). Additionally, we showed an increase in phosphorylated levels of Akt substrates, including FoxO1/3a in the FAM46C‐KO tumors (Figure 3A). Similar in vitro observations were seen in the clones derived from the KMS‐11 and ANBL‐6 cells (Figure 3B). We found that the phosphorylation levels of MAPK, including p44/42, slightly but not significantly increased in the FAM46C‐KO OCI‐My5‐derived tumors (Figure S4). We examined the effect of exogenous FAM46C expression on phosphorylation levels of Akt and its substrates in the FAM46C‐KO OCI‐My5 cells. We showed that rescuing FAM46C caused decreased Akt and FoxO3a phosphorylation (Figure 3C), but did not change the protein expression of PTEN, which is a negative regulator of PI3K‐Akt signaling (Figure 3C). Using a quantitative assay kit, we examined whether FAM46C disruption contributes to PTEN activity. Of note, PTEN activity was significantly lower in the FAM46C‐KO KMS‐11 cells than in the FAM46C‐WT KMS‐11 cells (Figure 3D). These results suggest an association between FAM46C expression and the PI3K‐Akt signaling pathway.
Figure 3.

Effect of disruption of FAM46C on the PI3K‐Akt signaling pathway. A‐C, Phosphorylation and protein expression levels of molecules involved in PI3K‐Akt signaling in vivo (A) and in vitro (B). FAM46C‐WT and FAM46C‐KO KMS‐11 (left) or OCI‐My5 (right) cell‐derived tumors from individual xenografted mice were extracted and soluble fractions were subjected to western blot analysis. Values below each blot were expressed as relative phosphorylated Akt (p‐Akt) levels, which were calculated after normalization against an internal control, GAPDH. B, Western blot analysis to examine the protein levels of FAM46C‐WT and FAM46C‐KO KMS‐11 cells (left), and ANBL‐6 (right) in vitro. C, Effect of rescuing FAM46C expression on phosphorylation levels of Akt and its substrates. Exogenous FAM46C was tagged with V5 peptide, and its expression detected using anti‐V5 tag Ab. D, Effect of disruption of FAM46C on phosphatase and tensin homolog (PTEN) activity. PTEN protein from each cell clone was immunoprecipitated using an anti‐PTEN Ab (#9559; Cell Signaling Technology). PTEN activity was measured using a PTEN Activity ELISA kit (Echelon Biosciences). Data are expressed as mean ± SE (n = 3). PIP2, phosphatidylinositol‐4 5‐bisphosphate
3.4. FAM46C disruption increases the cell cycle S‐phase ratio
Our protein analysis with the FAM46C‐KO cells suggests a significant activation of serum stimulation and/or the PI3K‐Akt signaling pathway, both of which accelerate the cell cycle and increase cell survival. Therefore, we examined whether FAM46C disruption contributes to cell cycle or apoptosis by FACS analyses using PI and AxV/PI double staining experiments. As expected, the population of S‐phase cells increased in all the FAM46C‐KO MM cells (Figure 4A). In addition, the percentage of apoptotic cells (AxV/PI double‐positive cells) decreased slightly in all the FAM46C‐KO cells (Figure 4B). Furthermore, the caspase‐3/7 activity decreased significantly in FAM46C‐KO cells compared to the FAM46C‐WT cells (Figure 4C). Similarly, the caspase‐8 and caspase‐9 activities decreased substantially in the FAM46C‐KO KMS‐11 cells compared to the FAM46C‐WT cells (Figure 4D). For investigating the role of Akt in caspase activation in MM cells, we examined the effect of constitutively active AKT1 (Myr‐AKT1) on caspase activity in the OCI‐My5 cells. Caspase‐Glo assay showed significantly decreased caspase‐8 and caspase‐9 activities in cells expressing Myr‐AKT1 compared to control cells (Figure 4E). These results suggest that FAM46C might be associated with cell survival by mediating the PI3K‐Akt signaling pathway.
Figure 4.

Effect of disruption of FAM46C on cell cycle and apoptosis in multiple myeloma cells. A, Cell cycle analysis. Cell clones (2 × 10⁵ cells/well) were seeded in a 12‐well plate and were incubated for 48 h. The cell cycle was analyzed with FACSCanto II and FlowJo software. B, Apoptosis assay with annexin V (AxV)‐based staining method. Cell clones were seeded and incubated, as described in (A). Bar graphs show the percentage of apoptotic (AxV+) cells (n = 3). PI, propidium iodide. C, D, Caspase‐3/7, caspase‐8, and caspase‐9 activities. FAM46C‐WT and FAM46C‐KO KMS‐11 cell clones were seeded and incubated as described above. E, Effect of constitutively active Myr‐Akt1 on caspase activities in OCI‐My5 cells. Retroviruses were prepared with either pMSCV‐flag‐myr‐Akt1‐IRES‐GFP or pMIG II (control) using 293T cells. *P < .05, **P < .005
3.5. Sensitivity to anti‐MM drugs in FAM46C‐KO MM cells
The involvement of FAM46C in MM cell sensitivity to anti‐MM drugs, LEN, POM, and BOR was examined using the MTT cell viability assay. The MTT assay showed slightly but not significantly reduced cell survival percentage after treatment with LEN in FAM46C‐KO KMS‐11 cells (Figure 5A), with significantly reduced cell survival percentage after treatment with POM in the FAM46C‐KO ANBL‐6 cells compared to FAM46C‐WT cells (Figure 5B). In addition, decreased cell survival percentage was noticed in FAM46C‐KO ANBL‐6 cells but not in KMS‐11 cells after treatment with BOR compared to FAM46C‐WT cells (Figure 5C). To further investigate the involvement of FAM46C in the sensitivity of MM cells to anticancer agents, we examined the effect of doxorubicin (DOX) and melphalan (MEL) on MM cell survival. Results of the MTT assay showed significantly increased cell survival percentage after treatment with both DOX and MEL in the FAM46C‐KO KMS‐11 and OCI‐My5 cells (Figure 5D,E), suggesting that MM cells with FAM46C deletion show drug resistance to treatment with DOX and MEL.
Figure 5.
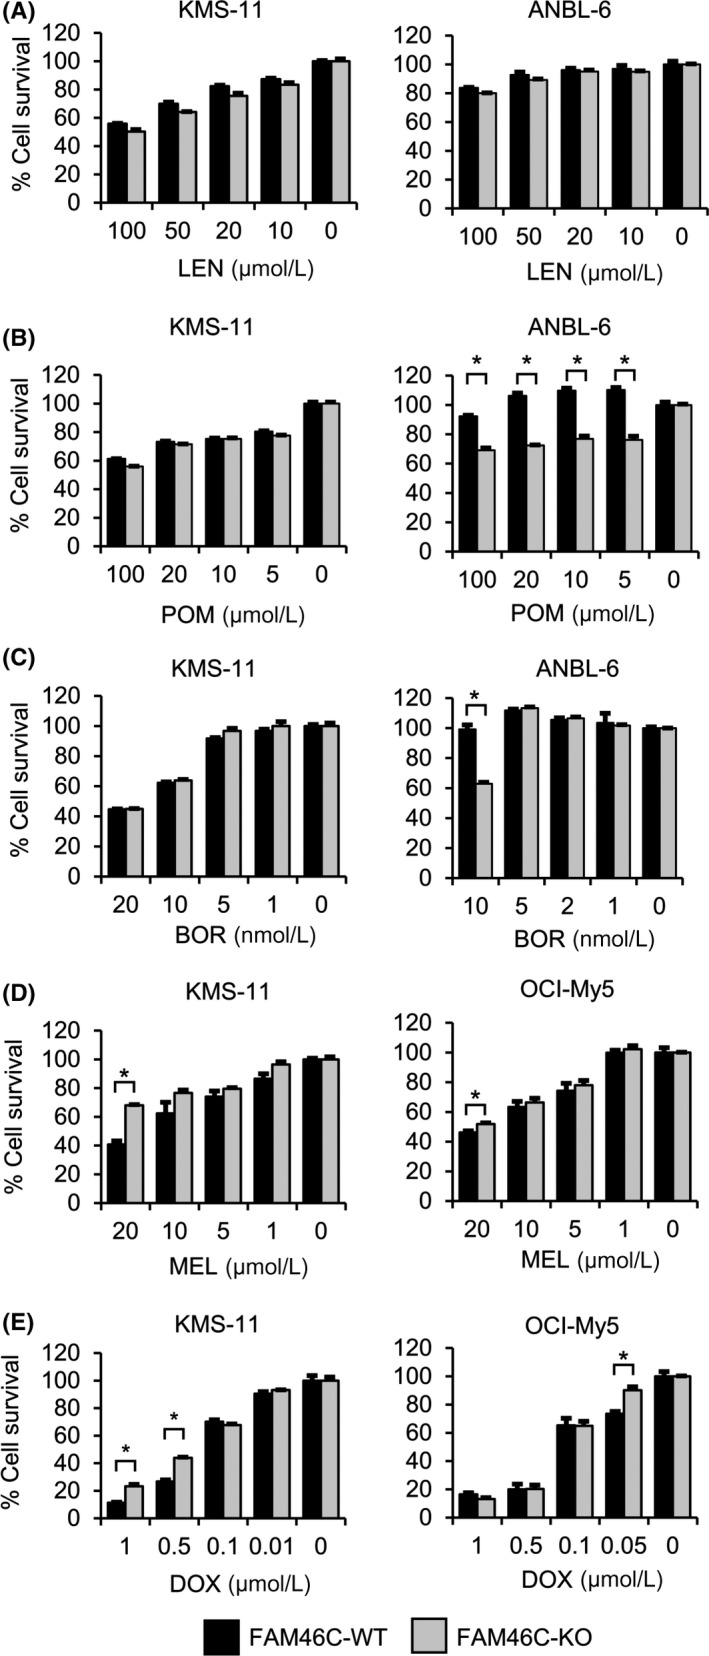
Effect of antimyeloma drugs on the survival of FAM46C‐KO cell clones. A‐C, MTT assay was undertaken with FAM46C‐KO and FAM46C‐WT cell clones. Cells were treated with the indicated concentration of antimyeloma drugs for 72 h: (A) lenalidomide (LEN; 100, 20, 10, 5, or 0 μM), (B) pomalidomide (POM; 100, 20, 10, 5, or 0 μM), (C) bortezomib (BOR; KMS‐11, 20, 10, 5, 1, or 0 nM; ANBL‐6, 10, 5, 2, 1, or 0 nM), (D) melphalan (MEL; KMS‐11 and OCI‐My5, 20, 10, 5, 1, or 0 μM), and (E) doxorubicin (DOX; KMS‐11, 1.0, 0.5, 0.1, 0.05, or 0 μM; OCI‐My5, 1.0, 0.5, 0.1, 0.01, or 0 μM). Data are expressed relative to the mean optic density (595 nm) of untreated cells, which was defined arbitrarily as 100%. Data are expressed as mean ± SE (n = 3). *P < .05
3.6. PI3K‐AKT inhibitor, sensitized FAM46C‐KO MM cells to bortezomib
To delineate the molecular mechanism by which Akt phosphorylation level increased in FAM46C‐KO MM cells, we examined the effect of specific PI3K‐Akt signaling inhibitors, including a potent and selective oral PI3K inhibitor (PF‐04691502) and a PDPK1 inhibitor (OSU‐03012) on the phosphorylation level of Akt and its substrate FoxO3a in OCI‐My5 cells. Intriguingly, western blot analysis showed decreased phosphorylation of Akt at both Thr308 and Ser473 after treatment with PF‐04691502, whereas Akt phosphorylation decreased only at Thr308 after treatment with OSU‐03012 (Figure 6A). Also, the phosphorylation levels of FoxO3a decreased after treatment with both PF‐04691502 and OSU‐03012 (Figure 6A). Results of the soft‐agar colony formation assay showed that treatment with afuresertib markedly inhibits the colony formation activity of FAM46C‐KO KMS‐11 and OCI‐My5 cell clones (Figure 6B). In addition, treatment with PF‐04691502 reduced the phosphorylation levels of Akt and FoxO3a in the FAM46C‐KO KMS‐11 cells (Figure S5). These results indicate the likelihood of PI3K involvement in augmenting Akt phosphorylation, induced by FAM46C disruption. To examine whether loss of FAM46C affects the expression of genes related to PI3K‐Akt signaling, we analyzed the expression levels of genes related to PI3K‐Akt signaling. We found that the gene expression levels, including AKT, PIK3CA, PDPK1, and PTEN, had no significant differences between FAM46C‐WT and FAM46C‐KO groups (Figures S6). We also analyzed the correlation between FAM46C expression in MM patients and expression levels of PI3K‐Akt signaling molecules using public gene expression data from the HOVON65/GMMG‐HD4 cohort study (http://www.ncbi.nlm.nih.gov/geo/query/acc.cgi?acc=GSE19784). This analysis showed that there are almost no correlations between gene expression of FAM46C and those of PI3K‐Akt signaling (Figures S7), suggesting that loss of function of FAM46C but not its expression level might be related to augmentation of PI3K‐Akt signaling in MM. We finally examined the effect of afuresertib, an Akt inhibitor with tumor‐specific antiproliferative activity, 32 on the survival of FAM46C‐KO MM cells. We showed slightly but a significantly lower percentage of cell survival in the FAM46C‐KO cells after treatment with afuresertib compared to FAM46C‐WT OCI‐My5 cells (Figure 6C). To enhance the antiproliferative activity induced by anti‐MM drugs, we evaluated the effect of afuresertib on bortezomib‐induced cytotoxic activity in FAM46C‐KO MM cells. The MTT assay showed that the combined afuresertib‐BOR treatment decreased the survival of the FAM46C‐KO OCI‐My5 cells significantly compared with monotherapy with either drug alone (Figure 6D). Similar results were observed after PI3K inhibitor (PF‐04691502) monotherapy or combined PF‐04691502‐BOR treatment (Figures S8). Collectively, these results suggest that loss of FAM46C might enhance cell survival and proliferation by mediating the PI3K‐Akt signaling pathway.
Figure 6.

Effect of specific AKT inhibitor, afuresertib, and its combination with bortezomib on the survival of FAM46C‐KO cell clones. A, Effect of specific PI3K‐Akt signaling inhibitors on phosphorylation level of Akt and its substrate, FoxO3a, in FAM46C‐KO multiple myeloma cells. FAM46C‐KO KMS‐11 cells were treated with either PF‐04691502 (a PI3K inhibitor, 0.1 μM) or OSU‐03012 (3‐phosphoinositide dependent protein kinase 1 [PDPK1] inhibitor, 10 μM) for 16 h. Cells were lysed in loading buffer, and the cell lysates were subjected to western blot analysis. B, Effect of afuresertib on the colony formation activity of FAM46C‐KO KMS‐11 and OCI‐My5 cells. Cells were treated with afuresertib (5 μM). Photographs depicting the results of the colony formation assay are shown. C, Effect of afuresertib on the survival of FAM46C‐WT (black bar) and FAM46C‐KO (gray bar) KMS‐11 cells. KMS‐11 cells were seeded and treated with the indicated concentration (OCI‐My5, 20, 10, 5, 1, or 0 μM; KMS‐11, 50, 20, 10, 5, or 0 μM) of afuresertib for 72 h. Percentage survival of the cell clones was measured by MTT assay. D, Effect of combined treatment of afuresertib with bortezomib on the survival of FAM46C‐KO OCI‐My5 (left) or KMS‐11 (right) cells. Cells were treated with the indicated concentration of afuresertib (5 μM) and bortezomib (BOR; 10 nM) for 72 h. Data are expressed as mean ± SE (n = 3). *P < .05 (n = 3)
4. DISCUSSION
The present study reports for the first time that loss of FAM46C, deleted or mutated in a subset of patients with MM, promotes Akt phosphorylation levels in MM cells both in vitro and in vivo. We also found that both the number of apoptotic cells and caspase‐3 activity were higher in the FAM46C‐KO cell clones than in the FAM46C‐WT cell clones. Furthermore, mRNA gene expression in the serum‐response gene set was significantly upregulated; in contrast, the PTEN‐related gene set was significantly downregulated in the FAM46C‐KO cell clones compared to the FAM46C‐WT cell clones. Moreover, afuresertib, an ATP‐competitive inhibitor, sensitized the FAM46C‐KO OCI‐My5 cells to bortezomib.
The Ser and Thr kinase AKT, also known as protein kinase B (PKB), is a well‐known oncogene, which augments cell survival and regulates cell death mainly through its kinase activity. 33 The kinase activity of Akt depends on the phosphorylation level at Thr308 and Ser473, both of which are mediated by extracellular growth signaling and subsequent activation of intracellular signaling, including those of PI3K or PDPK1. 33 , 34 , 35 In this study, we showed that FAM46C loss increases the phosphorylation levels of Akt at Thr308 and Ser473 both in vitro and in vivo. Consistent with the augmentation of Akt phosphorylation, the phosphorylation of Akt substrate FoxO1/3a, which regulates cell survival and cell proliferation was increased significantly in the FAM46C‐KO cells. Furthermore, gene expression profiling showed that loss of FAM46C significantly upregulates serum‐responsive genes and downregulates the genes related to PTEN, which is a well‐known negative regulator of PI3K‐Akt signaling. In addition to the observations, rescuing FAM46C expression attenuates phosphorylated levels of both Akt and FoxO3a, strongly indicating a close association of FAM46C expression with Akt activity. The phosphorylation levels of PDPK1, (which directly phosphorylates Akt, but does not show PI3K/p110α protein expression), increased in the FAM46C‐KO cells compared to the FAM46C‐WT cells. In addition, treatment with PI3K inhibitor PF‐04691502 and PDPK1 inhibitor OSU‐03012 decreased the Akt and FoxO3a phosphorylation levels, suggesting FAM46C could indirectly regulate the phosphorylation levels of Akt. Our microarray analysis also showed that loss of FAM46C does not affect the mRNA expression of genes related to PI3K‐Akt signaling. These results suggest that FAM46C might modulate the phosphorylation of Akt by mediating post‐transcriptional regulation. Activity of PTEN was observed to be significantly lower in FAM46C‐KO KMS‐11 cells than in FAM46C‐WT KMS‐11 cells, indicating that the increased phosphorylation level of Akt in FAM46C‐KO MM cells could, at least in part, be mediated by decreased PTEN activity. Protein kinase B activity is reportedly negatively regulated by other phosphatases, including protein phosphatase 2A, inositol polyphosphate‐4‐phosphatase type II, and PH domain leucine‐rich repeat protein phosphatase‐1, and positively regulated by mTORC2. 33 , 36 , 37 , 38 As our data do not necessarily clarify the molecular function of FAM46C on PI3K‐Akt signaling, further studies are warranted to uncover the molecular mechanism by which loss of FAM46C promotes PI3K‐Akt signaling in MM cells.
It has been reported that PI3K‐Akt pathway plays an important role in the pathogenesis of MM. 39 Activation of PI3K‐Akt signaling confers tumor progression to MM cells. 15 Therefore, targeting the PI3K‐Akt pathway using current standard chemotherapeutics is a novel therapeutic strategy to improve the clinical outcome of patients with MM. 40 , 41 , 42 , 43 , 44 , 45 In this study, we also showed that an ATP‐competitive Akt inhibitor, afuresertib, as well as an ATP‐competitive PI3K/mTOR dual inhibitor, PF‐04691502, enhances the cytotoxicity induced by BOR or immunomodulatory drugs. As phosphorylation levels of Akt were augmented significantly in the FAM46C‐KO cells compared to those in FAM46C‐WT cells, Akt targeting could be beneficial for MM patients with LOH or mutation of the FAM46C gene.
Association of LOH or mutation of FAM46C with impaired survival of patients with MM was shown earlier. 13 Mroczek et al have reported that FAM46C, also called TENT5C, acts as a tumor suppressor in MM cells. 19 They showed that FAM46C increases the polyadenylation of selected mRNAs, including signal‐sequence receptor subunit delta 4 (SSR4) in MM cells. In this study, the gene expression profiling showed a decrease in mRNA expression of SSR4 in the FAM46C‐KO MM cells, suggesting that FAM46C might enhance the stability of SSR4 mRNA in MM cells. As polyadenylation of RNA promotes not only nuclear export of RNA, translation initiation, and transcript stability but also RNA degradation, 46 , 47 polyadenylation activity of FAM46C might affect the function and expression of selected mRNAs. Therefore, it would be of interest to examine the effect of FAM46C and its mutants on Akt phosphorylation level and changes in gene expression.
Recently, Zhu et al 16 have reported that loss of FAM46C confers relative resistance to dexamethasone and LEN treatments. In this study, we showed varying sensitivities to anti‐MM drugs among the MM cell lines, with lower sensitivities to anticancer agents (DOX and MEL) in FAM46C‐KO MM cells compared with FAM46C‐WT cells. Resistance of FAM46C‐KO MM cells toward DOX and MEL might be due to increased caspase activities. Contrarily, FAM46C‐KO ANBL‐6 cells sensitized to treatment with POM and BOR. Indeed, the survival of ANBL‐6 cells completely depends upon presence of IL‐6, which activates various signaling pathways including Akt. As POM and BOR are known to inhibit the phosphorylation of Akt, it might be possible that loss of FAM46C increases the dependency of the survival of MM cells on PI3K‐Akt signaling in ANBL‐6 cells. These results suggest that POM and BOR might be effective for some patients with FAM46C deletion (Figure 5B,C). Given the fact that each cell line has different genomic alterations, it might be possible that anti‐MM drugs are influenced by additional cooccurring genetic alterations in MM cells with biallelic loss of the FAM46C gene. Additional studies are warranted to understand the association between drug susceptibilities and patients with MM harboring the FAM46C gene abnormality.
In conclusion, this the first study to show that loss of FAM46C enhances phosphorylation levels of Akt both in vitro and in vivo. Our results raise the possibility that the enhanced phosphorylation of Akt and its substrate could be linked to a refractory phenotype of MM cells, caused by the disruption of the FAM46C gene. Although we showed an additive antiproliferative effect of PI3K‐Akt inhibitors in FAM46C‐KO cells only in vitro, it is possible that combined treatment with anti‐MM drugs and PI3K‐Akt inhibition might coordinately suppress the tumor growth of MM cells with any LOH or mutation of FAM46C. Thus, an understanding of molecular characteristics of refractory/relapsed MM could be utilized to develop a targeted genomic therapy and novel molecular‐targeted strategies, which could lead to improved clinical outcomes in patients with MM.
DISCLOSURE
IH received honoraria from Bristol Myers Squibb, Celgene, and Takeda; Akiyoshi Takami received honoraria from Novartis. IH and AT received research funding from for joint research and clinical trial from Bristol Myers Squibb, Celgene, Astellas, Kyowa Kirin, Chugai, Yamada Yohojo, Fukuyu Hospital, and Pfizer. AO also received research funding from Celgene. The other authors declare that they have no competing interests.
ETHICAL APPROVAL
This research complies with the ethical guidelines of the Japanese Ministry of Health, Labour, and Welfare.
Supporting information
Fig S1‐S8
Table S1
Table S2
Table S3
Table S4
Table S5
Table S6
ACKNOWLEDGMENTS
We would like to thank Dr M. Okumura for animal care assistance. We thank Mr Makoto Naruse, Ms Natsumi Kodama, and colleagues at the Division of Advanced Research Promotion, Institute of Comprehensive Medical Research at Aichi Medical University for providing their technical assistance. We also thank Ms K. Hasegawa and Ms A. Nakamura for their valuable secretarial assistance. We would like to thank Editage for English language editing. This work was partly supported by Grants‐in‐Aid for Scientific Research (KAKENHI) from the Japan Society for the Promotion of Science (18K08342 to AO, IH; 19K08825 to IH, AO, and SK), YOKOYAMA Foundation for Clinical Pharmacology (YRY‐1709 to AO), Nagao Memorial Fund (to AO), Japanese Society of Myeloma Research Award (to AO), Bristol‐Myers Squibb (to IH), Celgene (AO and IH), and The Japanese Society of Hematology Research Grant (IH).
Kanasugi J, Hanamura I, Ota A, et al. Biallelic loss of FAM46C triggers tumor growth with concomitant activation of Akt signaling in multiple myeloma cells. Cancer Sci. 2020;111:1663–1675. 10.1111/cas.14386
Kanasugi, Hanamura, and Ota contributed equally to this work.
Contributor Information
Ichiro Hanamura, Email: hanamura@aichi-med-u.ac.jp.
Akinobu Ota, Email: aota@aichi-med-u.ac.jp.
REFERENCES
- 1. Kumar SK, Rajkumar V, Kyle RA, et al. Multiple myeloma. Nat Rev Dis Primers. 2017;3:17046. [DOI] [PubMed] [Google Scholar]
- 2. Anderson KC, Alsina M, Bensinger W, et al. Multiple myeloma. J Natl Compr Canc Netw. 2011;9(10):1146‐1183. [DOI] [PubMed] [Google Scholar]
- 3. Moreau P, San Miguel J, Sonneveld P, et al. Multiple myeloma: ESMO Clinical Practice Guidelines for diagnosis, treatment and follow‐up. Ann Oncol. 2017;28(suppl_4):;iv52‐iv61. [DOI] [PubMed] [Google Scholar]
- 4. Gandolfi S, Vekstein C, Laubach JP, et al. The evolving role of transplantation in multiple myeloma: the need for a heterogeneous approach to a heterogeneous disease. Clin Adv Hematol Oncol. 2018;16(8):564‐574. [PubMed] [Google Scholar]
- 5. Hoang PH, Dobbins SE, Cornish AJ, et al. Whole‐genome sequencing of multiple myeloma reveals oncogenic pathways are targeted somatically through multiple mechanisms. Leukemia. 2018;32(11):2459‐2470. [DOI] [PMC free article] [PubMed] [Google Scholar]
- 6. Robiou du Pont S, Cleynen A, Fontan C, et al. Genomics of multiple myeloma. J Clin Oncol. 2017;35:963‐967. [DOI] [PubMed] [Google Scholar]
- 7. Walker BA, Boyle EM, Wardell CP, et al. Mutational spectrum, copy number changes, and outcome: results of a sequencing study of patients with newly diagnosed myeloma. J Clin Oncol. 2015;33:3911‐3920. [DOI] [PMC free article] [PubMed] [Google Scholar]
- 8. Lohr JG, Stojanov P, Carter SL, et al. Widespread genetic heterogeneity in multiple myeloma: implications for targeted therapy. Cancer Cell. 2014;25:91‐101. [DOI] [PMC free article] [PubMed] [Google Scholar]
- 9. Bolli N, Avet‐Loiseau H, Wedge DC, et al. Heterogeneity of genomic evolution and mutational profiles in multiple myeloma. Nat Commun. 2014;5:2997. [DOI] [PMC free article] [PubMed] [Google Scholar]
- 10. Manier S, Salem KZ, Park J, Landau DA, Getz G, Ghobrial IM. Genomic complexity of multiple myeloma and its clinical implications. Nat Rev Clin Oncol. 2017;14:100‐113. [DOI] [PubMed] [Google Scholar]
- 11. Boyd KD, Ross FM, Walker BA, et al. Mapping of chromosome 1p deletions in myeloma identifies FAM46C at 1p12 and CDKN2C at 1p32.3 as being genes in regions associated with adverse survival. Clin Cancer Res. 2011;17(24):7776‐7784. [DOI] [PMC free article] [PubMed] [Google Scholar]
- 12. Chapman MA, Lawrence MS, Keats JJ, et al. Initial genome sequencing and analysis of multiple myeloma. Nature. 2011;471(7339):467‐472. [DOI] [PMC free article] [PubMed] [Google Scholar]
- 13. Walker BA, Mavrommatis K, Wardell CP, et al. Identification of novel mutational drivers reveals oncogene dependencies in multiple myeloma. Blood. 2018;132(6):587‐597. [DOI] [PMC free article] [PubMed] [Google Scholar]
- 14. Barbieri M, Manzoni M, Fabris S, et al. Compendium of FAM46C gene mutations in plasma cell dyscrasias. Br J Haematol. 2016;174:642‐645. [DOI] [PubMed] [Google Scholar]
- 15. Younes H, Leleu X, Hatjiharissi E, et al. Targeting the phosphatidylinositol 3‐kinase pathway in multiple myeloma. Clin Cancer Res. 2007;13:3771‐3775. [DOI] [PubMed] [Google Scholar]
- 16. Zhu YX, Shi CX, Bruins LA, et al. Loss of FAM46C promotes cell survival in myeloma. Cancer Res. 2017;77:4317‐4327. [DOI] [PMC free article] [PubMed] [Google Scholar]
- 17. Mroczek S, Chlebowska J, Kuliński TM, et al. The non‐canonical poly(A) polymerase FAM46C acts as an onco‐suppressor in multiple myeloma. Nat Commun. 2017;8:619. [DOI] [PMC free article] [PubMed] [Google Scholar]
- 18. Kharas MG, Okabe R, Ganis JJ, et al. Constitutively active AKT depletes hematopoietic stem cells and induces leukemia in mice. Blood. 2010;115:1406‐1415. [DOI] [PMC free article] [PubMed] [Google Scholar]
- 19. Holst J, Szymczak‐Workman AL, Vignali KM, Burton AR, Workman CJ, Vignali DA. Generation of T‐cell receptor retrogenic mice. Nat Protoc. 2006;1:406‐417. [DOI] [PubMed] [Google Scholar]
- 20. Ozaki S, Wolfenbarger D, deBram‐Hart M, Kanangat S, Weiss DT, Solomon A. Characterization of a novel interleukin‐6 autocrine‐dependent human plasma cell line. Leukemia. 1994;8:2207‐2213. [PubMed] [Google Scholar]
- 21. Jelinek DF, Ahmann GJ, Greipp PR, et al. Coexistence of aneuploid subclones within a myeloma cell line that exhibits clonal immunoglobulin gene rearrangement: clinical implications. Cancer Res. 1993;53:5320‐5327. [PubMed] [Google Scholar]
- 22. Takahashi M, Ota A, Karnan S, et al. Arsenic trioxide prevents nitric oxide production in lipopolysaccharide ‐stimulated RAW 264.7 by inhibiting a TRIF‐dependent pathway. Cancer Sci. 2013;104:165‐170. [DOI] [PMC free article] [PubMed] [Google Scholar]
- 23. Wahiduzzaman M, Ota A, Karnan S, et al. Novel combined Ato‐C treatment synergistically suppresses proliferation of Bcr‐Abl‐positive leukemic cells in vitro and in vivo. Cancer Lett. 2018;433:117‐130. [DOI] [PubMed] [Google Scholar]
- 24. Ran FA, Hsu PD, Wright J, Agarwala V, Scott DA, Zhang F. Genome engineering using the CRISPR‐Cas9 system. Nat Protoc. 2013;8:2281‐2308. [DOI] [PMC free article] [PubMed] [Google Scholar]
- 25. Sanjana NE, Shalem O, Zhang F. Improved vectors and genome‐wide libraries for CRISPR screening. Nat Methods. 2014;11:783‐784. [DOI] [PMC free article] [PubMed] [Google Scholar]
- 26. Stewart SA, Dykxhoorn DM, Palliser D, et al. Lentivirus‐delivered stable gene silencing by RNAi in primary cells. RNA. 2003;9:493‐501. [DOI] [PMC free article] [PubMed] [Google Scholar]
- 27. Ota A, Nakao H, Sawada Y, et al. Δ40p53α suppresses tumor cell proliferation and induces cellular senescence in hepatocellular carcinoma cells. J Cell Sci. 2017;130:614‐625. [DOI] [PMC free article] [PubMed] [Google Scholar]
- 28. Hossain E, Ota A, Karnan S, et al. Lipopolysaccharide augments the uptake of oxidized LDL by up‐regulating lectin‐like oxidized LDL receptor‐1 in macrophages. Mol Cell Biochem. 2015;400:29‐40. [DOI] [PubMed] [Google Scholar]
- 29. Subramanian A, Tamayo P, Mootha VK, et al. Gene set enrichment analysis: a knowledge‐based approach for interpreting genome‐wide expression profiles. Proc Natl Acad Sci USA. 2005;102:15545‐15550. [DOI] [PMC free article] [PubMed] [Google Scholar]
- 30. Mootha VK, Lindgren CM, Eriksson KF, et al. PGC‐1alpha‐responsive genes involved in oxidative phosphorylation are coordinately downregulated in human diabetes. Nat Genet. 2003;34:267‐273. [DOI] [PubMed] [Google Scholar]
- 31. Kanda Y. Investigation of the freely available easy‐to‐use software 'EZR' for medical statistics. Bone Marrow Transplant. 2013;48:452‐458. [DOI] [PMC free article] [PubMed] [Google Scholar]
- 32. Yamaji M, Ota A, Wahiduzzaman M, et al. Novel ATP‐competitive Akt inhibitor afuresertib suppresses the proliferation of malignant pleural mesothelioma cells. Cancer Med. 2017;6:2646‐2659. [DOI] [PMC free article] [PubMed] [Google Scholar]
- 33. Manning BD, Toker A. AKT/PKB signaling: navigating the network. Cell. 2017;169:381‐405. [DOI] [PMC free article] [PubMed] [Google Scholar]
- 34. Mayer IA, Arteaga CL. The PI3K/AKT pathway as a target for cancer treatment. Annu Rev Med. 2016;67:11‐28. [DOI] [PubMed] [Google Scholar]
- 35. Hemmings BA, Restuccia DF. The PI3K‐PKB/Akt pathway. Cold Spring Harb Perspect Biol. 2015;7:pii: a026609. [DOI] [PMC free article] [PubMed] [Google Scholar]
- 36. Li CC, Lunardi A, Gulluni F, et al. In vivo role of INPP4B in tumor and metastasis suppression through regulation of PI3K‐AKT signaling at endosomes. Cancer Discov. 2015;5:740‐751. [DOI] [PMC free article] [PubMed] [Google Scholar]
- 37. Gao T, Furnari F, Newton AC. PHLPP: a phosphatase that directly dephosphorylates Akt, promotes apoptosis, and suppresses tumor growth. Mol Cell. 2005;18:13‐24. [DOI] [PubMed] [Google Scholar]
- 38. Sarbassov DD, Guertin DA, Ali SM, Sabatini DM. Phosphorylation and regulation of Akt/PKB by the rictor‐mTOR complex. Science. 2005;307:1098‐1101. [DOI] [PubMed] [Google Scholar]
- 39. Mimura N, Hideshima T, Shimomura T, et al. Selective and potent Akt inhibition triggers anti‐myeloma activities and enhances fatal endoplasmic reticulum stress induced by proteasome inhibition. Cancer Res. 2014;74:4458‐4469. [DOI] [PMC free article] [PubMed] [Google Scholar]
- 40. Hideshima T, Catley L, Yasui H, et al. Perifosine, an oral bioactive novel alkylphospholipid, inhibits Akt and induces in vitro and in vivo cytotoxicity in human multiple myeloma cells. Blood. 2006;107:4053‐4062. [DOI] [PMC free article] [PubMed] [Google Scholar]
- 41. Ikeda H, Hideshima T, Fulciniti M, et al. PI3K/p110{delta} is a novel therapeutic target in multiple myeloma. Blood. 2010;116:1460‐1468. [DOI] [PMC free article] [PubMed] [Google Scholar]
- 42. Kinoshita S, Ri M, Kanamori T, et al. Potent antitumor effect of combination therapy with sub‐optimal doses of Akt inhibitors and pomalidomide plus dexamethasone in multiple myeloma. Oncol Lett. 2018;15:9450‐9456. [DOI] [PMC free article] [PubMed] [Google Scholar]
- 43. Jakubowiak AJ, Richardson PG, Zimmerman T, et al. Perifosine plus lenalidomide and dexamethasone in relapsedand relapsed/refractory multiple myeloma: a Phase I Multiple Myeloma Research Consortium study. Br J Haematol. 2012;158:472‐480. [DOI] [PubMed] [Google Scholar]
- 44. Richardson PG, Wolf J, Jakubowiak A, et al. Perifosine plus bortezomib and dexamethasone in patients with relapsed/refractory multiple myeloma previously treated with bortezomib: results of a multicenter phase I/II trial. J Clin Oncol. 2011;29:4243‐4249. [DOI] [PubMed] [Google Scholar]
- 45. Ruggero D, Sonenberg N. The Akt of translational control. Oncogene. 2005;24:7426‐7434. [DOI] [PubMed] [Google Scholar]
- 46. Slomovic S, Fremder E, Staals RH, Pruijn GJ, Schuster G. Addition of poly(A) and poly(A)‐rich tails during RNA degradation in the cytoplasm of human cells. Proc Natl Acad Sci USA. 2010;107:7407‐7412. [DOI] [PMC free article] [PubMed] [Google Scholar]
- 47. Slomovic S, Laufer D, Geiger D, Schuster G. Polyadenylation of ribosomal RNA in human cells. Nucleic Acids Res. 2006;34:2966‐2975. [DOI] [PMC free article] [PubMed] [Google Scholar]
Associated Data
This section collects any data citations, data availability statements, or supplementary materials included in this article.
Supplementary Materials
Fig S1‐S8
Table S1
Table S2
Table S3
Table S4
Table S5
Table S6