

Abstract
We aimed to verify the expression status and diagnostic significance of isocitrate dehydrogenase 1 (IDH1) in non‐small‐cell lung cancer (NSCLC), especially during early stages. Serum IDH1 levels were measured by ELISA. A total of 1223 participants (660 patients with NSCLC, 276 healthy controls [HCs], 95 patients with benign pulmonary conditions [BPCs], 135 patients with other cancers [OCs], and 57 samples with interfering factors) were divided into a training cohort and a validation cohort according to 3 testing centers. The IDH1 concentrations in the NSCLC group were obviously higher than those in the control groups (P < .001). Area under the receiver operating characteristic curves (AUCs) for discriminating NSCLC patients from controls (HC, BPC, and OC) were 0.870 and 0.745 (sensitivity, 63.3% and 55.0%; specificity, 86.8% and 86.3%) in the training cohort and validation cohort, respectively. The AUCs for discriminating stage 0‐IA lung cancer patients from HCs were 0.907 and 0.788 (sensitivity, 58.6% and 59.1%; specificity, 92.9% and 89.3%) in 2 cohorts, respectively. Isocitrate dehydrogenase 1 showed specificity for NSCLC and had no diagnostic value for other common cancers. Furthermore, IDH1 was significantly reduced in postoperative serum. Isocitrate dehydrogenase 1 shows clinical utility as a serum protein biomarker for the early diagnosis of NSCLC.
Keywords: blood biomarker, diagnosis, early detection, IDH1, NSCLC
This is the first large‐scale study aiming to verify the level and diagnostic value of serum isocitrate dehydrogenase 1 (IDH1) in non‐small‐cell lung cancer (NSCLC) with well‐designed controls in multicenter‐based cohorts. IDH1 showed high diagnostic efficiency in early stage NSCLC and high specificity for NSCLC comparing to other cancers.

Abbreviations
- AAb
autoantibody
- ADC
adenocarcinoma
- AUC
area under the curve
- BPC
benign pulmonary condition
- CI
confidence interval
- CT
computed tomography
- ECLS
EarlyCDT‐Lung Test
- HC
healthy control
- IDH1
isocitrate dehydrogenase 1
- IQR
interquartile range
- LDCT
low‐dose computed tomography
- miRNA
microRNA
- MSC
miRNA signature classifier
- NLST
National Lung Screening Trial
- NSCLC
non‐small‐cell lung cancer
- OC
other cancer
- OD
optical density
- ROC
receiver operating characteristic
- RT
room temperature
- SCC
squamous cell carcinoma
- SCLC
small‐cell lung cancer
- αKG
alpha ketoglutarate
1. INTRODUCTION
Lung cancer is the most common incident cancer and the leading cause of cancer‐related death in China and worldwide. 1 Non‐small‐cell lung cancer is the most frequent histologic subtype of lung cancer. Despite the use of many effective therapeutic approaches, including surgery, chemotherapy, radiotherapy, targeted therapy, and immunotherapy, the 5‐year survival rate of lung cancer remains rather low. 2 Lung tumors at advanced stages with lymph node or distant metastasis are the most commonly observed by clinicians. Due to the lack of early symptoms, approximately 15% of patients are diagnosed with lung cancer at a localized stage, when treatment is usually less extensive and more successful. 3 The 5‐year survival rate is 53.5% for cases detected when the disease is still localized. 4 Thus, the key to improve survival rates among lung cancer patients is early detection.
The mortality associated with lung cancer is expected to decrease in the wake of LDCT screening for early detection. Several large‐scale randomized trials have been used for evaluating the efficiency of LDCT screening worldwide. In 2011, the NLST showed that compared with chest X‐ray, LDCT screening could reduce lung cancer mortality in high‐risk groups by 20%. 5 The ongoing Dutch‐Belgian Randomized Lung Cancer Screening Trial (NELSON) was designed to explore whether LDCT screening can reduce lung cancer‐associated mortality by 25% in high‐risk groups over a 10‐year follow‐up period. 6 However, despite promising results, LDCT screening also has many limitations. First, a question remains regarding whether, in addition to age and smoking status, factors such as sex and secondhand smoking should be considered to optimize the classification of high‐risk groups. Furthermore, the high false‐positive rates of LDCT screening are an important issue. Approximately 96.4% of the positive screening results for the LDCT group in the NLST were false positive. The high rate of false‐positive results can lead to overdiagnosis and overtreatment, which can aggravate medical and psychological burden in patients. 7 Additionally, the optimization of screening programs and nodular management strategies are also aspects worth discussing. Some researchers have proposed the concept of volume doubling time for the management of lung nodules. 8 Finally, some other important factors, such as radiation dosage and cost‐effectiveness, restrict the use of LDCT screening. 9
Tumor markers in blood are important for the development of techniques involving in vitro diagnosis and are easy to obtain in a noninvasive, inexpensive, and rapid manner. The individualized diagnosis of lung cancer is a hot research topic. An accurate diagnosis of early‐stage lung cancer is difficult to achieve using existing noninvasive diagnostic methods, including imaging, sputum cytology and bronchoscopy, and blood markers are thus ideal aids. In addition, blood markers can be used as auxiliary indicators for differentiating between benign and malignant tumors, assisting staging, and monitoring therapeutic effectiveness and prognosis. Traditional blood biomarkers for lung cancer, such as CEA, CA125, SSCA, NSE, Cyfra21‐1, and proGRP, are used for diagnostic classification and prognostic evaluation, and the significance for early diagnosis or screening is not clear. However, the currently available traditional markers show low sensitivity and insufficient diagnostic effectiveness. 10 It is difficult to make an accurate diagnosis based on a single marker. Studies have investigated the combined detection of existing biomarkers to improve sensitivity, but this can result in a corresponding reduction in specificity without any obvious increased in diagnostic accuracy. 11 , 12
The development of molecular diagnostics and various omics technologies has led to the discovery of potential markers that can play an important role in the screening and early diagnosis of lung cancer. The ECLS involves a continuous optimization of combinations of 6 AAbs. 13 , 14 The ECLS has been used to aid in the early detection of lung cancer in high‐risk populations, and a 7‐AAb panel showed a sensitivity of 47% (9/10) and a specificity of 90% (739/817) in a prospective consecutive cohort that was deemed by clinicians to be at an increased risk of developing lung cancer. 15 Boeri et al 16 collected plasma of lung cancer patients before and after diagnosis by CT and found that miRNAs in the blood samples collected 1‐2 years before diagnosis predicted lung cancer. The research group further showed that a miRNA panel, referred to as the MSC, had a marked 99% negative predictive value. When the MSC was combined with LDCT, the false‐positive detection rate of LDCT could be reduced 5‐fold from 19.4% to 3.7%. In addition, the MSC was associated with the prognosis of lung cancer. 17 , 18 Cancer is a systematic disease that leads to the generation of numerous molecules, resulting from genetic alterations in cancer cells, the tumor microenvironment, or organic reactions, that can be found in blood. Thus, it is urgently necessary to explore new blood markers with increased sensitivity and specificity for the detection of early‐stage lung cancer. These markers could facilitate the early diagnosis and screening of NSCLC.
Isocitrate dehydrogenase 1 is a catalytic enzyme in the TCA cycle that is mainly found in the cytoplasm and peroxisomes. It catalyzes the oxidative decarboxylation of isocitrate to αKG, which is an important enzyme that produces NADPH in the cytoplasm. Isocitrate dehydrogenase 1 has attracted widespread attention due to the Arg132 mutation in the active center of the enzyme. Arg132‐mutant IDH1 shows novel enzymatic activity and catalyzes the generation of the carcinogenic metabolite 2‐hydroxyglutarate, resulting in a decrease in the concentration of its original product αKG. 2‐Hydroxyglutarate suppresses the activity of prolyl hydroxylase and reduces the degradation of hypoxia‐inducible factor. 19 This cancer‐associated mutation is found in approximately 70% of grade II and III gliomas, 8.5% of acute myeloid leukemia, and a few other types of tumors, but it has not been observed in lung cancer. 20 , 21 Using a proteomics discovery assay, we previously discovered that WT IDH1 is overexpressed in NSCLC tissues and that IDH1 can promote the proliferation of NSCLC cell lines and the growth of xenograft tumors in vivo. 22 In a retrospective study, by comparing 976 NSCLC patients and 479 healthy individuals, we revealed the diagnostic value of plasma IDH1 levels and showed that the diagnostic power of IDH1 for NSCLC is superior to that of traditional blood markers, such as CEA, CA125, and Cyfra21‐1. 23 Thus, IDH1 can be used as a plasma biomarker for the diagnosis of NSCLC. However, the previous study was undertaken in a single center in the absence of confounding diseases and factors included as controls and was thus not sufficient to verify the diagnostic value of the markers.
Therefore, we investigated whether IDH1 shows clinical significance for the early detection of NSCLC. In this study, we thus aimed to verify the expression status and diagnostic significance of IDH1 in NSCLC, especially in early stages and to investigate IDH1 levels in patients with benign pulmonary lesions or OC, and samples with interfering factors or posttreatment lung cancer from multiple centers.
2. MATERIALS AND METHODS
2.1. study population
In total, 1380 participants were consecutively recruited between August 2016 and April 2017 from 3 hospitals in Beijing, namely, the National Cancer Center/Cancer Hospital of the Chinese Academy of Medical Sciences and Xuanwu Hospital and Beijing Chest Hospital, Capital Medical University. The clinical trial scheme was compiled according to governmental requirements and submitted to the National Medical Products Administration.
We collected serum samples 1 week before the surgical resection of NSCLC tumors, which were diagnosed based on X‐ray, CT, and biopsy and confirmed by pathology according to the WHO’s Classification of Tumors of the Lung. 24 Tumor stage was defined according to the 7th IASLC/AJCC TNM staging system; for the purposes of this study, we classified stage 0‐IA tumors as early‐stage NSCLC. The BPC group included 21 patients with benign lung tumors (pulmonary hamartoma, sclerosing hemangioma, hemangioendothelioma, pulmonary fibroma, and atypical adenomatous hyperplasia) and 74 patients with benign pulmonary disease (chronic obstructive pulmonary disease, pneumonia, tuberculosis, pneumatocele, and chronic bronchitis). Other cancers comprised common human malignancies, such as liver, breast, esophageal, gastric, colorectal, cervical, renal, and other lung cancer including SCLC. Patients with BPCs and OCs were identified based on pathological evidence obtained by surgery, endoscopy, or sputum culture, and serum was collected before any treatment. Healthy controls were included after near‐term general cancer screening without any sign of tumor and with a CT imaging diagnosis corresponding to “No apparent abnormality was found in imaging examination”. Samples with interfering factors were enrolled based on the criteria in HCs, and represented some of the conditions, such as hyperlipidemia, hemolysis, and jaundice, that could interfere with IDH1 detection. None of the participants had a history of any malignancy or benign tumor and had not received any antitumor therapy before diagnosis or surgery. Female subjects were required not to be pregnant. We also obtained postoperative serum of 105 enrolled NSCLC patients within 1‐3 days after surgery (Figure 1).
Figure 1.
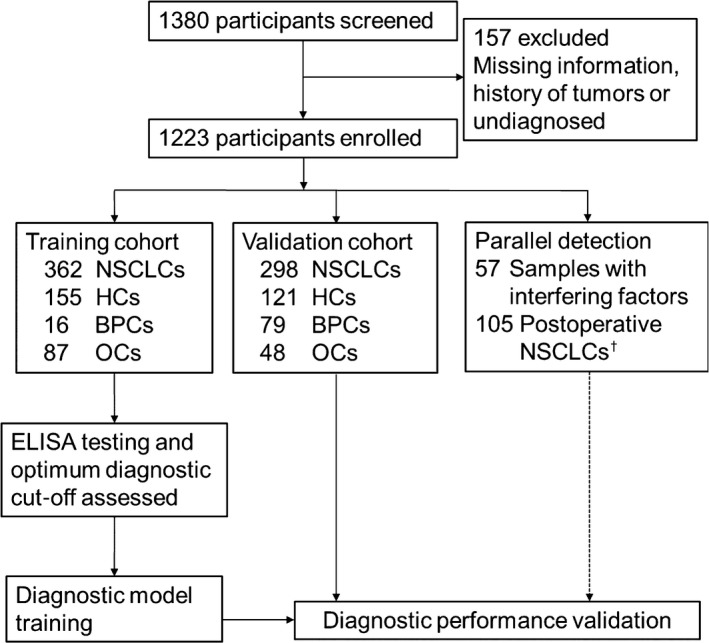
Study profile to determine the utility of isocitrate dehydrogenase 1 for the early detection of non‐small‐cell lung cancer. †Postoperative serum samples were obtained from 105 enrolled non‐small‐cell lung cancer (NSCLC) patients. BPC, benign pulmonary condition; HC, healthy control; OC, other cancer.
We excluded 157 subjects because of missing information, history of tumors, or lack of diagnosis. The remaining subjects were divided into a training cohort and a validation cohort. The training cohort comprised patients with NSCLC, BPCs, or OCs and HCs recruited from National Cancer Center/Cancer Hospital of the Chinese Academy of Medical Sciences. The validation cohort was recruited from the other 2 centers with the same grouping criteria. Detection of IDH1 expression and data collection were carried out by independent researchers at the 3 centers. The detection kit operators were blinded to diagnostic information. Patient information was kept confidential. The study was approved by medical ethics committees at the 3 centers.
2.2. Sample collection and storage
Peripheral blood samples were extracted into anticoagulant‐free tubes during routine biochemical examination for patients and centrifuged at RT for 10 minutes according to standard protocols. We collected the serum samples immediately after inspecting them at the clinical laboratory. Serum samples were centrifuged, and the supernatants were divided into 500‐μL aliquots and immediately stored at −80°C to avoid repeated freeze‐thaw cycles until testing. Serum samples were independently collected by research teams at the 3 centers. Sample collection and transportation were in accordance with standard operating procedures.
2.3. Enzyme‐linked immunosorbent assay
Diagnostic kits for the quantitative determination of IDH1 levels (ELISA) are commercially available (Beijing Modern Gaoda Biotechnology). Researchers performed IDH1 detection independently at the 3 centers following the manufacturer’s recommendations and were blinded to subjects’ clinical information. We used the same batch of kits, which were kept at 4°C.
Before the experiment, samples were thawed at RT. Meanwhile, 96‐well microtiter plates and associated components were equilibrated for 30 minutes at RT. Approximately 50 μL serum samples and standards (0, 2, 5, 10, 20, 50, and 100 ng/mL) were added to wells coated with mAb against IDH1 and incubated at 37°C for 2 hours. Then 50 μL solution A (biotinylated anti‐IDH1 Ab) and solution B (HRP conjugated with avidin) were successively added to each well and incubated at 25°C for 1 hour each time. After every incubation, the wells were thoroughly washed at least 5 times with PBS and patted dry. Then, equal volumes of substrate solution A (H2O2) and substrate solution B (3,3,5,5‐tetramethylbenzidine, TMB) were mixed. Subsequently, 50 μL of the mixed solution was added to each well for color development, and the plated were maintained in the dark for 15 minutes at 25°C. Sulfuric acid was then added to stop the reaction. Optical density was measured at 450 nm/630 nm on a multimode plate reader (Multiskan FC; Thermo Fisher Scientific). We calculated the concentrations of IDH1 with a quadratic polynomial curve that was fitted using the standard values. Concentrations of quality control samples (QC1 and QC2) were within the linear range of the curve, with 2‐5 ng/mL for QC1 and 10‐20 ng/mL for QC2. All measurements in the clinical trial were undertaken twice in duplicate, with variable coefficients less than 15%. If the optical density value was higher than 2.0, the sample was diluted and retested. The concentrations of IDH1 were set at zero when the calculated value was below the detection threshold.
2.4. Statistical analysis
Data analyses and curve plotting were undertaken with SPSS (version 17.0) and MedCalc (version 9.6.2.0). Differences between independent groups were tested with the Mann‐Whitney U test (continuous variables and nonparametric analyses). Scatter plots were constructed using GraphPad Prism version 5 for Windows. To assess sensitivity, specificity and AUC, ROC curves were constructed with 95% CIs. The correlation between serum IDH1 concentrations and clinicopathologic characteristics was analyzed with Pearson’s χ2 test and Spearman’s rank correlation test. We compared IDH1 levels in serum before and after surgical resection in NSCLC patients with the Wilcoxon matched‐pairs test.
3. RESULTS
3.1. Sample characteristics
Sample characteristics of the training (620 cases) and validation (546 cases) cohorts are shown in Table 1. The distribution of sex between the NSCLC and control groups (HC + BPC + OC) was not significantly different (Pearson’s χ2 test, P = .488 and .290 in the training and validation cohorts, respectively). Additionally, there was no clear difference in smoking status between NSCLC patients and disease controls (BPC + OC, Pearson’s χ2 test, P = .633 and .024 in the training and validation cohorts, respectively).
Table 1.
Characteristics of the study cohort
| Training cohort (620 cases) | Validation cohort (546 cases) | |||||
|---|---|---|---|---|---|---|
| NSCLC patients | HCs | Disease controls (patients with BPCs or OCs) | NSCLC patients | HCs | Disease controls (patients with BPCs or OCs) | |
| No. | 362 | 155 | 103 | 298 | 121 | 127 |
| Age, y | ||||||
| Median | 59.0 | 37.0 | 53.0 | 61.0 | 34.0 | 59.0 |
| (Q1, Q3) | (53, 65) | (31, 46) | (45, 64) | (54, 68) | (27, 45) | (50, 67) |
| Range | 35‐82 | 23‐67 | 26‐84 | 26‐85 | 18‐72 | 17‐86 |
| Sex | ||||||
| Female/male | 201/161 | 87/68 | 49/54 | 120/178 | 64/57 | 47/80 |
| Smoking status (pack × years) | ||||||
| 0 | 254 | 141 | 77 | 148 | – | 77 |
| 0‐20 | 41 | 13 | 9 | 35 | – | 18 |
| >20 | 67 | 1 | 17 | 115 | – | 32 |
| Histology, n (%) | ||||||
| ADC | 319 (88.1) | – | – | 209 (70.1) | – | – |
| SCC | 42 (11.6) | – | – | 71 (23.8) | – | – |
| Others | 1 (0.3) | – | – | 18 (6.0) | – | – |
| TNM stage, n (%) | ||||||
| 0‐IA | 222 (61.3) | – | – | 66 (22.1) | – | – |
| IB | 52 (14.4) | – | – | 39 (13.1) | – | – |
| II | 34 (9.4) | – | – | 22 (7.4) | – | – |
| III | 45 (12.4) | – | – | 57 (19.1) | – | – |
| IV | 9 (2.5) | – | – | 62 (20.8) | – | – |
| Unclear | 0 (0.0) | – | – | 52 (17.4) | – | – |
| IDH1 level (median ± IQR) | 6.13 ± 4.80 | 1.67 ± 2.15 | 2.69 ± 4.00 | 5.55 ± 7.11 | 2.90 ± 1.89 | 2.18 ± 2.59 |
–, not applicable; ADC, adenocarcinoma; BPC, benign pulmonary condition; HC, healthy control; IDH1, isocitrate dehydrogenase 1; IQR, interquartile range; NSCLC, non‐small‐cell lung cancer; OC, other cancer; Q, quartile; SCC, squamous cell carcinoma.
The median age of the 660 NSCLC patients (median age, 60 years; IQR, 14 years) was higher than that in the 506 controls (median age, 46 years; IQR, 24 years) (Mann‐Whitney U test, P < .001). Non‐small‐cell lung carcinoma was dominated by adenocarcinoma (ADC) (training cohort, 88.1%; validation cohort, 70.1%) and early‐stage cancer in the training cohort (stage 0‐I, 61.3%), with obvious distributional differences between the two cohorts (Pearson's χ2 test, histology P < .001, stage P < .001, Table 1).
We analyzed the correlation between IDH1 levels and age (Spearman's rank correlation test). Spearman's correlation coefficients were 0.023 (P = .554) in NSCLC patients and 0.028 (P = .532) in controls. Although the age distribution was different between NSCLC patients and controls, IDH1 levels were not correlated with age. Spearman's correlation coefficients between IDH1 levels and smoking status were 0.020 (P = .613) in NSCLC patients and 0.015 (P = .768) in controls, and IDH1 levels were not correlated with smoking status.
3.2. Serum IDH1 levels in NSCLC patients and controls in the training cohort
The levels of IDH1 are presented as median ± IQR, and nonparametric tests were used to compare differences in IDH1 levels among groups. The IDH1 levels in the NSCLC group (6.13 ± 4.80 ng/mL) were significantly higher than those in the control groups (HC + BPC + OC, 1.90 ± 2.81 ng/mL), with P values <.001 (Mann‐Whitney U test) (Figure 2A). The NSCLC group was then separately compared with the 3 control groups (Kruskal‐Wallis test, P < .001, adjusted α′ = 0.0083 for post hoc multiple comparisons). The levels of IDH1 in the NSCLC group were clearly higher than those in the HC group (1.67 ± 2.15 ng/mL, Mann‐Whitney U test, P < .001) and the OC group (2.29 ± 3.71 ng/mL, Mann‐Whitney U test, P < .001). However, there were slightly higher IDH1 levels in the NSCLC group than BPC group (5.49 ± 3.41 ng/mL) (Mann‐Whitney U test, P = .037). The level of IDH1 was higher in the BPC group than in the HC group (Mann‐Whitney U test, P < .001).
Figure 2.

Serum isocitrate dehydrogenase 1 (IDH1) levels in non‐small‐cell lung cancer (NSCLC) and control groups. Serum IDH1 levels in the (A) training cohort, (B) validation cohort, and (C) whole cohort. Wide horizontal lines represent median values; bars represent interquartile ranges. *P < .05; **P < .01; ***P < .001. BPC, benign pulmonary condition; HC, healthy control; ns, nonsignificant; OC, other cancer
Next, we analyzed the diagnostic performance of IDH1 by comparing AUCs plotted based on serum IDH1 concentrations in NSCLC patients and controls. The AUCs (95% CI), sensitivities, specificities, predictive values, and probabilities for different comparisons are summarized in Tables 2, S1, and S2. Figure 3A shows that the AUC for discriminating NSCLC patients from HCs was 0.915 (95% CI, 0.887‐0.942) in the training cohort, indicating reasonable discriminatory potential for IDH1 in these 2 groups. Additionally, IDH1 showed a strong ability to distinguish between the NSCLC and control groups (HC + BPC + OC), with an AUC of 0.870 (training cohort, 95% CI, 0.840‐0.899) (Table 2 and Figure 3D). We chose 5 ng/mL as the cut‐off value for IDH1, which showed a high specificity of 92.9% for HCs. This value yielded a sensitivity of 63.3% for distinguishing NSCLC patients in the training cohort. The specificity was markedly high at 84.4% for the OC group and 86.8% overall (Table 2).
Table 2.
Performance of serum isocitrate dehydrogenase 1 values for the diagnosis of non‐small‐cell lung cancer (NSCLC)
| AUC (95% CI) | Se% | Sp% | PPV% | NPV% | Positive LR | Negative LR | |
|---|---|---|---|---|---|---|---|
| Training cohort | |||||||
| NSCLC vs HC, BPC and OC | 0.870 (0.840‐0.899) | 63.3 | 86.8 | 87.1 | 62.7 | 4.80 | 0.42 |
| NSCLC vs HC | 0.915 (0.887‐0.942) | 63.3 | 92.9 | 95.4 | 52.0 | 8.91 | 0.40 |
| Stage 0‐IA NSCLC vs HC, BPC and OC | 0.859 (0.826‐0.892) | 58.6 | 86.8 | 79.3 | 70.9 | 4.44 | 0.48 |
| Stage 0‐IA NSCLC vs HC | 0.907 (0.875‐0.938) | 58.6 | 92.9 | 92.2 | 61.0 | 8.25 | 0.45 |
| Stage IB‐IV NSCLC vs HC, BPC and OC | 0.886 (0.852‐0.919) | 70.7 | 86.8 | 74.4 | 84.5 | 5.37 | 0.34 |
| Stage IB‐IV NSCLC vs HC | 0.927 (0.896‐0.958) | 70.7 | 92.9 | 90.0 | 77.8 | 9.96 | 0.32 |
| Validation cohort | |||||||
| NSCLC vs HC, BPC and OC | 0.745 (0.704‐0.786) | 55.0 | 86.3 | 82.8 | 61.5 | 4.01 | 0.52 |
| NSCLC vs HC | 0.730 (0.684‐0.776) | 55.0 | 89.3 | 92.7 | 44.6 | 5.12 | 0.50 |
| Stage 0‐IA NSCLC vs HC, BPC and OC | 0.797 (0.730‐0.865) | 59.1 | 86.3 | 53.4 | 88.8 | 4.31 | 0.47 |
| Stage 0‐IA NSCLC vs HC | 0.788 (0.711‐0.865) | 59.1 | 89.3 | 75.0 | 80.0 | 5.50 | 0.46 |
| Stage IB‐IV NSCLC vs HC, BPC and OC | 0.746 (0.697‐0.796) | 54.4 | 86.3 | 74.2 | 72.3 | 3.97 | 0.53 |
| Stage IB‐IV NSCLC vs HC | 0.732 (0.676‐0.788) | 54.4 | 89.3 | 88.3 | 56.8 | 5.07 | 0.51 |
AUC, area under the receiver operating characteristic curve; BPC, benign pulmonary condition; HC, healthy control; LR, likelihood ratio; NPV, negative predictive value; OC, other cancer; PPV, positive predictive value; Se, Sensitivity; Sp, Specificity.
Figure 3.

Receiver operating characteristic (ROC) curve analysis of the diagnostic performance of serum isocitrate dehydrogenase 1 (IDH1) levels for differentiating non‐small‐cell lung cancer (NSCLC) patients and controls in the (A, D) training cohort, (B, E) validation cohort, and (C, F) whole cohort. Black circles mark the cut‐off of values at 5 ng/mL. A‐C, ROC curves of NSCLC group vs healthy control (HC) + benign pulmonary condition + other cancer groups. D‐F, NSCLC group vs HC group
3.3. Validation of serum IDH1 levels for NSCLC patients and controls in 2 other centers
Serum IDH1 levels were independently tested in a validation cohort from 2 other hospitals. However, serum IDH1 concentration in NSCLC patients was not significantly different between the validation cohort and the training cohort (5.55 ± 7.11 ng/mL and 6.13 ± 4.80 ng/mL, respectively, Mann‐Whitney U test, P = .054). The median serum IDH1 levels were 2.90 ± 1.89 ng/mL, 2.17 ± 2.90 ng/mL, and 2.18 ± 2.11 ng/mL in the HC, BPC, and OC groups in the validation cohort, respectively. The Kruskal‐Wallis test revealed that the concentrations of IDH1 in the NSCLC group were noticeably higher than those of the control group (P values <.001 for all) but not significantly different among the HC, BPC, and OC groups.
The area under the ROC curve for discriminating the NSCLC group from the control groups (HC + BPC + OC) was 0.745 (95% CI, 0.704‐0.786) in the validation cohort, and that for discriminating NSCLC patients from HCs was 0.730 (95% CI, 0.684‐0.776) (Figure 3B,E). With 5 ng/mL as the cut‐off value for IDH1 level, sensitivity for discriminating NSCLC patients was 55.0%. The specificity was markedly high at 89.3% for the HC group, 82.3% for the BPC group, 85.4% for the OC group, and 86.3 for the overall group in the validation cohort (Table 2).
3.4. Combined analysis of the diagnostic performance of IDH1 for early‐stage NSCLC
Combined data from 3 centers were analyzed and are shown in Figure 3 and Table S2. The Kruskal‐Wallis test of IDH1 levels in the NSCLC, BPC, OC, and HC groups generated P values of less than .001. The concentration of IDH1 in the NSCLC group was 6.00 ± 5.78 ng/mL, which was obviously higher than that of control groups (HC, 2.25 ± 2.17 ng/mL; BPC, 2.56 ± 3.61 ng/mL; and OC, 3.23 ± 3.23 ng/mL). However, there was no difference among the 3 control groups. Figure 3C,F shows that the AUC for discriminating the NSCLC group from the control groups (HC + BPC + OC) was 0.818 (95% CI, 0.792‐0.842), and that for discriminating NSCLC patients from HCs was 0.841 (95% CI, 0.816‐0.866). Considering IDH1 concentration lower than 5 ng/mL as negative, the specificity of distinguishing NSCLC patients was 91.3% for the HC group, 75.8% for the BPC group, 84.4% for the OC group, and 86.6% for the overall control group. The sensitivity was 59.5% for NSCLC patients in the whole cohort (Table S2).
Next, patients with different stages of lung cancer were separately compared with controls. Serum levels of IDH1 were not different based on disease stages (stage 0‐IA, 5.88 ± 5.38 ng/mL; stage IB, 6.69 ± 5.00 ng/mL; stage II, 6.47 ± 7.98 ng/mL; stage III, 5.84 ± 5.87 ng/mL; and stage IV, 5.18 ± 6.01 ng/mL) (Figure 4A). Isocitrate dehydrogenase 1 was elevated in early‐stage lung cancer and maintained at the high level with disease progression. The AUC for discriminating stage 0‐IA lung cancer patients and HCs was 0.907 in the training cohort (95% CI, 0.875‐0.938), 0.788 in the validation cohort (95% CI, 0.711‐0.865), and 0.869 in the whole cohort (95% CI, 0.839‐0.899, Figure 4B). Thus, IDH1 is a promising marker for the identification of patients with stage 0‐I lung cancer. As mentioned above, 5 ng/mL was used as the cut‐off value for IDH1 level, and the sensitivity of NSCLC detection was 58.7% (Table S2).
Figure 4.

Diagnostic performance of isocitrate dehydrogenase 1 (IDH1) for early‐stage non‐small‐cell lung cancer (NSCLC). A, IDH1 levels in patients with different stages of lung cancer. B, Receiver operating characteristic curve analysis of IDH1 levels in early‐stage NSCLC patients vs healthy controls (HCs). Black circle indicates the cut‐off value at 5 ng/mL. ***P < .001. ns, nonsignificant
Isocitrate dehydrogenase 1 had similar diagnostic ability for lung ADC and SCC with equivalent areas under the ROC curves. The AUCs of the ADC and SCC groups vs control groups (HCs, BPCs, and OCs) were 0.822 (95% CI, 0.797‐0.848) and 0.813 (95% CI, 0.766‐0.861), respectively, for the whole cohort. Additionally, relative to the HC group, the AUCs of ADC and SCC groups were 0.846 (95% CI, 0.819‐0.873) and 0.835 (95% CI, 0.786‐0.884), respectively, within the whole cohort (Table S2). Despite slightly higher IDH1 levels in the BPC group than in the HC group in the whole cohort, there was no diagnostic significance, and the AUC was 0.549 (95% CI, 0.476‐0.623). The presence of interfering factors had a low impact on IDH1 detection, and the specificity was 84.2% in the group with interfering factors, similar to that in the control groups (Table S3).
The diagnostic performance of IDH1 was compared with that of CEA, CA125, and Cyfra21‐1, which are lung cancer markers that are used in the clinic and had been used for performance comparison in our previous study. 23 We evaluated the levels of the markers for some of the participants. Isocitrate dehydrogenase 1 was superior to the 3 markers, namely, CEA, CA125, and Cyfra21‐1, for lung ADC patients. For lung SCC patients, the AUC for IDH1 was smaller than that for Cyfra21‐1 but greater than that for CEA and CA125 (Figure S1 and Table S4). Cyfra21‐1 was the most effective marker for lung SCC.
3.5. Isocitrate dehydrogenase 1 showed specificity for NSCLC diagnosis
We examined serum IDH1 levels in patients in common types of cancer, including esophageal, stomach, liver, colorectal, breast, kidney, and cervical cancer, and SCLC. Levels of IDH1 in patients with various cancers were not different from those of HCs (Kruskal‐Wallis test, P = .088, Figure 5A). The AUCs relative to HCs for patients with these common cancers were 0.582, 0.523, 0.530, 0.572, 0.594, 0.733, 0.589, and 0.527, respectively (Figure 5B and Table S5). Therefore, IDH1 shows no diagnostic value in patients with OCs and is a relatively specific marker for the diagnosis of NSCLC.
Figure 5.

Diagnostic value of isocitrate dehydrogenase 1 (IDH1) for common human tumors. A, Serum IDH1 levels in patients with common human cancers. B, Receiver operating characteristic curve analysis for patients with esophageal, stomach, liver, colorectal, breast, kidney, cervical, or small‐cell lung cancer (SCLC) vs healthy controls (HCs)
3.6. Isocitrate dehydrogenase 1 reduced in postoperative serum of lung cancer patients
During the process of cancer development, tumor biomarkers are generated from cancer cells, the tumor microenvironment, or the host. Reductions in IDH1 levels after treatment were evaluated to confirm the correlation between circulating markers and lung cancer load. Indeed, IDH1 levels were significantly reduced in the postoperative serum of lung cancer patients (Wilcoxon matched‐pairs test, P < .0001, Figure 6). The rate of positive detection of IDH1 was 70.5% before operation (74/105), and it decreased to 5.7% (6/105) within 1‐3 days after operation. Thus, IDH1 was significantly associated with surgical resection in NSCLC patients. Therefore, circulating IDH1 was mainly released by the tumor tissue.
Figure 6.

Serum isocitrate dehydrogenase 1 (IDH1) level is significantly reduced in lung cancer patients within 1‐3 days after lung cancer surgery
4. DISCUSSION
In our previous study, IDH1 expression was higher in lung cancer tissues than in adjacent normal tissues at both transcriptional and translational levels, and plasma IDH1 was identified as a biomarker in a large cohort from a single center. In the present study, we recruited 1223 participants from 3 centers. This study is thus a further validation of the clinical utility of IDH1 as an early diagnostic biomarker for lung cancer.
This is the first study comparing IDH1 levels using HC, BPC, and OC groups as controls in a multicenter‐based cohort. The IDH1 levels are significantly increased in NSCLC patients, and ROC curve analysis showed the robust ability of IDH1 to distinguish NSCLC patients from HCs, with rather high specificity and positive predictive values (Figure 2 and Table 2). The expression level of BPCs (5.49 ± 3.41 ng/mL) was higher than HCs (1.67 ± 2.15 ng/mL) in the training cohort, but the number of cases (16 cases) was too few to draw a conclusion. Slightly increased IDH1 levels were detected in patients with BPCs; nevertheless, these levels were obviously lower than those in NSCLC patients in the whole cohort (Figure 2C). Patients with BPCs had benign tumors and some inflammatory diseases, which can be precancerous lesions or can initiate inflammatory responses. However, we could not identify a diagnostic value of IDH1 in patients with other common cancers (Figure 5). Therefore, IDH1 is a specific marker for NSCLC. Unlike the classical protein markers CEA and Cyfra21‐1, IDH1 level was already high in the early stages; this interesting phenomenon also reminds us to pay attention to the sources of IDH1 in addition to tumor release in the early stage or dig deeper whether all the serum IDH1 detected also includes various subclasses. Additionally, IDH1 levels dramatically decreased after cancer resection and were significantly related to lung cancer load (Figure 6). Isocitrate dehydrogenase 1 was superior to CEA, CA125, and Cyfra21‐1 for lung ADC patients, yet weaker than Cyfra21‐1 for lung SCC (Figure S1 and Table S4). These results were consistent with those of previous studies. 23
In addition to these confirmatory results, we found that IDH1 level is already increased in the early‐stage of lung cancer. Early‐stage NSCLC is hard to diagnose due to its rare clinical manifestation and lack of regular screening. Low‐dose CT screening can improve early detection rate, but its use is limited because of cost and need for irradiation. In contrast, testing for IDH1 using a standardized in vitro blood‐based diagnostic kit is simple, inexpensive, and easy with minimal stress. The IDH1 levels can be used to distinguish stage 0‐IA NSCLC patients from healthy individuals with 58.7% sensitivity and 91.3% specificity.
According to our results, IDH1 has many potential clinical uses. First, IDH1 is a potentially practical marker for lung cancer screening. The combined detection of tumor markers and CT screening is an important diagnostic strategy. Isocitrate dehydrogenase 1 could help to accurately identify high‐risk individuals and thus reduce the need for repeated screening, or IDH1 levels could even be used for secondary screening of LDCT‐positive individuals. Many lung nodules identified in CT scans remain undiagnosed in clinical practice. The evaluation of IDH1 levels might assist in lung cancer diagnosis by supplementing other tumor biomarkers and routine clinical examinations. Furthermore, IDH1 could be used for recurrence monitoring of NSCLC patients because of its significant reduction in postoperative serum. However, a follow‐up study for post‐treatment IDH1 levels monitoring is still needed.
Nevertheless, our study has several limitations. We did not collect follow‐up information to determine outcomes, and no monitoring tests were undertaken to analyze dynamic changes in IDH1 levels. Moreover, the number of patients with OCs was relatively small in this study. Because of its important role in the TCA cycle, IDH1 level might increase in cancers of many organs, especially the liver, which is the main metabolic organ. Further verification of IDH1 levels in a larger number of samples from patients with OCs is thus required. Metabolic reprogramming has emerged as a new hallmark of cancer. A recent study reported that WT IDH1 is involved in the regulation of metabolism of branched‐chain amino acids promoting glioma cell proliferation. 25 Thus, the number of studies on the role of WT IDH1 in tumors is gradually increasing; IDH1 in glioma and acute myeloid leukemia should be tested in the next stage of clinical experiment. However, regarding NSCLC, the underlying mechanism maintaining high expression of WT IDH1 remains unclear as does the mechanism by which increased WT IDH1 levels promote tumor occurrence and development. Thus, mechanistic investigations on WT IDH1 are still needed. In addition, we hope to increase the sample size and add follow‐up information to further validate our observations. In view of the satisfactory preliminary results in early‐stage lung cancer, we plan to determine IDH1 levels in a screening cohort to verify diagnostic potential of IDH1 combined with LDCT screening.
This is the first multicenter large‐scale validation trial investigating IDH1 levels in NSCLC. As a diagnostic marker for NSCLC, IDH1 showed excellent performance with high specificity. Isocitrate dehydrogenase 1 was a potential biomarker for identifying benign and malignant tumors and monitoring recurrence. This study is thus important for the field of lung cancer screening and diagnosis. In summary, this study verified and revealed the value of IDH1 in clinical practice. Isocitrate dehydrogenase 1 possesses potential clinical utility as a serum protein biomarker for the early diagnosis of NSCLC.
DISCLOSURE
The authors declare that no competing interest exists.
Supporting information
Supplementary Material
ACKNOWLEDGMENTS
This work was supported by the National Key R&D Program of China (2018YFC1315000, 2018YFC1315003, and 2016YFC0905400), National Natural Science Foundation of China (81871885), PUMC Youth Fund (2017320013), Non‐profit Central Research Institute Fund of Chinese Academy of Medical Sciences (2018RC320010), National Key Basic Research Development Plan (2016YFC0905400), CAMS Innovation Fund for Medical Sciences (2017‐I2M‐1‐005, 2016‐I2M‐1‐001), and Special Foundation for Central Committee Health Care (W2017BJ39). The authors thank the patients who participated in the study and the staff of clinical laboratories of all participating sites for their valuable efforts.
Sun N, Sun S, Gao Y, et al. Utility of isocitrate dehydrogenase 1 as a serum protein biomarker for the early detection of non‐small‐cell lung cancer: A multicenter in vitro diagnostic clinical trial. Cancer Sci. 2020;111:1739–1749. 10.1111/cas.14387
Nan Sun, Shouguo Sun, and Yibo Gao contributed equally to the work.
Contributor Information
Fengwei Tan, Email: tanfengwei@126.com.
Jie He, Email: prof.jiehe@gmail.com.
REFERENCES
- 1. Chen W, Zheng R, Baade PD, et al. Cancer statistics in China, 2015. CA Cancer J Clin. 2016;66:115‐132. [DOI] [PubMed] [Google Scholar]
- 2. Ettinger DS. Ten years of progress in non‐small cell lung cancer. J Natl Compr Canc Netw. 2012;10:292‐295. [DOI] [PubMed] [Google Scholar]
- 3. Siegel R, Naishadham D, Jemal A. Cancer statistics, 2013. CA Cancer J Clin. 2013;63:11‐30. [DOI] [PubMed] [Google Scholar]
- 4. DeSantis CE, Lin CC, Mariotto AB, et al. Cancer treatment and survivorship statistics, 2014. CA Cancer J Clin. 2014;64:252‐271. [DOI] [PubMed] [Google Scholar]
- 5. Aberle DR, Adams AM, Berg CD, et al. Reduced lung‐cancer mortality with low‐dose computed tomographic screening. N Engl J Med. 2011;365:395‐409. [DOI] [PMC free article] [PubMed] [Google Scholar]
- 6. Yousaf‐Khan U, van der Aalst C, de Jong PA, et al. Final screening round of the NELSON lung cancer screening trial: the effect of a 2.5‐year screening interval. Thorax. 2017;72:48‐56. [DOI] [PubMed] [Google Scholar]
- 7. Patz EF Jr, Pinsky P, Gatsonis C, et al. Overdiagnosis in low‐dose computed tomography screening for lung cancer. JAMA Intern Med. 2014;174:269‐274. [DOI] [PMC free article] [PubMed] [Google Scholar]
- 8. Horeweg N, van der Aalst CM, Vliegenthart R, et al. Volumetric computed tomography screening for lung cancer: three rounds of the NELSON trial. Eur Respir J. 2013;42:1659‐1667. [DOI] [PubMed] [Google Scholar]
- 9. Goulart BH, Bensink ME, Mummy DG, Ramsey SD. Lung cancer screening with low‐dose computed tomography: costs, national expenditures, and cost‐effectiveness. J Natl Compr Canc Netw. 2012;10:267‐275. [DOI] [PubMed] [Google Scholar]
- 10. Nakamura H, Nishimura T. History, molecular features, and clinical importance of conventional serum biomarkers in lung cancer. Surg Today. 2017;47:1037‐1059. [DOI] [PubMed] [Google Scholar]
- 11. Molina R, Marrades RM, Auge JM, et al. Assessment of a combined panel of six serum tumor markers for lung cancer. Am J Respir Crit Care Med. 2016;193:427‐437. [DOI] [PubMed] [Google Scholar]
- 12. Wang L, Wang D, Zheng G, et al. Clinical evaluation and therapeutic monitoring value of serum tumor markers in lung cancer. Int J Biol Markers. 2016;31:e80‐e87. [DOI] [PubMed] [Google Scholar]
- 13. Boyle P, Chapman CJ, Holdenrieder S, et al. Clinical validation of an autoantibody test for lung cancer. Ann Oncol. 2011;22:383‐389. [DOI] [PMC free article] [PubMed] [Google Scholar]
- 14. Murray A, Chapman CJ, Healey G, et al. Technical validation of an autoantibody test for lung cancer. Ann Oncol. 2010;21:1687‐1693. [DOI] [PMC free article] [PubMed] [Google Scholar]
- 15. Chapman CJ, Healey GF, Murray A, et al. EarlyCDT(R)‐Lung test: improved clinical utility through additional autoantibody assays. Tumour Biol. 2012;33:1319‐1326. [DOI] [PMC free article] [PubMed] [Google Scholar]
- 16. Boeri M, Verri C, Conte D, et al. MicroRNA signatures in tissues and plasma predict development and prognosis of computed tomography detected lung cancer. Proc Natl Acad Sci USA. 2011;108:3713‐3718. [DOI] [PMC free article] [PubMed] [Google Scholar]
- 17. Sestini S, Boeri M, Marchiano A, et al. Lung cancer screening in high‐risk subjects: early detection with LDCT and risk stratification using miRNA‐based blood test. Epidemiol Prev. 2016;40:42‐50. [DOI] [PubMed] [Google Scholar]
- 18. Sozzi G, Boeri M, Rossi M, et al. Clinical utility of a plasma‐based miRNA signature classifier within computed tomography lung cancer screening: a correlative MILD trial study. J Clin Oncol. 2014;32:768‐773. [DOI] [PMC free article] [PubMed] [Google Scholar]
- 19. Dang L, White DW, Gross S, et al. Cancer‐associated IDH1 mutations produce 2‐hydroxyglutarate. Nature. 2009;462:739‐744. [DOI] [PMC free article] [PubMed] [Google Scholar]
- 20. Yan H, Parsons DW, Jin G, et al. IDH1 and IDH2 mutations in gliomas. N Engl J Med. 2009;360:765‐773. [DOI] [PMC free article] [PubMed] [Google Scholar]
- 21. Mardis ER, Ding L, Dooling DJ, et al. Recurring mutations found by sequencing an acute myeloid leukemia genome. N Engl J Med. 2009;361:1058‐1066. [DOI] [PMC free article] [PubMed] [Google Scholar]
- 22. Tan F, Jiang Y, Sun N, et al. Identification of isocitrate dehydrogenase 1 as a potential diagnostic and prognostic biomarker for non‐small cell lung cancer by proteomic analysis. Mol Cell Proteomics. 2012;11:M111 008821. [DOI] [PMC free article] [PubMed] [Google Scholar]
- 23. Sun N, Chen Z, Tan F, et al. Isocitrate dehydrogenase 1 is a novel plasma biomarker for the diagnosis of non‐small cell lung cancer. Clin Cancer Res. 2013;19:5136‐5145. [DOI] [PubMed] [Google Scholar]
- 24. Travis WD, Brambilla E, Nicholson AG, et al. The 2015 world health organization classification of lung tumors: impact of genetic, clinical and radiologic advances since the 2004 classification. J Thorac Oncol. 2015;10:1243‐1260. [DOI] [PubMed] [Google Scholar]
- 25. Tonjes M, Barbus S, Park YJ, et al. BCAT1 promotes cell proliferation through amino acid catabolism in gliomas carrying wild‐type IDH1. Nat Med. 2013;19:901‐908. [DOI] [PMC free article] [PubMed] [Google Scholar]
Associated Data
This section collects any data citations, data availability statements, or supplementary materials included in this article.
Supplementary Materials
Supplementary Material