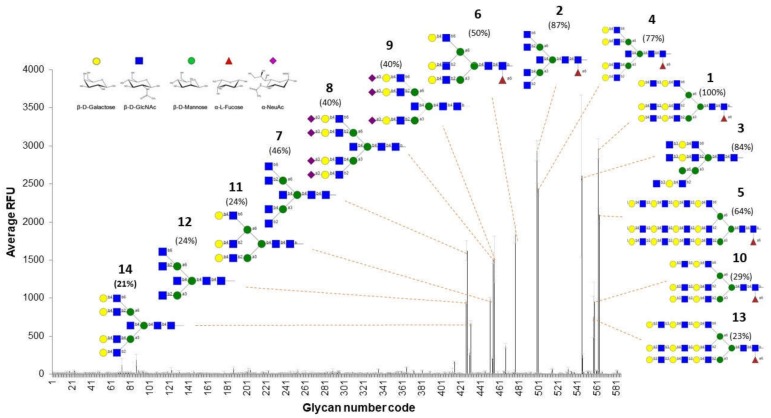
Figure 5.
Glycan array results for rTBL-1 interaction with biologically relevant oligosaccharides: The bars show the average of the relative fluorescent units (RFUs) for each glycan of the matrix at 50 µg/mL of rTBL1-FITC. Oligosaccharide structures of the top binders are shown attached to their corresponding signal. The numbers that accompany each structure indicate the ascending order of binders, starting with one as the highest RFU% (percentage of relative fluorescent units with respect to the strongest binder) for each glycan, and are indicated in parenthesis. The order of the binders and the RFU% were estimated considering the results obtained at 5 and 50 µg/mL of rTBL1-FITC.

