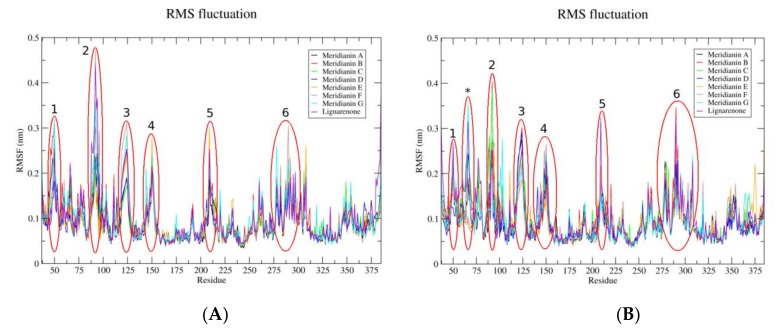
Figure 5.
Root-mean-square fluctuation (RMSF) per residue (X-axis) values of each complex, GSK3β + marine molecules separated per pocket, along the molecular dynamic (MD) simulation. The highest fluctuations (>0.25 nm) detected are highlighted with red circles and those shared between RMSFs are numbered in appearing order. The asterisk represents a fluctuation >0.25 nm only observed on the substrate pocket. (A) On the left the RMSF of each system were marine molecules are bound to the ATP cavity and (B) on the right when the marine molecules are bound to the substrate pocket. The colour code for each system can be seen in the legend box.

