Figure 6.
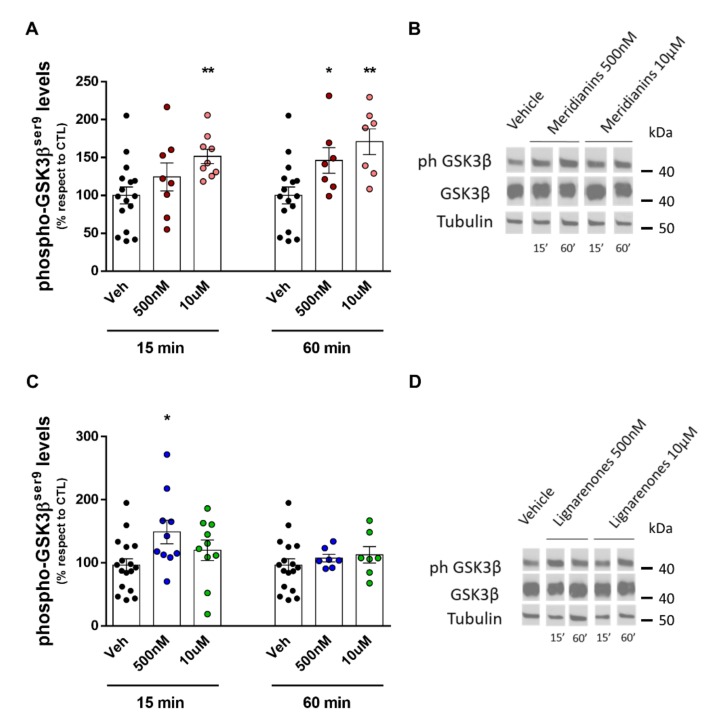
Increased GSK3β phosphorylation at Ser9 residue by meridianins and lignarenone B. Densitometric quantification of pGSK3β (A) and total GSK3β in cortical primary cultures treated with meridianins (500 nM or 10 μM) or vehicle, for 15 and 60 minutes. Protein levels were normalized with beta-tubulin as loading control. Data were expressed as (mean ± S.E.M). Data were analysed by one-way ANOVA followed by Dunnett’s test. * p < 0.05 and ** p < 0.01 compared with vehicle. (B) Representative immunoblots are shown. n = 16-9 cultures per condition at 15 min and 16-7 cultures per condition at 60 min. (C) Densitometric quantification of pGSK3β and total GSK3β in cortical primary cultures treated with lignarenone B (500 nM or 10 μM) or vehicle, for 15 and 60 min. Protein levels were normalized with beta-tubulin as loading control. Data were expressed as (mean ± S.E.M). Data were analysed by one-way ANOVA followed by Dunnett’s test. * p < 0.05 compared with vehicle. (D) Representative immunoblots are shown. n = 17–10 cultures per condition at 15 min and 17–7 cultures per condition at 60 min.

