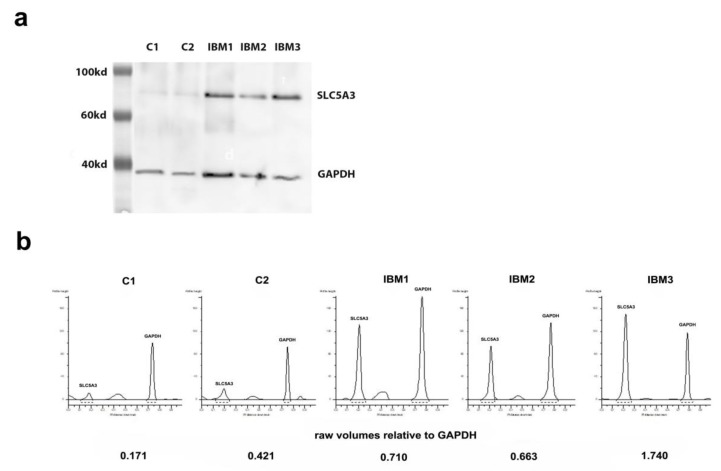
Figure 3.
(a) Western blot visualizations of SLC5A3 with the Ab3 antibody, detected simultaneously with anti-glyceraldehyde-3-phosphate dehydrogenase (GAPDH), the latter as a control for differences in protein densities of samples. Note a very faint SLC5A3 protein band in controls (C) and prominent bands in muscle samples from patients with sporadic inclusion body myositis (IBM). (b) Raw volumes of protein bands as quantified using GeneTools software, with SLC5A3 density calculated relative to the GAPDH level of the sample.

