

SUMMARY
The Toll/IL-1R-domain-containing adaptor protein SARM1 is expressed primarily in the brain, where it mediates axonal degeneration. Roles for SARM1 in TLR signaling, viral infection, inflammasome activation, and chemokine and Xaf1 expression have also been described. Much of the evidence for SARM1 function relies on SARM1-deficient mice generated in 129 ESCs and backcrossed to B6. The Sarm1 gene lies in a gene-rich region encompassing Xaf1 and chemokine loci, which remain 129 in sequence. We therefore generated additional knockout strains on the B6 background, confirming the role of SARM1 in axonal degeneration and WNV infection, but not in VSV or LACV infection, or in chemokine or Xaf1 expression. Sequence variation in proapoptotic Xaf1 between B6 and 129 results in coding changes and distinct splice variants, which may account for phenotypes previously attributed to SARM1. Reevaluation of phenotypes in these strains will be critical for understanding the function of SARM1.
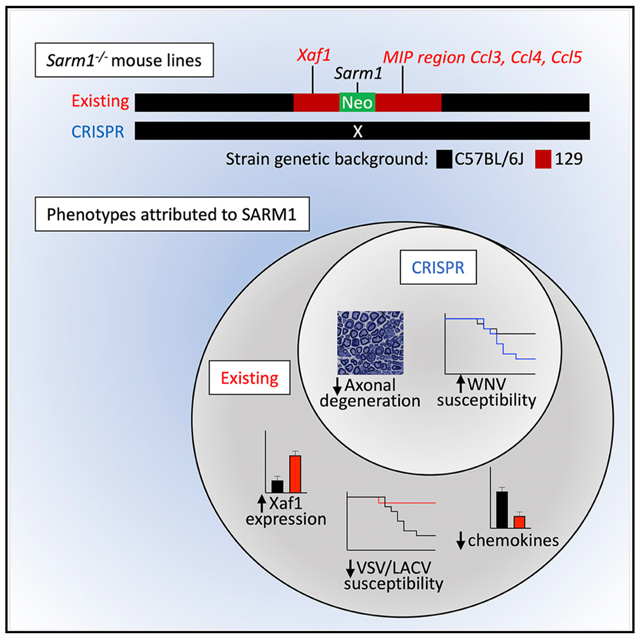
Graphical Abstract
In Brief
Existing C57BL/6J Sarm1−/− mouse lines were made on the 129 background, and genes surrounding the knockout locus remain 129 in sequence. Uccellini et al. show that CRISPR mouse lines retain decreased axonal degeneration and increased WNV susceptibility, but not VSV or LACV viral phenotypes or chemokine or Xaf1 expression phenotypes.
INTRODUCTION
Sterile alpha and TIR motif containing 1 (SARM1) is an intracellular protein that is highly expressed in the brain, and is composed of a C-terminal Toll-interleukin receptor (TIR) domain, 2 central sterile alpha motif (SAM) domains, and an N-terminal region containing multiple armadillo repeat motifs (ARMs) (Kim et al., 2007). A role for SARM1 in the axonal degeneration program termed Wallerian degeneration has been described in a genetic screen in Drosophila and has been confirmed in mice (Osterloh et al., 2012). SARM1 is an essential protein in this program, which is an active form of programmed subcellular death that leads to degeneration distal from the site of injury (Osterloh et al., 2012; Gerdts et al., 2013). Following injury to the axon, a pro-destructive signal occurs, which leads to later steps in axon degeneration involving energetic failure, influx of calcium, and proteolysis of structural proteins. Although the mechanism is not fully elucidated, SARM1 appears to be the master executioner in this cascade, which involves mitogen-activated protein kinase (MAPK) signaling and loss of NAD+ (Gerdts et al., 2016). Recent reports suggest that the SARM1 TIR domain possesses intrinsic NAD+ cleavage activity (Essuman et al., 2017), and crystal structures show that plant, as well as the SARM1 TIR domains, possess self-association-dependent NAD+ cleavage activity (Horsefield et al., 2019; Wan et al., 2019). JNK (Jun N-terminal kinase)-mediated phosphorylation of SARM1 at Ser-548 has also been reported to regulate NAD+ cleavage, leading to inhibition of mitochondrial respiration (Murata et al., 2018).
Because of the presence of the TIR domain, it was originally postulated that SARM1 would function in Toll-like receptor (TLR) signaling similar to the other cytosolic TIR-domain-containing proteins MYD88, MAL, TRIF, and TRAM. In addition, the C. elegans and Drosophila orthologs tir-1 and dSARM (ect-4) appear to have roles in immunity (Akhouayri et al., 2011; Couillault et al., 2004; Liberati et al., 2004). However, unlike the other four adaptor proteins, overexpression of SARM1 did not lead to nuclear factor κB (NF-κB) or interferon regulatory factor 3 (IRF3) activation but rather inhibited TLR signaling (Carty et al., 2006). Several overexpression studies have supported a role for SARM1 in suppressing TLR responses; however, studies in knockout mice have not (Kim et al., 2007). Importantly, the SARM1 TIR domain appears to be evolutionarily ancestral to the mammalian TLR adaptors because of its closer homology to bacterial TIR domains, suggesting that it may not function as a TLR adaptor (Zhang et al., 2011; Malapati et al., 2017). However, it appears that in mice, SARM1 does function in cellular stress responses, including hypoxia and chemotherapy-induced peripheral neuropathy.
SARM1 also appears to play a role in susceptibility to infections of the CNS, although whether this function is distinct from its role in axonal degeneration is unknown. Two knockout strains for SARM1 have been generated, one in the Ding lab, here called Sarm1AD, and one in the Diamond lab, here called Sarm1MSD. Sarm1MSD mice are more susceptible to West Nile virus (WNV) infection and produce less tumor necrosis factor alpha (TNF-α) Szretter et al., 2009). In contrast, SarmMSD mice are protected from lethal La Crosse virus (LACV) infection (Mukherjee et al., 2013). Our previous studies found that Sarm1AD mice were also protected from lethal vesicular stomatitis virus (VSV) infection and produced fewer cytokines and chemokines in the brain (Hou et al., 2013). A role for SARM1 in immunity has only been shown for viral infections in the CNS, which is in agreement with its predominant expression pattern in the brain. We did not find differences in the susceptibility of Sarm1AD mice to M. tuberculosis, L. monocytogenes, or influenza virus infection (Hou et al., 2013). When Sarm1AD macrophages were examined in response to various TLR ligands, no differences were found in the production of TNF-α or CCL2 (C-C Motif Chemokine Ligand 2) (Kim et al., 2007). However, SARM1 was reported to regulate CCL5 production in Sarm1AD macrophages. This defect was specific to CCL5, occurred in response to TLR and non-TLR stimuli, and did not involve known signaling intermediates, but it was associated with recruitment of RNA polymerase II (RNA Pol II) and transcription factors to the CCL5 locus (Gürtler et al., 2014). A recent report also described both positive and negative roles for SARM1 in inflammasome activation in Sarm1AD mice, whereby SARM1 positively regulates pyroptosis and negatively regulates interleukin-1 β (IL-1 β) secretion (Carty et al., 2019).
We previously reported upregulation of Xaf1 transcripts in the brains of uninfected and VSV-infected Sarm1AD mice compared with wild-type (WT) mice (Hou et al., 2013). Zhu et al. (2019) described a similar phenotype in SarmMSD mice and reported that SARM1 modulates Xaf1 transcript expression and caspase-mediated cell death. X-linked inhibitor of apoptosis (XIAP)-associated factor (XAF1) is a proapoptotic interferon (IFN)-stimulated gene that is epigenetically silenced in a range of human tumors. XAF1 binds and inhibits XIAP, leading to apoptosis, and the C-terminal domain is essential for binding. However, XAF1 is also proapoptotic in Xiap−/− cells, suggesting it can induce apoptosis through multiple mechanisms. XAF1 has also been reported to bind p53, displacing MDM2 (E3 ubiquitin-protein ligase Mdm2) and leading to cell death, likely through multiple mechanisms. Several isoforms of Xaf1 have been described, including full-length and truncated forms. Full-length isoforms are frequently downregulated in human tumors, whereas truncated isoforms are upregulated. Importantly, short forms have been reported to have dominant-negative effects (Lee et al., 2014; Jeong et al., 2018).
In an attempt to define a role for SARM1 in peripheral immunity, we examined cytokine responses in Sarm1AD mouse macrophages. We found defects in the production of Ccl5 as reported (Gürtler et al., 2014), as well as in Ccl3 and Ccl4. However, the chemokine locus lies close to the Sarm1 gene on mouse chromosome 11, and was found to be of 129 embryonic stem cell (ESC) origin in the Sarm1AD mouse strain. By generating additional SARM1 knockout strains on a pure C57BL/6J (B6) background, we show that defects in chemokine production in macrophages and in the brain during infection result from background mouse strain effects, not from lack of SARM1 expression. We also find no role for SARM1 in susceptibility to VSV or LACV infection or in Xaf1 expression; however, its role in axonal degeneration and WNV infection was confirmed (Szretter et al., 2009). The data suggest a more limited role for SARM1 in immunity and viral infection than originally reported. RNA sequencing (RNA-seq) data on both strains suggests Xaf1 as a candidate locus for other phenotypes described in the original Sarm1AD strain and possible targets of SARM1 in the CRISPR strain.
RESULTS
Macrophages Derived from Sarm1AD Mice Are Defective in the Production of Ccl3, Ccl4, and Ccl5
We stimulated bone-marrow-derived macrophages with TLR ligands or infected with viruses known to activate the RLR (RIG-I-like receptor) sensing pathway and measured cytokine and chemokine production by ELISA. For this purpose, we compared WT B6 mice to SARM1-deficient mice generated in the Ding lab and backcrossed 10 times to the B6 background, here called Sarm1AD (see Table 1 for background details of the mice used in this study). We found that although TNF-α and IFN-α production were normal in Sarm1AD macrophages, CCL3 production was defective in response to all stimuli tested (Figure 1A). We next asked whether the defect in chemokine production occurred at the transcriptional level. The largest differences between WT and Sarm1AD mice were observed with LPS (lipopoly-saccharide) stimulation, so subsequent experiments were performed with this stimulus. Sarm1AD macrophages showed defects in the production of Ccl3, Ccl4, and Ccl5 mRNA in response to LPS stimulation at several time points but no defects in the production of Il1b or Ifnb1 (Figure 1B, top), similar to results reported for Ccl5 (Gürtler et al., 2014). Given that we saw defects in chemokine production in response to various TLR stimuli, we next asked whether signaling in response to TNF-α, which does not use the TLR adaptor proteins MYD88 or TRIF, was defective in Sarm1AD macrophages. Sarm1AD macrophages again showed defects in the production of Ccl3, Ccl4, and Ccl5 mRNA, but not in Il1b or Ifnb1 (Figure 1B, bottom). This suggested that the defect in chemokine production in Sarm1AD macrophages was not specific to the TLR signaling pathway.
Table 1.
Summary of Sarm1 Mouse Lines and Phenotypes
| Allele | Ref | Neo | Congenic Interval |
Genetic Background |
Axonal Degeneration |
VSV | LACV | WNV | Chemokines |
|---|---|---|---|---|---|---|---|---|---|
| Sarm1AD | Kim et al., 2007 | Y | 129 | 99.5% B6 | protected | ↓ | WT (original strain) | WT | ↓ |
| Sarm1MSD | Szretter et al., 2009 | N | 129 | 94.6% B6 | ND | ND | ↓ 1978 strain) | ↑ | ND |
| Sarm1AGS3 | this study | N | none | 100% B6 | protected | WT | WT (original strain) | ↑ | WT |
| Sarm1AGS12 | this study | N | none | 100% B6 | ND | WT | WT (original strain) | ND | WT |
ND, not done; ↓, decreased susceptibility; ↑, increased susceptibility.
Figure 1. Macrophages from Sarm1AD Mice Have a Defect in the Production of Ccl3, Ccl4, and Ccl5 but Display Normal Signaling Responses.

(A) WT and Sarm1AD macrophages were stimulated with 100 μg/mL of poly(I:C), 5 μg/mL of LPS, 0.01 μg/mL of R848, 10 μg/mL of CL075, or Newcastle disease virus (NDV) or VSV at an MOI of 5 for 24 h. Cytokine production was measured by ELISA.
(B) WT and Sarm1AD macrophages were stimulated with 1 mg/mL of LPS or TNF-α. Cytokine production was measured by qPCR at the indicated time points. Graphs show mean ± SD for triplicate biological replicates and are representative of 3 experiments. *p < 0.05 and **p < 0.01 (unpaired t test).
(C–E) WT and Sarm1−/− macrophages were stimulated with 10 ng/mL of LPS (C and E), or TNF-α (D) for the indicated number of minutes. Signaling responses were measured by western blot.
(F) WT and Sarm1−/− macrophages were stimulated with 100 ng/mL of LPS or 1 mM ATP. Calcium flux was measured by fura-2-acetoxymethyl ester (fura-2 AM) fluorescence. Data are representative of 3 experiments.
Macrophages Derived from Sarm1AD Mice Show Normal Signaling Responses
We saw defects in the production of chemokines in Sarm1AD macrophages in response to both LPS and TNF-α stimulation, suggesting that SARM1 does not function at the level of the TLR-adaptor proteins MYD88 or TRIF. However, both LPS and TNF-α signaling activate the NF-κB and MAPK signaling pathways (Hayden and Ghosh, 2014; Brubaker et al., 2015). We therefore examined activation of these pathways in Sarm1AD macrophages by western blot. No differences were observed in the degradation of IκBα or the phosphorylation of JNK, ERK, or p38 in response to either LPS or TNF-α stimulation, suggesting that SARM1 does not regulate induction of the NF-κB or MAPK pathways (Figures 1C and 1D). LPS also activates phosphatidylinositol 3-kinase (PI3K) signaling, resulting in phosphorylation of Akt (p-Akt) (Laird et al., 2009); however, no differences in p-Akt levels were observed in Sarm1AD macrophages in response to LPS (Figure 1E). In addition, PLCγ-2 (Phospholipase C Gamma 2) and intracellular calcium are required for TLR4 endocytosis in response to LPS (Chiang et al., 2012). However, we again saw no differences in intracellular Ca2+ flux in Sarm1AD macrophages in response to LPS or ATP stimulation (Figure 1F).
The MIP and MCP Chemokine Family Loci Are within the Sarm1 129 Congenic Locus
Given that we saw defects in Ccl3, Ccl4, and Ccl5 production but not in other cytokines, that the defects occurred in response to various stimuli, and that no defects in the induction pathways for these cytokines could be found, we considered the possibility that the observed defect resulted from the genetic background of the knockout mouse, rather than lack of SARM1 expression. The Sarm1AD strain was made by replacing exons 3–6 with a neomycin resistance gene in reverse orientation in 129 ESCs, before backcrossing 10 times to the B6 background (Kim et al., 2007). The Ccl3, Ccl4, and Ccl5 genes and the Sarm1 gene are both located on mouse chromosome 11 and are separated by only ~5 Mb (Figure 2A). Despite backcrossing 10 times, the probability of a region of 5 cM (~6.75 Mb for chromosome 11; The Jackson Laboratory, 2017) of 129 genetic material flanking both sides of the knockout gene is 0.63, making it likely that the chemokine locus in Sarm1AD mice is of 129 origin. To check the genetic background of genes proximal to Sarm1, we sequenced two SNPs in the Ccl5 gene that differ between the 129 and the B6 strains, which confirmed that the Ccl5 locus of the Sarm1AD strain is derived from the 129 strain (Figure 2B).
Figure 2. Ccl3, Ccl4, Ccl5, and Xaf1 Are within the Sarm1AD 129 Congenic Locus.

(A) Chromosomal location of the Sarm1 gene, chemokine locus, and Xaf1 gene (UCSC genome browser).
(B) Sequence analysis of SNPs in the Ccl5 gene of WT and Sarm1AD mice.
(C) WT and Sarm1AD macrophages were stimulated with 10 ng/mL of LPS for 3 h. Cytokine production was measured by qPCR.
(D) WT, Sarm1+/AD, and Sarm1AD/AD macrophages were stimulated as in (C) (the bottom graph shows the same data as the top graph on a different scale).
(C) and (D) show mean ± SD for triplicate biological replicates and are representative of 3 experiments. *p < 0.05 and **p < 0.01 (unpaired t test); ns, not significant.
We next asked whether the production of other cytokines and chemokines located on different chromosomes was different between WT and Sarm1AD macrophages. We again saw differences in the production of Ccl3, Ccl4, and Ccl5 mRNA, but we failed to find significant differences between other cytokines or chemokines in different chromosomal locations (Figure 2C). The MCP (monocyte chemoattractant protein) chemokine region falls between the Sarm1 gene and the MIP (macrophage inflammatory protein) chemokine region and is therefore of 129 genetic origin; however, no differences in the induction of Ccl1, Ccl2, or Ccl7 were observed. In some experiments, we saw increased production of Il12b in the Sarm1AD strain (also located on chromosome 11); however, this difference was not highly reproducible. An intermediate phenotype between WT and Sarm1AD was observed for heterozygous mice (Sarm1+/AD; Figure 2D).
SARM1 Knockdown and Overexpression Fail to Regulate Ccl3, Ccl4, and Ccl5 Levels
We next examined the role of SARM1 expression on chemokine production in a cell line, lacking the confounding genetic background of the Sarm1AD mouse strain. We first examined Sarm1 expression in the mouse macrophage cell line RAW264.7 expressing a control V5 epitope tag (RAW-V5). We found very low levels of Sarm1 mRNA expression, making knockdown efficiency difficult to access (Figure 3A, left). This is in agreement with reports suggesting very low or no expression in mouse macrophages (Kim et al., 2007; Szretter et al., 2009). Upon treatment with LPS, no differences in Ccl4 induction were found with knockdown (Figure 3A, right). To determine knockdown efficiency, we repeated the experiment in RAW264.7 cells overexpressing V5-tagged SARM1 (RAW-SARM1-V5). Under these conditions, Sarm1 mRNA was detectable, and siSARM1-1 and siSARM1-3 reduced transcript expression by 10× and 7x×, respectively, confirming knockdown (Figure 3B, left). Transcript knockdown efficiency varied from 2× to 10× in repeat experiments (Figure S1B). Western blot for Sarm1-V5 expression revealed siSARM1-1 and siSARM1-3 reduced protein levels by 40% and 30%, respectively (Figures 3C and S1A). The low knockdown efficiency likely results from high SARM1 expression from the CMV (cytomegalovirus) promoter; nonetheless, it confirms the efficacy of the small interfering RNAs (siRNAs). Again, upon LPS stimulation, no differences in Ccl4 mRNA induction were detectable in RAW-SARM1-V5 cells (Figure 3B, right). We next performed knockdown in macrophages from WT and Sarm1AD mice. We were unable to detect Sarm1 mRNA expression in macrophages, and no reliable antibodies are available (Kim et al., 2007; Szretter et al., 2009; Gürtler et al., 2014; Hou et al., 2013), so we could not access knockdown efficiency. We again found that basal levels of Ccl4 mRNA were reduced in Sarm1AD macrophages compared with WT macrophages, however siRNA treatment of WT macrophages failed to downregulate Ccl4 levels (Figure 3D). Lastly, we determined whether overexpression of SARM1 in RAW cells modulated chemokine induction in response to LPS. As shown in Figure 3E, no differences in chemokine levels were observed upon overexpression of SARM1. The limited chemokine defects, lack of signaling defects, and lack of support from knockdown or overexpression, as well as the proximity of the Ccl3, Ccl4, and Ccl5 genes to the Sarm1 gene, make it likely that the congenic interval, rather than SARM1 protein expression, contributes to differences in basal and induced levels of Ccl3, Ccl4, and Ccl5 between WT and Sarm1AD mice.
Figure 3. SARM1 Knockdown and Overexpression Do Not Modulate Chemokine Production.
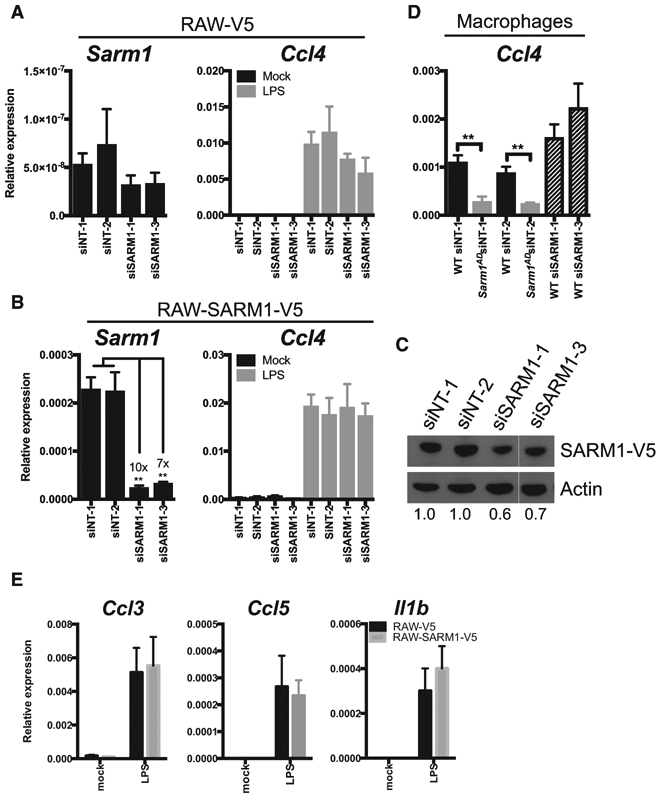
(A) RAW-V5 cells were treated with Sarm1 siRNAs. Sarm1 knockdown efficiency was measured by qPCR (left), or Ccl4 expression was measured after treatment with 10 ng/mL of LPS for 3 h (right).
(B) RAW-SARM1-V5 cells treated as in (A).
(C) Western blot of SARM1 expression in RAW-SARM1-V5 cells treated with Sarm1 siRNAs.
(D) Ccl4 expression by qPCR after treatment with 10 ng/mL of LPS for 3 h in WT and Sarm1AD macrophages after Sarm1 siRNA knockdown.
(E) RAW-V5 and RAW-SARM1-V5 cells were treated with 10 ng/mL of LPS. Cytokine production was measured at 3 h by qPCR.
Graphs show mean ± SD of triplicate biological samples and are representative of 3 experiments. **p < 0.01 (unpaired t test). See full gel image in Figure S1.
Sarm1 CRISPR Knockout Mice on a Pure B6 Background Show No Macrophage Chemokine Defects
To formally exclude a role for SARM1 in chemokine induction, we generated knockout mouse strains using CRISPR-mediated genome engineering on a pure B6 background. A high-scoring guide sequence that was unlikely to produce off-target cleavage was located in exon 1 of the Sarm1 gene (Ran et al., 2013). This guide sequence was cloned into the pSpCas9(BB)-2A-GFP vector and injected into one-cell-stage B6 embryos. Resulting pups were characterized at the Sarm1 locus, as well as at potential off-target sites. Two knockout alleles were generated using this approach, termed Sarm1AGS3 and Sarm1AGS12. The Sarm1AGS3 allele is a 62 bp deletion resulting in a frameshift and a 38 aa product; the Sarm1AGS12 allele is a 13 bp deletion resulting in a frameshift and a 74 aa product (Figure S2A; Table S1). The 62 bp deletion from the Sarm1AGS3 allele was evident by PCR of Sarm1 genomic DNA (Figure S2B, left). The 13 bp deletion from the Sarm1AGS12 allele was too small to be detected on an agarose gel but was detected using the Surveyor nuclease assay (Figure S2B, right). The guide sequence used for Sarm1 cleavage was high scoring, and no potential off-target sites were present with less than 4 mismatches, making CRISPR cleavage at off-target sites unlikely (Cho et al., 2014). Nonetheless, we tested 5 potential off-target sites located in exonic regions that could potentially affect these genes. We did not detect cleavage events at any of these sites, as determined by the Surveyor nuclease assay (Figure S2C).
The Sarm1AGS3 and Sarm1AGS12 lines were breed to homozygosity, creating two Sarm1 knockout strains. We compared responses of macrophages derived from WT, the original Sarm1AD line, and the Sarm1AGS3 line. As expected, the Sarm1AD macrophages showed defects in the production of Ccl3, Ccl4, and Ccl5 mRNA in response to LPS (Figure 4A, top) or TNF-α (Figure 4A, bottom). However, the Sarm1AGS3 line showed responses comparable to WT. The Sarm1AGS12 line also showed Ccl3, Ccl4, and Ccl5 responses comparable to WT in response to TNF-α (Figure 4B). This shows that defects in the production of chemokines in the original Sarm1AD macrophages resulted from background effects, not SARM1 protein expression.
Figure 4. Sarm1 CRISPR Knockout Mice on a Pure B6 Background Show Normal Chemokine Production but Are Protected from Axonal Degeneration.

(A) WT, Sarm1AD, and Sarm1AGS3 macrophages were stimulated with 10 ng/mL of LPS or TNF-α. Cytokine production was measured at the indicated time points by qPCR.
(B) WT, Sarm1AD, Sarm1AGS3, and Sarm1AGS12 macrophages were stimulated with 10 ng/mL of TNF-α as in (A).
(C) Toluidine blue staining of sciatic nerves from untransected (left) and transected (right) WT and Sarm1AGS3 mice 14 days post-transection. Scale bar, 10 μm. Graphs show mean ± SD of triplicate biological samples and are representative of 3 experiments. *p < 0.05 (unpaired t test) is significant for the indicated bar compared with Sarm1AD at the same time point. See also Figure S2 and Table S1.
Sarm1 CRISPR Knockout Mice Are Protected from Axonal Degeneration
We have been unable to detect the expression of a SARM1-specific band by western blot using several commercial antibodies and western blotting conditions (data not shown). We therefore sought to confirm knockout of SARM1 protein expression functionally in an axonal degeneration assay. For this purpose, we performed sciatic nerve transections of the right hindlimb in WT and Sarm1AGS3 mice. 14 days following transection, WT mice showed breakdown of the axon and myelin sheath, whereas Sarm1AGS3 mice showed remarkable protection (Figure 4C), as described previously in the Sarm1AD strain (Osterloh et al., 2012). This confirms a role for SARM1 in axonal degeneration and functional knockout of SARM1 in the Sarm1AGS3 line.
Viral Phenotypes of Sarm1 CRISPR Mice
We had previously reported that Sarm1AD mice are resistant to lethal encephalitic disease caused by VSV infection (Hou et al., 2013). To determine whether this was a true function of SARM1, we infected Sarm1AGS3 and Sarm1AGS12 mice with VSV and monitored survival. As shown in Figure 5A, Sarm1AD mice, but not Sarm1AGS3 or Sarm1AGS12 mice, were protected from VSV, suggesting that SARM1 does not play a role in VSV infection. Our reported defects in cytokine and chemokine production in the brain of VSV-infected mice also resulted from background effects, not SARM1 protein (Figure 5B). An independent line of SARM1-deficient mice (Sarm1MSD) was generated in the Diamond lab on the 129 background but lacking the neomycin cassette. These mice showed increased susceptibility to WNV-NY99 infection (Szretter et al., 2009). When Sarm1AGS3 mice were infected with WNV-NY99, they were more susceptible than WT mice (Figure 5C), confirming a role for SARM1 in WNV infection, in agreement with the Szretter et al. (2009) study. Surprisingly, Sarm1AD mice showed similar susceptibility to WT mice to WNV infection (Figure 5C; Table 1), suggesting that background effects in Sarm1AD mice may have compensated for the impact of SARM1 deficiency on susceptibility to WNV infection. Sarm1MSD mice were also reported to be protected from LACV infection (Mukherjee et al., 2013). When Sarm1AD, Sarm1AGS3, and Sarm1AGS12 mice were infected with LACV, all strains showed similar susceptibility to WT mice, suggesting that SARM1 also does not play a role in susceptibility to LACV infection (Figure 5D).
Figure 5. Viral Phenotypes of Sarm1 CRISPR Knockout Mice.
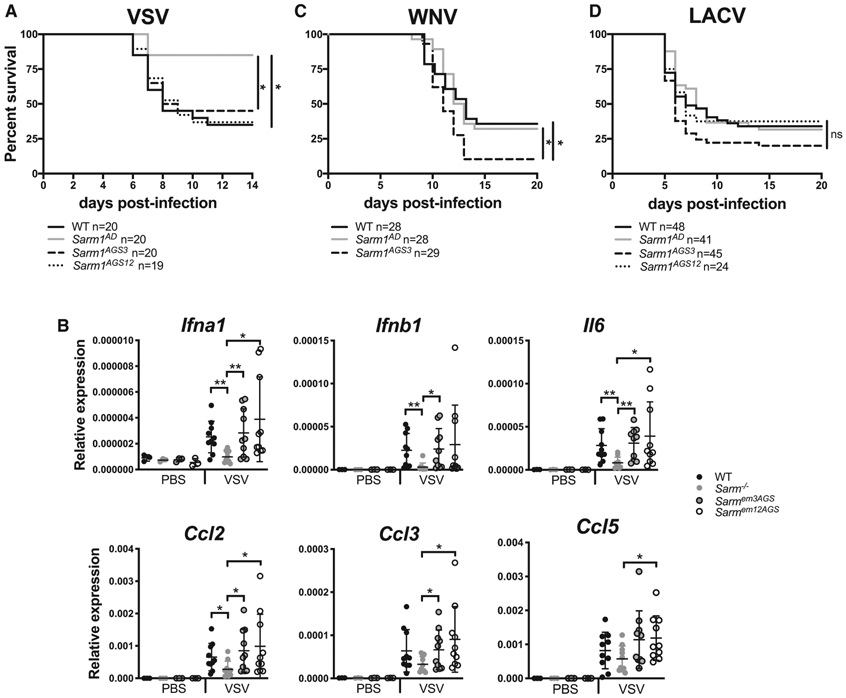
(A) WT, Sarm1AD, Sarm1AGS3, and Sarm1AGS12 mice were infected intranasally with 107 plaque-forming units (PFUs) of VSV, and survival was measured.
(B) Mice were infected as in (C). Chemokine production in the brain was measured by qPCR at day 6 post-infection.
(C) WT, Sarm1AD, and Sarm1AGS3 mice were infected with 102 ffu of WNV-NY99 via footpad injection, and survival was measured.
(D) WT, Sarm1AD, Sarm1AGS3, and Sarm1AGS12 mice were infected intraperitoneally with 103 PFUs of the original LACV strain, and survival was measured.
(A), (C), and (D) show combined results of 2 experiments with similar results; (B) shows mean ± SD for n = 3 (PBS) and n = 10 (VSV) and is representative of 3 experiments. *p < 0.05, log rank test (A, C, and D) and unpaired t test (B). See also Table S2.
The Sarm1AD mice used in this study were backcrossed 10 times to the B6 background; Sarm1MSD mice were reported to be backcrossed to the B6 background, but the extent of backcrossing was not reported. To determine the precise backgrounds of the two strains, we performed a 384 panel SNP analysis. The Sarm1AD mice were 99.5% B6, whereas the Sarm1MSD mice were 94.6% B6. The Sarm1AD mice were found to differ from B6 at the expected location on chromosome 11 and one other region on chromosome 10. The Sarm1MSD mice were found to differ from B6 at multiple locations, including large portions of chromosomes 10 and 11 (Table S2), which may account for the different phenotypes observed with the two strains. The precise genetic background of the strains used in different labs and studies will likely differ depending on the extent of backcrossing done in individual labs.
Xaf1 Expression Differences Result from Sequence and Isoform Polymorphism between B6 and 129
Significant differences in transcript levels of Xaf1, a proapoptotic protein, were reported by us in the original Sarm1AD strain in both the presence and the absence of VSV infection, as well as by others (Zhu et al., 2019) in the Sarm1MSD strain in both the presence and the absence of prion infection. In addition, Xaf1 was the most highly upregulated transcript in SARM1-deficient mice compared to WT mice in both studies. Two curated protein-coding transcripts for Xaf1 have been described in mouse (Figure 6A), as well as several predicted transcripts. Isoform 1 contains exons 1–6, and isoform 2 contains exons 1, 2, 5, and 6. The Xaf1 gene is also located close to the Sarm1 gene on chromosome 11 (Figure 2A). Alignment of RNA-seq reads from the Sarm1AD strain to the B6 reference genome showed several nucleotide differences (Figure 6B, indicated by colored lines), and the Sarm1AD consensus sequence matched the reported sequence for 129. The nucleotide differences in exons 4 and 5 result in 4 amino acid substitutions (Figure 6E). The 129 sequence has a gap in the alignment at the 3′ end of exon 6, which is the result of a 248 bp deletion, and a large peak in the 3′ UTR that is not present in B6. The deletion spans the B6 stop codon and 2 polyadenylation sites, which likely results in a transcript that terminates later in 129, potentially effecting transcript stability. The 129 transcript uses an alternative stop codon located after the deletion, resulting in truncation of the last 3 amino acids at the C terminus of the protein (Figure 6E).
Figure 6. Xaf1 Sequence and Isoform Polymorphism.

(A) Xaf1 gene and transcripts.
(B) WT and Sarm1AD mice were infected with 107 PFUs of VSV, and brain samples were collected for RNA-seq at day 5 post-infection. Plots show coverage alignment of WT and Sarm1AD sample reads to the B6 reference genome (mm10) at the Xaf1 locus. Colors indicate nucleotide changes from the reference sequence.
(C) Sashimi plots (IGV) of the samples in (B) showing exon-exon splice junctions.
(D) RT-PCR of Xaf1 transcripts from samples in (B). The asterisk indicates that the ~600 bp band corresponds to different transcripts in WT and Sarm1AD samples.
(E) Protein coding differences between WT (B6) and Sarm1AD (129) Xaf1 transcripts.
(F) WT, Sarm1AD, and Sarm1AGS3 mice were injected i.v. with 100 μg of poly(I:C), and splenocytes were isolated at 24 h for XAF1 western blot. *, XAF1 isoform 1; **, possible XAF1 novel isoform.
(G) STRING analysis of significantly differentially expressed genes from mock-infected brainstem of WT and Sarm1AGS3 mice. Lines indicate known and predicted interactions. See also Figure S3 and Tables S3 and S4.
Sashimi plots visualizing splice junctions showed an increase in junctions between exon 2 and exon 5 (10% to 48%), indicating less full-length transcript in the Sarm1AD strain, as well as a large increase in a distinct splice variant between exon 5 and exon 6 (4% to 30%) in the Sarm1AD strain (Figure 6C). Using RT-PCR primers directed against exon 1 and either the B6 or the 129 exon 6, we detected the reported sequences for transcripts 1 and 2 in B6 (Figure 6D; see Table S3 for sizes and accession numbers). In 129, we detected the reported sequence for transcript 1. The 3′ end of the 129 transcript 2 was incomplete in databases and ended in the same sequence as transcript 1, resulting in the same C-terminal truncation. In the 129 samples, we also detected two distinct isoforms corresponding to the splice site between exon 5 and exon 6, leading to a novel long isoform (600 bp) similar to transcript 1 but lacking part of exon 5 and a novel short isoform (315 bp) similar to transcript 2 but also lacking part of exon 5. We detected a band of similar size to the novel long isoform in B6 (Figure 6E, indicated by an asterisk); however, sequence analysis indicated this was a 626 bp transcript lacking exon 3 and leading to early truncation of the protein. The alternative splice site in exon 5 results in a large deletion of exon 5 (Figure 6E) but in-frame translation of exon 6. Importantly, the C-terminal domain is thought to be essential for binding to XIAP (Tse et al., 2012), and short isoforms are thought to function as dominant negatives (Lee et al., 2014; Jeong et al., 2018). Overall, the data suggest that transcriptional changes are the result of background strain variation.
To test XAF1 antibodies, we generated XAF1-deficient 3T3 cell lines using CRISPR. Despite the presence of non-specific bands, using one of these antibodies, we could detect XAF1 expression specifically in WT cells, but not Xaf1−/− cells (Figure S3A). This band was only present following IFN treatment, in agreement with Xaf1 being an IFN-stimulated gene. Importantly, the antibody epitope is present in all isoforms. Following treatment of mice with intravenous (i.v.) poly(I:C) to induce IFN, we were unable to detect XAF1 expression in the brain, but we did observe expression in response to poly(I:C) treatment in the spleen. We observed a band corresponding to the size of the full-length protein in WT, Sarm1AD , and Sarm1AGS3 mice. However, we also observed a unique band in the Sarm1AD strain following poly(I:C) treatment, which may represent either increased expression of isoform 2 or one of the novel isoforms (Figure 6F). No differences in Xaf1 expression levels were observed between WT and Sarm1AGS3 by RNA-seq (Table S4), suggesting that SARM1 likely does not control XAF1 expression. To determine whether XAF1 induces cytokine production, we transfected Neuro2A cells with the 2 B6 and the 4 129 isoforms and examined cytokine/chemokine expression. We observed no significant induction of Ccl3, Ccl4, Ccl5, Il1b, or Il6 (Figure S3B), suggesting that chemokine differences in Sarm1AD mice were not mediated by XAF1. Given the differential expression of XAF1 in the Sarm1AD strain, and its known role in cell death, we speculate that XAF1 may account for some phenotypes described in this strain.
RNA-Seq on Sarm1 CRISPR Mice
To understand possible functions for SARM1 during WNV infection, we performed transcriptome analysis on brainstem isolated from mock and WNV-infected WT and Sarm1AGS3 mice. Our survival studies (Figure 5C) were performed with the WNV-NY99 strain, a human strain that is subcutaneously injected to model mosquito infection. The time to death is highly variable and often sudden in this model, which is likely a reflection of variation in local tissue and blood replication, entry into the CNS, and replication in different brain regions. To minimize this variation for transcriptome analysis, we intracranially injected an attenuated WNV Kunjin strain (WNV-KUN). We only observed 9 differentially regulated transcripts between WT and Sarm1AGS3 mice, which did not fall into a clear pathway. This may reflect that WNV-KUN is uniformly lethal in both WT and Sarm1AGS3 mice. These results are similar to reported results with intracranial injection of the WNV Madagascar strain (WNV-MAD), another attenuated infection model in which Sarm1MSD mice were more susceptible to subcutaneous WNV-NY99 infection but intracranial WNV-MAD infection was uniformly lethal (Szretter et al., 2009). In mock-infected animals, 16 transcripts were differentially regulated, 4 of which are involved in the mitochondrial electron transport chain — Ndufa3 and Ndufb3 (complex I), Uqcrh (complex III), and Atp5k (complex V)—as well as several small and large ribosomal proteins and an apoptosis-associated tyrosine kinase (Figure 6D; Table S4). This is in agreement with a recent report suggesting a role for SARM1 in mitochondrial respiration (Murata et al., 2018).
DISCUSSION
Current evidence supports a role for SARM1 in axonal degeneration (Osterloh et al., 2012; Gerdts et al., 2013). Roles for SARM1 in immunity have also been reported for CNS viral infections (Szretter et al., 2009; Hou et al., 2013; Mukherjee et al., 2013), but not for pathogens that replicate outside of the CNS, including M. tuberculosis, L. monocytogenes, or influenza virus (Hou et al., 2013). Whether SARM1 plays a role outside of neural cells has proved difficult to answer. Studies on the expression and function of SARM1 have been hampered by the lack of reliable antibodies, making it difficult to gauge whether cells of the immune system express detectable protein levels. At the RNA level, evidence suggests predominant expression of SARM1 in the CNS. However, it remains possible that cells in the periphery express SARM1. We and others (Szretter et al., 2009) did not detect the expression of SARM1 at the RNA level in macrophages, using primers that span exons 7 and 8, and detect high expression in WT but not Sarm1AD brain. However, others report expression of a shorter 724 aa isoform in T cells and macrophages using primers spanning exons 5–7 (Panneerselvam et al., 2013; Gürtler et al., 2014). Our primers should detect both isoforms, so the reason for the discrepancy is unclear.
In this study, we sought to address whether SARM1 plays a role in macrophages using cells from Sarm1AD mice. Similar to published reports (Gürtler et al., 2014), we found differences in the production of Ccl5, as well as Ccl3 and Ccl4 in Sarm1AD macrophages. However, several lines of evidence support that this results not from SARM1 protein expression but rather from background effects of the knockout strain. First, the defect in Sarm1AD macrophages is limited to 3 particular chemokine genes that are located physically close to one another and the modified locus. Second, the defect is evident in response to an array of stimuli that induce different signaling pathways. Third, we could find no defects in the signaling components that are shared between the induction pathways for these stimuli. Fourth, siRNA knockdown failed to reproduce the Sarm1AD chemokine phenotype, suggesting a lack of dependence on SARM1 protein expression. Overexpression of SARM1 has been reported to modestly induce Ccl5 expression (Gürtler et al., 2014); however, we were unable to reproduce these findings. These experiments were performed using stable retroviral expression in immortalized bone-marrow-derived macrophages or NIH 3T3 cells, whereas our experiments were performed using stable lentiviral expression in RAW cells, which may account for differing results. In addition, we found differences in baseline expression of Ccl3, Ccl4, and Ccl5 in unstimulated macrophages from Sarm1AD mice, supporting an intrinsic difference. Finally, generation of knockout strains on a pure genetic background failed to support a role for SARM1 in macrophage chemokine production. These data, in combination with the lack of expression/low expression of SARM1 in macrophages, fail to support a role for SARM1 as a TLR adaptor protein in myeloid cells.
Here we show background strain-dependent differences in the expression of the proapoptotic protein XAF1, which may represent a good candidate gene for the protective effect described in the knockout strains; however, several other possibilities are consistent with the data. The protective phenotype could result from (1) differences in chemokine levels because of the 129 congenic locus, which can also influence immune cell infiltration; (2) transcriptional interference from neomycin effecting chemokines or other neighboring genes within the congenic interval; (3) other mutations within the congenic interval; or (4) other background effects. We had originally reported that Sarm1AD mice had lower levels of monocyte and macrophage infiltration into the brain, in agreement with their lower cytokine/chemokine levels, and postulated that this may lead to protection from immune-mediated tissue damage (Hou et al., 2013). Neomycin has been documented to abrogate downstream gene expression and interfere with locus control regions at both short and megabase distances (Olson et al., 1996; Pham et al., 1996; Meier et al., 2010), which would be consistent with lower recruitment of RNA Pol II to the Ccl5 promoter in Sarm1AD mice (Gürtler et al., 2014). In addition, the importance of genetic background on the phenotype of knockout mice is well known, and examples of interfering passenger mutations abound in the literature (Vanden Berghe et al., 2015).
Various protective and detrimental effects have been reported in different infection models in SARM1-deficient strains. These results are difficult to reconcile given the varying construction of the knockout strains and the significant variation in genetic background. In addition, studies have not reported SNP analysis and whether additional backcrossing was done. SARM1 was reported to have a negative effect on susceptibility to both VSV and LACV infection, whereas it was reported to have a positive effect on susceptibility to WNV infection. We reported that Sarm1AD mice were less susceptible to VSV and showed lower cytokine responses and infiltration in the brain, whereas Mukherjee et al. (2013) reported that Sarm1MSD mice were protected from LACV infection in a mechanism dependent on SARM1 interaction with MAVS (mitochondrial antiviral-signaling protein). Our CRISPR knockout strains did not support a role for SARM1 in mediating this effect in either infection model. Surprisingly, none of our knockout lines, including Sarm1AD, Sarm1AGS3, and Sarm1AGS12, showed a protective effect during LACV infection, suggesting that the phenotype is specific to either the Sarm1MSD strain or the viral strain. We found the Sarm1MSD strain differed from B6 at large portions of chromosomes 10 and 11 in our analysis, which could account for the discrepant results. In addition, the original LACV strain was used in our study, whereas Mukherjee et al. (2013) used the LACV 1978 strain. These strains share 99% amino acid identity and are both highly virulent in young mice (Bennett et al., 2007; Huang et al., 1997); however, differences in pathogenesis are observed in some strains (Gonzalez-Scarano et al., 1988). Our CRISPR knockout strains supported a role for SARM1 in mediating the positive effect during WNV infection. Surprisingly, the Sarm1AD line showed similar susceptibility to WT mice during WNV infection. Both the Sarm1AD and the Sarm1MSD lines were made on the 129 background; however, the Sarm1AD line retains neomycin. Similar phenotypes in Sarm1AGS3, Sarm1AGS12, and Sarm1MSD mice suggest that either neomycin effects on neighboring genes or other 129 background effects account for the different phenotype of the Sarm1AD strain to WNV.
This example and others highlight the advantages of generating knockout strains using CRISPR technology. RNA-seq in our CRISPR strains suggests loss of SARM1 expression leads to changes in expression of ribosomal and mitochondrial electron transport chain genes. This is in agreement with a recent study showing that SARM1 phosphorylation regulates NAD+ cleavage, leading to inhibition of mitochondrial respiration (Murata et al., 2018). Overall, the data suggest that reevaluation of phenotypes described in SARM1-deficient strains will be important for understanding the function of SARM1 in different contexts.
STAR★METHODS
RESOURCE AVAILABILITY
Lead Contact
Further information and requests for resources and reagents should be directed to and will be fulfilled by the Lead Contact, Adolfo García-Sastre (Adolfo.Garcia-Sastre@mssm.edu).
Materials Availability
The Sarm1AGS3 strain has been deposited at Jackson Labs under strain name C57BL/6J-Sarm1 < em1Agsa > /J, stock number 034399. The Sarm1AGS3 and Sarm1ADS12 strains, and RAW and 3T3 cell lines are also available via request to the Lead Contact.
Data and Code Availability
The accession numbers for the RNaseq datasets reported in this paper are GEO: GSE136221 and GEO: GSE136284, and for the Xaf1 transcripts are GenBank: MN366017-366019.
EXPERIMENTAL MODEL AND SUBJECT DETAILS
Mice
Sarm1AD mice on the C57BL/6J background were generated previously from 129 ES cells (Kim et al., 2007) and backcrossed to C57BL/6J 10 generations. Mice were compared to WT C57BL/6J mice purchased from Jackson. Animal studies were approved by the Institutional Animal Care and Use Committee of Icahn School of Medicine at Mount Sinai. Mice were housed in a barrier facility at the Icahn School of Medicine at Mount Sinai under specific pathogen free conditions in individually ventilated cages and feed irradiated food and filtered water. For in vitro experiments, 6-8 week old age and sex-matched mice were used. Both male and female cells were used without obvious sex differences. Viral infections were as follows: VSV infections 6-8 week old females, WNV 8-9 week old females, LACV 3 week old males and females (matched numbers in each group). Transections were performed on 12 week old female mice.
Cell lines
RAW 264.7 cell lines (ATCC, male) and NIH/3T3 (ATCC, male)generated as described below were grown in DMEM (Corning) containing 10% FBS (Hyclone), Penicillin, Streptomycin, L-glutamine. Cells were grown at 37°C in 5% CO2.
Primary cell cultures
Bone marrow was obtained from femurs and tibias of mice, RBCs were lysed and cells were cultured for 7 days in RPMI 1640 (GIBCO) containing 10% FBS (Hyclone), Penicillin, Streptomycin, L-glutamine, HEPES (Cellgro), β-ME, and 10 ng/ml rmM-CSF (R&D Systems). Macrophages were removed from the plate following incubation with cold PBS and plated in 24-well plates at 0.25×10⁶/well. Cells were grown at 37°C in 5% CO2.
METHOD DETAILS
CRISPR knockout mice
CRISPR knockout mice were generated using the CRISPR design tool (genome-engineering.org) to select the guide sequence TCGCGAAGTGTCGCCCGGAGTGG in exon 1 of the Sarm1 gene. This was cloned into the BbsI site of pSpCas9(BB)-2A-GFP (Addgene) as described (Ran et al., 2013). The resulting plasmid was injected at 1 ng/ul into the male pronuclei of one-cell stage C57BL/6J mouse embryos. After injection, the embryos were returned to the oviducts of pseudopregnant Swiss-Webster (SW) females that had been mated the day before with vasectomized SW males. Resulting pups were characterized using a combination of PCR, sequencing, and surveyor analysis. Sarm1AGS3 were genotyped by PCR using the primers listed in Table S5 and the PCR conditions 95° 30 s, 53° 30 s, 72° 1 min. Sarm1AGS12 were genotyped by PCR using the primers listed in Table S5 and cycling conditions 95° 30 s, 63.5° 30 s, 72° 1 min, and sequencing using the forward primer. Surveyor assay was performed using Sarm1AG3S PCR conditions and Surveyor Mutation Detection Kit (IDT) followed by electrophoresis on Novex 20% TBE gels (Invitrogen). Off- target CRISPR cleavage was accessed by PCR amplification using the primers listed in Table S5 and cycling conditions 95° 30 s, 60° 30 s, 72° 1 min and the Surveyor Mutation Detection Kit (IDT) on a pup from a cross of the Sarm1AGS3 founder mouse to WT.
SNP analysis
To determine the precise genetic background of Sarm1AD and Sarm1MSD mice, 384 SNP panel analysis was performed by Charles River Genetic Testing Services. Testing was performed on tail DNA from Sarm1AD mice maintained in our colony and MEF DNA derived from the Sarm1MSD line (provided by Michael Diamond) because the Diamond lab no longer maintains the animal colony. Ccl5 SNPs were genotyped by PCR of genomic DNA from C57BL/6J or Sarm1AD mice using primers listed in Table S5 and cycling conditions 95° 30 s, 60° 30 s, 72° 1 min, followed by cloning into pGEM-T (Promega) and sequencing.
Macrophages and 3T3 cell lines
Cells were stimulated the day following plating with Poly(I:C) HMW (Invivogen), E.coli 0111:B4 LPS purified by gel filtration (Sigma), R848 (Invivogen), CL075 (Invivogen), NDV-GFP (Park et al., 2003), or VSV Indiana strain at concentrations listed in figure legends. 3T3 Xaf1−/− cells were generated by cloning the guide sequences AGCTTCCTGCAGTGCTTCTGTGG and AGGCTGACTTCCAAGTGTG CAGG located in exon 1 of Xaf1 into pSpCas9n(BB)-2A-GFP, and transfecting into 3T3 cells using LTX (Invitrogen). Single cell clones were obtained by limiting dilution and screened by PCR using the primers listed in Table S5 and the PCR conditions 95° 30 s, 60.2° 30 s, 72° 30 s, Surveyor assay (as above), and western blot.
qRT-PCR
Total RNA was extracted from macrophage cultures using EZNA total RNA kit and RNase-free DNase (Omega). RNA was reverse-transcribed using Maxima Reverse Transcriptase and oligo-dT (Thermo). Quantitative RT-PCR was performed on cDNA using Light-Cycler 480 SYBR Green I Master Mix (Roche) and the primers listed in Table S5 on a LightCycler 480 II. Data is shown as relative expression (2−ΔΔCt relative to 18S).
ELISAs
CCL3 ELISA was performed using the mouse CCL3/MIP-1α DuoSet (R&D Systems), TNF-α ELISA was performed using the mouse TNF ELISA kit (BD OptEIA), and IFN-α ELISA was performed using the Verikine Mouse IFN Alpha ELISA Kit (PBL Assay Science) according to the manufacturer’s instructions.
Western blots
For macrophage blots, 0.5×10⁶ macrophages were plated in 12-well plates. The following day cells were serum starved for 3 hr, stimulated with 10 ng/ml LPS or TNF-α for the indicated amount of time, lysed in RIPA buffer containing Halt Protease and Phosphatase Inhibitor Cocktail (Thermo), denatured in Laemmli buffer, run on 4%–12% Bis-Tris gels (Invitrogen), and transferred to PVDF membranes. For Xaf1 blots 8x10³ 3T3 cells were treated for 24 hr with 2000 U universal type I IFN (PBL) and lysed in Laemmli buffer. Mice were injected with 100 ug of HMW Poly(I:C) in 200 uL of PBS, spleens were harvested at 24 hr. and homogenized in RIPA containing cOmplete Protease Inhibitor Cocktail (Roche), denatured in Laemmli buffer, run on 4%–12% Mini-Protean gels (BioRad), and rapid transferred to PVDF membranes. Membranes were blocked with 0.2% I-BLOCK (Applied Biosystems) 0.1% Tween-20 in TBS and probed with rabbit IκBα (Cell Signaling 9242), rabbit phosphor-SAPK/JNK (Thr183/Tyr185) (Cell Signaling 9251), rabbit phosphor-p44/42 MAPK (Erk1/2) (Thr202/Tyr204) (Cell Signaling 4370), rabbit phosphor-p38 MAPK (Thr180/Tyr182) (Cell Signaling 9211), and mouse phosphor-Akt (Ser 473) (587F11) (Cell Signaling 4051), and rabbit Xaf1 (aa166-194, LS Bio LS-C158287), followed by detection with ECL donkey anti-rabbit IgG HRP or ECL sheep anti-mouse IgG HRP (GE Healthcare), or directly detected with rabbit β-Actin HRP (Cell Signaling 5125), or mouse V5-HRP (Serotec).
Ca2+ signaling
Macrophages were plated at 0.75x10⁵/well in 96-well black clear-bottom plates overnight. Cells were loaded with 10 μM Fura-2-AM in 0.1% BSA in Hanks buffer for 30 min, washed, and fluorescence was measured (330 nm- > 513 nm – 380 nm- > 513) on a plate reader after addition of 1 mM ATP or 0.1 ug/ml LPS.
RAW-SARM1-V5 cells, siRNA, and transfection
Full length Sarm1 with a C-terminal V5 tag or the V5 tag alone was cloned into the pLVX-IRES-Puro lentiviral vector (Clontech) and transfected into 293T cells along with gag/pol and VSV-G expression plasmids to generate lentiviral particles. These were used to infect RAW 264.7 cells, followed by puromycin selection. Expression was checked by western blot and immunofluorescence. SARM1 was knocked down using Dharmacon Accell siRNA targeting Sarm1 (target sequences: UGCUGUUGCUCGAUUCGUC and CCAAGGUGUUCAGCGACAU). 0.3x10⁵ RAW-V5 or RAW-SARM1-V5 cells were plated in 96-well plates, the following day siRNA was added at 1 μM in Accell delivery media for 72 hr, Accell delivery media was removed and DMEM containing 10% FBS was added for 3 hr. Cells were stimulated with 10 ng/ml LPS for 3 hr and qPCR was performed as above. Knockdown in primary macrophages was performed similarly on 0.5x10⁵ cells. For XAF1 overexpression, 0.5x10⁵ Neuro2A cells were plated in 24-well plates and transfected the following day with 500 ng of pCAGGs expressing each of the isoforms with a 1:2 ratio of DNA to lipofectamine 2000, and qPCR was performed as described above.
VSV, LACV, and WNV infection
6-8-week old female mice were anesthetized with ketamine/xylazine and infected intranasally with 107 pfu of VSV Indiana strain in 20 μL PBS. Mice were monitored daily for weight and sacrificed when exhibiting severe paralysis or more than 25% weight loss. For brain cytokines, mice were perfused with PBS and brains were removed and stored in RNAlater, followed by homogenization and RNA isolation with EZNA HP Total RNA kit (Omega), and qPCR as above. In BSL3 containment, 8-week old female mice were anesthetized with isoflurane and injected subcutaneously in the neck with 102 FFU of West Nile virus-NY99 in 50 ul of PBS and monitored as for VSV. 3-week old male and female mice were infected intraperitoneally with 103 pfu of LACV original (parent) strain (kindly provided by Andrew Pekosz) and sacrificed when exhibiting severe paralysis.
RNaseq
WT and Sarm1AD mice were infected intranasally with 107 pfu of VSV and brain RNA was prepared as above at day 5 post-infection. RNA quality and quantity was assessed using the Agilent Bioanalyzer and Qubit RNA Broad Range Assay kit (Thermo Fisher), respectively. Barcoded directional RNA-Sequencing libraries were prepared using the TruSeq Stranded Total RNA Sample Preparation kit (Illumina). Libraries were pooled and sequenced on the Illumina HiSeq platform in a 100 bp single-end read run format. After adaptor removal with cutadapt (Martin, 2011) and base quality trimming to remove 3′ read sequences if more than 20 bases with Q ≥ 20 were present, paired-end reads were mapped to the murine mm10 reference genome using STAR (v2.5.3a) (Dobin et al., 2013) and reference gene annotations from ENSEMBL (v75). WT and Sarm1AGS3 mice were infected intracranially with 100 FFU of WNV-Kunjin strain in 30 ul PBS or mock infected with PBS. Animals were perfused with PBS at day 5 post-infection. RNA preparation and sequencing was performed as above except that sequencing was non-directional and used a NextSeq machine with 150 bp reads. Protein-protein association networks were determined using STRING database (Szklarczyk et al., 2017).
Sciatic nerve transections
WT and Sarm1AGS3 were anesthetized with ketamine/xylazine, fur was shaved, and skin was cleaned. An incision was made in the skin and the muscle was separated to expose the sciatic nerve. A 1 mm portion of the nerve was excised, and the skin was closed with staples. Antibiotic ointment was applied to the incision and 0.05 mg/kg buprenorphine was administered immediately and at 6 hr for pain. Mice were housed for 14 days, and euthanized with 15% aqueous choral hydrate, followed by perfusion with 1% Paraformaldehyde/PBS, pH 7.2 at a flow rate of 7.5 mls/min, and immediately with 2% paraformaldehyde and 2% glutaraldehyde/PBS, pH 7.2 at the same flow rate for an additional 10 minutes. Skin was removed, and the carcass placed in immersion fixation (same as above) to be post-fixed for a minimum of one week at 4°C. The transected and non-transected nerves were removed and flat mold embedded to ensure cross-sectional orientation in EPON resin. Polymerized blocks were sectioned on a Leica UC7 Ultramicrotome using a histoknife at 0.5 um, counterstained with 1% Toluidine Blue and coverslipped. Brightfield images were acquired with an Axioimager Z2M microscope (Zeiss) with an EC Plan-Neofluar 40x/1.3 oil objective, and processed with Fiji software (NIH).
QUANTIFICATION AND STATISTICAL ANALYSIS
Graphpad Prism 7.0 was used to calculate significance using unpaired t test. Statistical details are indicated in the figure legends.
Supplementary Material
KEY RESOURCES TABLE
| REAGENT or RESOURCE | SOURCE | IDENTIFIER |
|---|---|---|
| Antibodies | ||
| IκBα | Cell Signaling | Cat#9242; RRIF:AB_331623 |
| rabbit phosphor-SAPK/JNK (Thr183/Tyr185) | Cell Signaling | Cat#9251; RRID:AB_331659 |
| rabbit phosphor-p44/42 MAPK (Erk1/2) (Thr202/Tyr204) | Cell Signaling | Cat# 4370; RRID:AB_2315112 |
| rabbit phosphor-p38 MAPK (Thr180/Tyr182) | Cell Signaling | Cat#9211; RRID:AB_331641 |
| mouse phosphor-Akt (Ser 473) (587F11) | Cell Signaling | Cat# 4051; RRID:AB_331158 |
| rabbit Xaf1 (aa166-194) | LS Bio | Cat#LS-C158287 |
| rabbit β-Actin HRP | Cell Signaling | Cat#5125; RRID:AB_1903890 |
| mouse V5-HRP | Serotec | Cat#MCA1360P |
| Bacterial and Virus Strains | ||
| NDV-GFP | Adolfo García-Sastre (Park et al., 2003) | N/A |
| VSV Indiana | Adolfo García-Sastre | N/A |
| West Nile virus-NY99 | Jean Lim | N/A |
| LACV original (parent) strain | Andrew Pekosz | N/A |
| WNV-Kunjin | Jean Lim | N/A |
| Chemicals, Peptides, and Recombinant Proteins | ||
| rmM-CSF | R&D Systems | Cat#416-ML |
| Poly(I:C) HMW | Invivogen | Cat#tlrl-pic |
| E.coli 0111:B4 LPS purified by gel filtration | Sigma | Sigma L3012 |
| R848 | Invivogen | Cat#tlrl-r848 |
| CL075 | Invivogen | Cat#tlrl-c75 |
| TNF-α | R&D Systems | Cat#410-MT-010 |
| universal type I IFN | PBL Interferon | Cat#11200-2 |
| Fura-2-AM | Invitrogen | Cat#F-1221 |
| Critical Commercial Assays | ||
| Surveyor Mutation Detection Kit | IDT | Cat#706020 |
| EZNA total RNA kit | Omega | Cat#R6834-02 |
| RNase-free DNase | Omega | Cat#E1091 |
| Maxima Reverse Transcriptase and oligo-dT | Thermo | Cat#EP0743 |
| LightCycler 480 SYBR Green I Master Mix | Roche | Cat#04887352001 |
| Verikine Mouse IFN Alpha ELISA Kit | PBL interferon | Cat#42400-1 |
| TNF ELISA kit | BD biosciences | Cat#558534 |
| mouse CCL3/MIP-1α DuoSet | R&D systems | Cat#DY450 |
| TruSeq Stranded Total RNA Sample Preparation kit | Illumina | Cat#20020596 |
| Accell siRNA targeting Sarm1(1) | Horizon | Cat#A-041633-13-0020 |
| Accell siRNA targeting Sarm1(3) | Horizon | Cat#A-041633-15-0020 |
| Deposited Data | ||
| Uninfected and WNV infected C57BL6/J and Sarm1em3AGS brainstem gene expression | This paper | GEO: GSE136221 |
| RNaseq of C57BL/6J and C57BL6/J Sarm1AD brain to determine genetic background | This paper | GEO: GSE136284 |
| 129 Xaf1 sequence variants | This paper | GenBank: MN366017-366019 |
| Experimental Models: Cell Lines | ||
| RAW-V5 | This paper | N/A |
| RAW-SARM1-V5 | This paper | N/A |
| 3T3-Xaf1−/− | This paper | N/A |
| Sarm1MSD MEFs | This paper | N/A |
| Neuro2A | This paper | N/A |
| Experimental Models: Organisms/Strains | ||
| C57BL/6J | Jackson | Cat#000664 |
| Sarm1AD | (Kim et al., 2007) | N/A |
| Sarm1AGS3 | This paper, deposited with Jackson Labs | Cat#034399 |
| Sarm1AGS12 | This paper, available upon request | N/A |
| Oligonucleotides | ||
| See Table S4 | N/A | |
| Recombinant DNA | ||
| pSpCas9(BB)-2A-GFP | (Ran et al., 2013) | Addgene#48138 |
| pSpCas9n(BB)-2A-GFP | (Ran et al., 2013) | Addgene#48140 |
| pLVX-IRES-Puro lentiviral vector | Takara | Cat#632183 |
| Software and Algorithms | ||
| cutadapt | (Martin, 2011) | https://doi.org/10.14806/ej.17.1.200 |
| STAR (v2.5.3a) | (Dobin et al., 2013) | N/A |
| STRING database | (Szklarczyk et al., 2017) | N/A |
Highlights.
Genes surrounding the C57BL/6J Sarm1 knockout locus are from the 129 mouse strain
C57BL/6J CRISPR lines have axonal degeneration and WNV phenotypes
C57BL/6J CRISPR lines have no VSV, LACV, chemokine, or Xaf1 phenotypes
Xaf1 shows sequence and isoform polymorphism between C57BL/6J and 129 backgrounds
ACKNOWLEDGMENTS
This work was partially supported by R01AI108715 to J.K.L. The mice used for this study were produced by the Mouse Genetics and Gene Targeting Center of Research Excellence (CoRE), which is supported by the Icahn School of Medicine at Mount Sinai and a Cancer Center Support Grant (1P30CA196521-01) from the National Cancer Institute/National Institutes of Health. We thank William Janssen at the Microscopy CoRE and Advanced Bioimaging Center for assistance with nerve imaging. We thank Michael Diamond and Andrew Pekosz for reagents and Zuleyma Peralta and Maryline Panis for technical assistance.
Footnotes
SUPPLEMENTAL INFORMATION
Supplemental Information can be found online at https://doi.Org/10.1016/j.celrep.2020.03.062.
DECLARATION OF INTERESTS
The authors declare no competing interests.
REFERENCES
- Akhouayri I, Turc C, Royet J, and Charroux B (2011). Toll-8/Tollo negatively regulates antimicrobial response in the Drosophila respiratory epithelium. PLoS Pathog. 7, e1002319. [DOI] [PMC free article] [PubMed] [Google Scholar]
- Bennett RS, Ton DR, Hanson CT, Murphy BR, and Whitehead SS (2007). Genome sequence analysis of La Crosse virus and in vitro and in vivo phenotypes. Virol. J 4, 41. [DOI] [PMC free article] [PubMed] [Google Scholar]
- Brubaker SW, Bonham KS, Zanoni I, and Kagan JC (2015). Innate immune pattern recognition: a cell biological perspective. Annu. Rev. Immunol 33, 257–290. [DOI] [PMC free article] [PubMed] [Google Scholar]
- Carty M, Goodbody R, Schröder M, Stack J, Moynagh PN, and Bowie AG (2006). The human adaptor SARM negatively regulates adaptor protein TRIF-dependent Toll-like receptor signaling. Nat. Immunol 7, 1074–1081. [DOI] [PubMed] [Google Scholar]
- Carty M, Kearney J, Shanahan KA, Hams E, Sugisawa R, Connolly D, Doran CG, Muñoz-Wolf N, Gürtler C, Fitzgerald KA, et al. (2019). Cell Survival and Cytokine Release after Inflammasome Activation Is Regulated by the Toll-IL-1R Protein SARM. Immunity 50, 1412–1424. [DOI] [PubMed] [Google Scholar]
- Chiang CY, Veckman V, Limmer K, and David M (2012). Phospholipase Cg-2 and intracellular calcium are required for lipopolysaccharide-induced Toll-like receptor 4 (TLR4) endocytosis and interferon regulatory factor 3 (IRF3) activation. J. Biol. Chem 287, 3704–3709. [DOI] [PMC free article] [PubMed] [Google Scholar]
- Cho SW, Kim S, Kim Y, Kweon J, Kim HS, Bae S, and Kim JS (2014). Analysis of off-target effects of CRISPR/Cas-derived RNA-guided endonucleases and nickases. Genome Res. 24, 132–141. [DOI] [PMC free article] [PubMed] [Google Scholar]
- Couillault C, Pujol N, Reboul J, Sabatier L, Guichou JF, Kohara Y, and Ewbank JJ (2004). TLR-independent control of innate immunity in Caenorhabditis elegans by the TIR domain adaptor protein TIR-1, an ortholog of human SARM. Nat. Immunol 5, 488–494. [DOI] [PubMed] [Google Scholar]
- Dobin A, Davis CA, Schlesinger F, Drenkow J, Zaleski C, Jha S, Batut P, Chaisson M, and Gingeras TR (2013). STAR: ultrafast universal RNA-seq aligner. Bioinformatics 29, 15–21. [DOI] [PMC free article] [PubMed] [Google Scholar]
- Essuman K, Summers DW, Sasaki Y, Mao X, DiAntonio A, and Milbrandt J (2017). The SARM1 Toll/Interleukin-1 Receptor Domain Possesses Intrinsic NAD+ Cleavage Activity that Promotes Pathological Axonal Degeneration. Neuron 93,1334–1343. [DOI] [PMC free article] [PubMed] [Google Scholar]
- Gerdts J, Summers DW, Sasaki Y, DiAntonio A, and Milbrandt J (2013). Sarm1-mediated axon degeneration requires both SAM and TIR interactions. J. Neurosci 33, 13569–13580. [DOI] [PMC free article] [PubMed] [Google Scholar]
- Gerdts J, Summers DW, Milbrandt J, and DiAntonio A (2016). Axon Self-Destruction: New Links among SARM1, MAPKs, and NAD+ Metabolism. Neuron 89,449–460. [DOI] [PMC free article] [PubMed] [Google Scholar]
- Gonzalez-Scarano F, Beaty B, Sundin D, Janssen R, Endres MJ, and Nathanson N (1988). Genetic determinants of the virulence and infectivity of La Crosse virus. Microb. Pathog 4, 1–7. [DOI] [PubMed] [Google Scholar]
- Gürtler C, Carty M, Kearney J, Schattgen SA, Ding A, Fitzgerald KA, and Bowie AG (2014). SARM regulates CCL5 production in macrophages by promoting the recruitment of transcription factors and RNA polymerase II to the Ccl5 promoter. J. Immunol 192, 4821–4832. [DOI] [PMC free article] [PubMed] [Google Scholar]
- Hayden MS, and Ghosh S (2014). Regulation of NF-κB by TNF family cytokines. Semin. Immunol 26, 253–266. [DOI] [PMC free article] [PubMed] [Google Scholar]
- Horsefield S, Burdett H, Zhang X, Manik MK, Shi Y, Chen J, Qi T, Gilley J, Lai JS, Rank MX, et al. (2019). NAD+ cleavage activity by animal and plant TIR domains in cell death pathways. Science 365, 793–799. [DOI] [PubMed] [Google Scholar]
- Hou YJ, Banerjee R, Thomas B, Nathan C, García-Sastre A, Ding A, and Uccellini MB (2013). SARM is required for neuronal injury and cytokine production in response to central nervous system viral infection. J. Immunol 191, 875–883. [DOI] [PMC free article] [PubMed] [Google Scholar]
- Huang C, Thompson WH, Karabatsos N, Grady L, and Campbell WP (1997). Evidence that fatal human infections with La Crosse virus may be associated with a narrow range of genotypes. Virus Res. 48, 143–148. [DOI] [PubMed] [Google Scholar]
- The Jackson Laboratory (2017). Mouse Facts. Mouse Genome Database. http://www.informatics.jax.org/mgihome/other/mouse_facts1.shtml. [Google Scholar]
- Jeong SI, Kim JW, Ko KP, Ryu BK, Lee MG, Kim HJ, and Chi SG (2018). XAF1 forms a positive feedback loop with IRF-1 to drive apoptotic stress response and suppress tumorigenesis. Cell Death Dis. 9, 806. [DOI] [PMC free article] [PubMed] [Google Scholar]
- Kim Y, Zhou P, Qian L, Chuang JZ, Lee J, Li C, Iadecola C, Nathan C, and Ding A (2007). MyD88-5 links mitochondria, microtubules, and JNK3 in neurons and regulates neuronal survival. J. Exp. Med 204, 2063–2074. [DOI] [PMC free article] [PubMed] [Google Scholar]
- Laird MH, Rhee SH, Perkins DJ, Medvedev AE, Piao W, Fenton MJ, and Vogel SN (2009). TLR4/MyD88/PI3K interactions regulate TLR4 signaling. J. Leukoc. Biol 85, 966–977. [DOI] [PMC free article] [PubMed] [Google Scholar]
- Lee MG, Han J, Jeong SI, Her NG, Lee JH, Ha TK, Kang MJ, Ryu BK, and Chi SG (2014). XAF1 directs apoptotic switch of p53 signaling through activation of HIPK2 and ZNF313. Proc. Natl. Acad. Sci. USA 111, 15532–15537. [DOI] [PMC free article] [PubMed] [Google Scholar]
- Liberati NT, Fitzgerald KA, Kim DH, Feinbaum R, Golenbock DT, and Ausubel FM (2004). Requirement for a conserved Toll/interleukin-1 resistance domain protein in the Caenorhabditis elegans immune response. Proc. Natl. Acad. Sci. USA 101, 6593–6598. [DOI] [PMC free article] [PubMed] [Google Scholar]
- Malapati H, Millen SM, and Buchser WJ (2017). The axon degeneration gene SARM1 is evolutionarily distinct from other TIR domain-containing proteins. Mol. Genet. Genomics 292, 909–922. [DOI] [PubMed] [Google Scholar]
- Martin M (2011). Cutadapt Removes Adapter Sequences From High-throughput Sequencing Reads. EMBnet.journal 17, 10–12. [Google Scholar]
- Meier ID, Bernreuther C, Tilling T, Neidhardt J, Wong YW, Schulze C, Streichert T, and Schachner M (2010). Short DNA sequences inserted for gene targeting can accidentally interfere with off-target gene expression. FA-SEB J. 24, 1714–1724. [DOI] [PubMed] [Google Scholar]
- Mukherjee P, Woods TA, Moore RA, and Peterson KE (2013). Activation of the innate signaling molecule MAVS by bunyavirus infection upregulates the adaptor protein SARM1, leading to neuronal death. Immunity 38, 705–716. [DOI] [PMC free article] [PubMed] [Google Scholar]
- Murata H, Khine CC, Nishikawa A, Yamamoto KI, Kinoshita R, and Sa-kaguchi M (2018). c-Jun N-terminal kinase (JNK)-mediated phosphorylation of SARM1 regulates NAD+ cleavage activity to inhibit mitochondrial respiration. J. Biol. Chem 293, 18933–18943. [DOI] [PMC free article] [PubMed] [Google Scholar]
- Olson EN, Arnold HH, Rigby PW, and Wold BJ (1996). Know your neighbors: three phenotypes in null mutants of the myogenic bHLH gene MRF4. Cell 85, 1–4. [DOI] [PubMed] [Google Scholar]
- Osterloh JM, Yang J, Rooney TM, Fox AN, Adalbert R, Powell EH, Sheehan AE, Avery MA, Hackett R, Logan MA, et al. (2012). dSarm/Sarm1 is required foractivation ofan injury-induced axon death pathway. Science 337, 481–484. [DOI] [PMC free article] [PubMed] [Google Scholar]
- Panneerselvam P, Singh LP, Selvarajan V, Chng WJ, Ng SB, Tan NS, Ho B, Chen J, and Ding JL (2013). T-cell death following immune activation is mediated by mitochondria-localized SARM. Cell Death Differ. 20, 478–489. [DOI] [PMC free article] [PubMed] [Google Scholar]
- Park MS, Shaw ML, Murñoz-Jordan J, Cros JF, Nakaya T, Bouvier N, Palese P, García-Sastre A, and Basler CF (2003). Newcastle disease virus (NDV)-based assay demonstrates interferon-antagonist activity for the NDV V protein and the Nipah virus V, W, and C proteins. J. Virol 77, 1501–1511. [DOI] [PMC free article] [PubMed] [Google Scholar]
- Pham CT, MacIvor DM, Hug BA, Heusel JW, and Ley TJ (1996). Long-range disruption of gene expression by a selectable marker cassette. Proc. Natl. Acad. Sci. USA 93, 13090–13095. [DOI] [PMC free article] [PubMed] [Google Scholar]
- Ran FA, Hsu PD, Wright J,Agarwala V, Scott DA, and Zhang F (2013). Genome engineering using the CRISPR-Cas9 system. Nat. Protoc 8, 2281–2308. [DOI] [PMC free article] [PubMed] [Google Scholar]
- Szklarczyk D, Morris JH, Cook H, Kuhn M, Wyder S, Simonovic M, Santos A, Doncheva NT, Roth A, Bork P, et al. (2017). The STRING database in 2017: quality-controlled protein-protein association networks, made broadly accessible. Nucleic Acids Res. 45 (D1), D362–D368. [DOI] [PMC free article] [PubMed] [Google Scholar]
- Szretter KJ, Samuel MA, Gilfillan S, Fuchs A, Colonna M, and Diamond MS (2009). The immune adaptor molecule SARM modulates tumor necrosis factor alpha production and microglia activation in the brainstem and restricts West Nile Virus pathogenesis. J. Virol 83, 9329–9338. [DOI] [PMC free article] [PubMed] [Google Scholar]
- Tse MK, Cho CK, Wong WF, Zou B, Hui SK, Wong BC, and Sze KH (2012). Domain organization of XAF1 and the identification and characterization of XIAP(RING) -binding domain of XAF1. Protein Sci. 21, 1418–1428. [DOI] [PMC free article] [PubMed] [Google Scholar]
- Vanden Berghe T, Hulpiau P, Martens L, Vandenbroucke RE, Van Wonterghem E, Perry SW, Bruggeman I, Divert T, Choi SM, Vuylsteke M, et al. (2015). Passenger Mutations Confound Interpretation of All Genetically Modified Congenic Mice. Immunity 43, 200–209. [DOI] [PMC free article] [PubMed] [Google Scholar]
- Wan L, Essuman K, Anderson RG, Sasaki Y, Monteiro F, Chung EH, Osborne Nishimura E, DiAntonio A, Milbrandt J, Dangl JL, and Nishimura MT (2019). TIR domains of plant immune receptors are NAD+-cleaving enzymes that promote cell death. Science 365, 799–803. [DOI] [PMC free article] [PubMed] [Google Scholar]
- Zhang Q, Zmasek CM, Cai X, and Godzik A (2011). TIR domain-containing adaptor SARM is a late addition to the ongoing microbe-host dialog. Dev. Comp. Immunol 35, 461–468. [DOI] [PMC free article] [PubMed] [Google Scholar]
- Zhu C, Li B, Frontzek K, Liu Y, and Aguzzi A (2019). SARM1 deficiency up-regulates XAF1, promotes neuronal apoptosis, and accelerates prion disease. J. Exp. Med 216, 743–756. [DOI] [PMC free article] [PubMed] [Google Scholar]
Associated Data
This section collects any data citations, data availability statements, or supplementary materials included in this article.
Supplementary Materials
Data Availability Statement
The accession numbers for the RNaseq datasets reported in this paper are GEO: GSE136221 and GEO: GSE136284, and for the Xaf1 transcripts are GenBank: MN366017-366019.