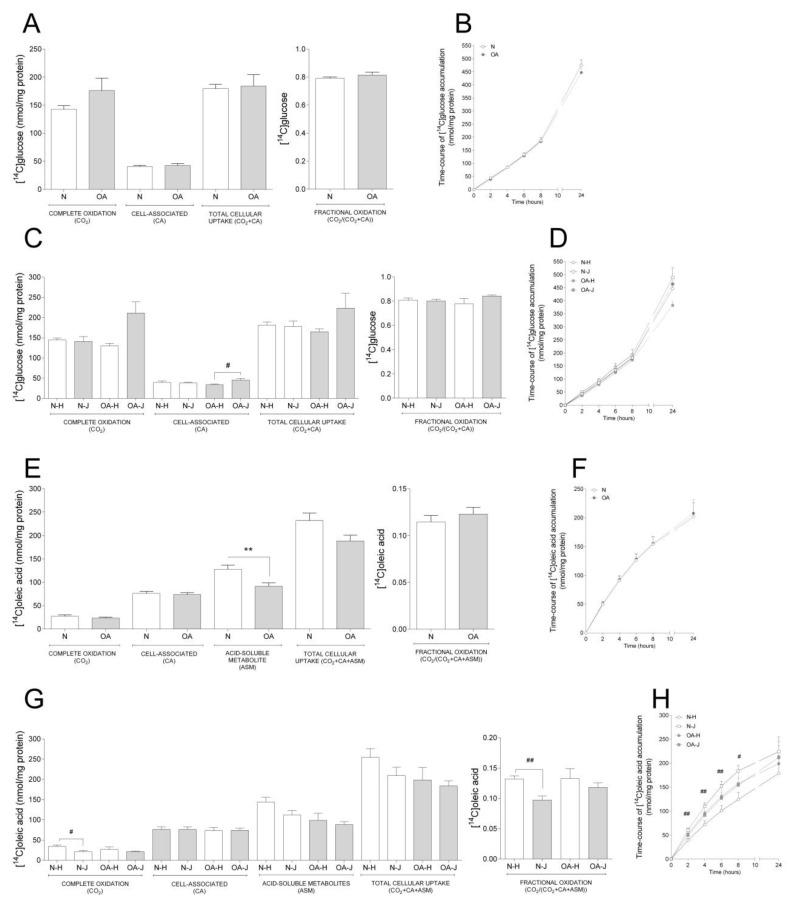
Figure 1.
Basal glucose and fatty acid metabolism. Cybrids were cultured for 48 h in DMEM-glu (A–D, i.e., DMEM 5.5 mM glucose) or DMEM-ole (E–H, i.e., DMEM no glucose supplemented with 100 µM oleic acid). Thereafter, basal glucose and oleic acid metabolism were evaluated using D-[14C(U]glucose (0.5 µCi/mL, 200 µM) or [1-14C]oleic acid (0.5 µCi/mL, 100 µM), respectively, and 4 h substrate oxidation assay (A, C, E, and G) or 24 h SPA (B, D, F, and H). (A,B) Basal glucose metabolism in healthy (N) and osteoarthritic (OA) cybrids. (C,D) Basal glucose metabolism in cybrids carrying haplogroups H or J. (E,F) Basal oleic acid metabolism in N and OA cybrids. (G,H) Basal oleic acid metabolism in cybrids carrying haplogroups H or J. N and OA data included the values for haplogroups H and J combined. All data were obtained from three independent experiments, each with four replicates and two clones per donor. Values are presented as mean ± SEM in nmol/mg protein. * Statistically significant difference between N and OA cybrids (** p ≤ 0.005, unpaired t-test). # Statistically significant difference between haplogroups (# p ≤ 0.05, ## p ≤ 0.005, Mann–Whitney test).

