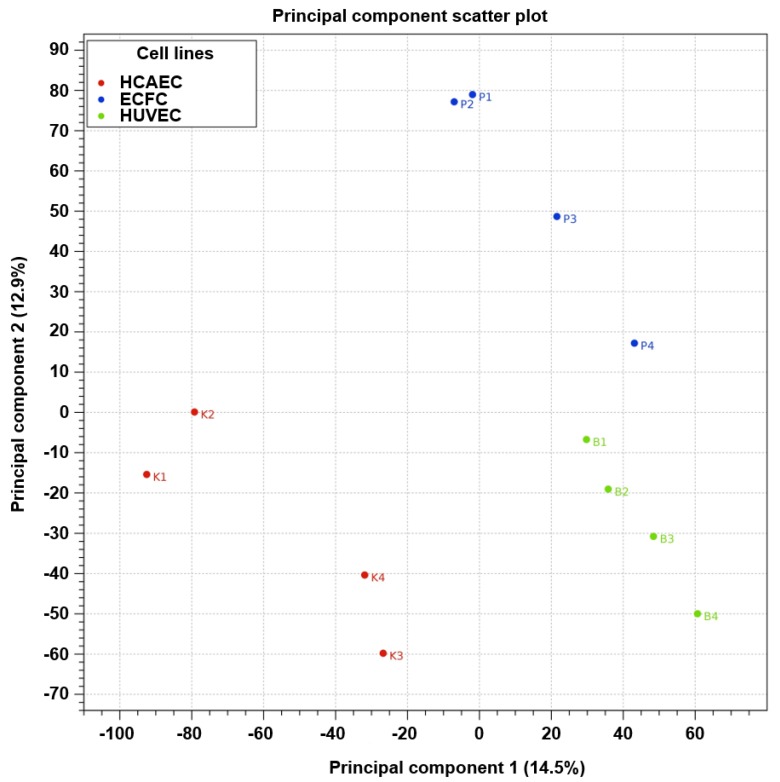
Figure 7.
2D sample clustering based on a principal component analysis (PCA) of differentially expressed genes (DEGs). The red, blue, and green dots indicate HCAEC, ECFC, and HUVEC samples, respectively. Principal components are defined along the X and Y axes as component 1 and component 2, respectively; the proportion of explained data variance is indicated in brackets for each principal component.

