

Abstract
Exposure to particulate matter (PM) in school environments has been associated with respiratory illnesses among children. Although using air cleaners was reported to reduce PM exposure and improve residents’ health in homes, their effects in classrooms are not well understood. We examined how the use of air cleaners in classrooms and school/classroom characteristics affect the levels of indoor PM. Our environmental study included 102 classrooms from 34 elementary schools located on the mainland peninsula and an island in Korea. Indoor and outdoor PM were monitored simultaneously with portable aerosol spectrometers, and indoor gravimetric PM levels were measured with low volume, size-selective samplers during the class hours. Correlations among PM measurements were computed and final multiple regression models for indoor PM were constructed with a model building procedure. Correlation between indoor and outdoor PM2.5 (PM < 2.5 μm in aerodynamic diameter) was higher (r = 0.78, p < 0.01) than that of PM10 (PM < 10 μm) (r = 0.49, p < 0.01). School location, classroom occupant density, and ambient PM levels significantly (p-values<0.05) affected classroom PM concentrations. The adjusted PM levels in classrooms using air cleaners were significantly (p-values<0.01) lower by approximately 35% than in classrooms not using them. However, air cleaners appeared to remove PM2.5 more effectively than PM10, perhaps because coarse particles settle more rapidly than fine particles on surfaces, or their resuspension and generation rate by occupants exceeds the removal rate by air cleaners. Our study suggests that routine cleaning to remove surface dust along with the use of air cleaners might be required to effectively reduce occupants’ exposure in classrooms.
Keywords: Particulate matter, Air cleaner, School, Classroom, Cleaning
1. Introduction
People living in modern society spend a large proportion of their time in the indoor environment. Thus the indoor environment plays a critical role in lifetime personal exposures to particulate matter [PM, indicating both PM2.5 (PM < 2.5 μm in aerodynamic diameter) and PM10 (PM < 10 μm in aerodynamic diameter)] and other pollutants [1]. Among indoor environments, classrooms and other school rooms are especially important to teachers and students as they spend a majority of their daytime in schools [1]. The U.S. Department of Education reported that school teachers in the United States spend more than 50 h during a week [2] and students in elementary schools spend 6.64 h/school day in schools during an average of 180 days per year [3]. Compared with the United States, Korean students in elementary schools spend approximately 11% more time per day in schools during an average of 190 days per year [4,5]. All three reports above indicate that indoor exposures to PM in schools are likely to play a substantial role in occupants’ health and could have negative impacts on students’ learning [6]. Indoor PM could also have dynamic chemical reactions with indoor semivolatile organic compounds [7], which can make indoor PM more toxic than outdoor PM [8].
Numerous studies on ambient PM have documented adverse respiratory and cardiovascular effects that could be causally associated with the exposures [9]. Epidemiologic studies of school children have also documented that exposure to ambient PM was associated with various adverse health and performance outcomes. These included impaired neurological function, lower cognitive function test scores, and lower IQ scores [10,11], as well as lower attendance rates and academic performance [12]. However, there has not been much research on the importance and contribution of indoor PM exposures to people’s total PM exposures and health, especially for teachers and students in schools. The National Academies recently published the workshop summary of research findings on indoor PM exposures and health effects. The report provided insight to the importance of indoor PM exposures and identified future research needs in many areas. These included health risks of PM that is generated indoors, outdoor PM transport to indoors, mechanistic understanding of resuspension, and indoor chemistry [7].
Using air cleaners in homes has been demonstrated to effectively reduce indoor PM concentrations and thus have beneficial effects on occupants’ health [13]. However, the level of occupants’ physical activity is likely to be much lower in homes than in schools. Therefore, the use of air cleaners in school classrooms might show different levels of effectiveness in removal of indoor PM compared with homes. Yet, studies documenting effectiveness of the use of air cleaners in removing indoor PM in classrooms or their beneficial effects on occupants’ health are scarce in literature. In a school study with a cross-over design, Mattsson and Hygge [14] reported that prevalence of airway and eye symptoms in students decreased during the use of electrostatic air cleaners. However, more intervention studies using air cleaners are required to confirm their beneficial effects.
Furthermore, surrounding environments of schools such as region (e. g., urban versus rural), residential/commercial areas, or vehicular traffic volume are likely to significantly influence concentration, composition, and size distribution of ambient PM [7]. These ambient PM infiltrate into school buildings and become indoor PM [7]. In addition, some indoor classroom features such as ventilation, occupant density, or student activity levels could be important determinants of the classroom PM levels [15].
The primary goal of our observational study was to examine how the use of air cleaners can affect indoor PM2.5 and PM10 concentrations in classrooms of elementary schools using statistical models after adjusting for school- or classroom-associated features. These features could not only be important determinants of classroom PM but also potential confounding factors to associations of using air cleaners with the indoor PM levels in the study. Likewise, the use of air cleaners could also be a confounding factor to associations of these individual features with classroom PM levels. Thus, the secondary goal of the study was to evaluate the effects of the individual school/classroom features on the indoor PM2.5 and PM10 concentrations using multiple regression models adjusted for the use of air cleaners and the other school- and classroom-associated features.
2. Methods
2.1. Study design
We conducted an observational environmental study of 34 elementary schools that did or did not use air cleaners to evaluate the effect of using air cleaners on concentrations of indoor PM and to develop guidelines for operation and management of air cleaners in schools in Korea. All school buildings were made of brick or concrete reinforced with steel and built from 1919 to 2014. Of these schools, 65% were built before 1970. As of May 2017, 26% of classrooms in all K–12 grade schools in South Korea had air cleaners installed [16]. In school classrooms of our study, seven different styles of air cleaners were installed. They included portable (located at the front of the classroom), stationary on floor (located in the back corner of the classroom), wall-mounted, or ceiling-mounted air cleaners; wall-mounted air recirculation units; mechanical ventilation; and filter units installed in windows. Except for mechanical ventilation and window-mounted filter units, Korean Industry Standards (KS)-recommended room size for the air cleaners determined by CADR (Clean Air Delivery Rate) and provided by manufacturers ranged from 66 to 152.8 m2. The ratios of the recommended size to actual size of the classroom installed with them ranged from 1.0 to 2.2 (median = 1.9 and 97% of classrooms greater than 1.0), indicating the cleaning capacity of the air cleaners for the classrooms met the recommendation. Teachers in classrooms defined as “using air cleaners” were instructed to operate the air cleaners for more than 5 h during the 6-h sampling period. Classrooms defined as “not using air cleaners” did not operate air cleaners at all during the sampling period.
2.2. Environmental sampling
Sampling was performed in 19 schools (72 classrooms) on the mainland of the Korean Peninsula during winter (November and December) of 2017, and 15 schools (30 classrooms) on a southern island during spring (May) of 2018. During weekdays, indoor and outdoor PM were monitored simultaneously using portable aerosol spectrometers (PAS) (Models 1.108 and 1.109, GRIMM Aerosol Technik, Ainring, Germany) with 15 channels over 0.3–20 μm (model 1.108) or 31 channels over 0.25–32 μm (model 1.109) particle aerodynamic diameter at a flow rate of 1.2 L/minute [17]. All PASs were sent to the Korea Testing Laboratory for calibration before use in the study. We also compared the performance of the four PASs every two weeks by placing them and simultaneously measuring indoor PM within the same environments (e. g., school hallways) to ensure that PM readings by channel were comparable with one another (i.e., <30% coefficient of variation). PM number concentrations by channel were recorded every minute for 6 h from 9am to 3pm during the class session. Number concentrations were converted to mass concentrations using firmware provided by the manufacturer. Finally, PM10 and PM2.5 mass concentrations were calculated on the basis of mass distribution. For statistical analyses of aggregate data, we calculated average PM10 and PM2.5 mass concentrations of 360 measurements in each classroom for the 6-h sampling period. Indoor gravimetric sampling of PM10 and PM2.5 was also performed for 6 h each day in classrooms using Mini-Vol, size-selective air samplers (KMS 4100, KEMIK Cooperation, Sungnam, South Korea). The samplers were loaded with an 47 mm polytetrafluoroethylene membrane (0.45 μm pore size) or quartz filter, and sampling was performed at 5 L/min flow rate. The pump flow rate was checked before and after sampling to ensure it remained within ± 5% of the target flow rate. The filters were equilibrated at 20 ± 1 °C and 45 ± 5% relative humidity for 24 h before being weighed with a micro filter balance (Model CPA2P–F, Sartorius, Goettingen, Germany). All filters were weighed three times before and three times after sampling, and the average measurement was used to obtain pre- and post-sampling filter weights. All indoor PM samplers and monitors were located on top of a 1.2 to 1.5-m-high shelf at the back of each classroom to minimize interference with class activity. Outdoor PASs were located outside classrooms at a height of 1.5 m using tripods.
We obtained a total of 157 measurements of average PM from 102 classrooms. The number of sampled classrooms per school ranged from one to eight. Two classrooms in each school were simultaneously sampled on each day. Seventy-two percent of the classrooms had one measurement and the remaining 28% had more than one measurement (two from 18 classrooms; three from eight; and four from three) on consecutive days within two weeks. Not all classrooms were sampled with both PAS and gravimetric method. We had PAS monitoring data from 92 classrooms and gravimetric measurements from 82 classrooms, and both from 72 classrooms. Real-time monitoring of PM with PAS was performed indoors and outdoors simultaneously in 87 classrooms (85%) (116 measurements, 74%) while gravimetric measurement was performed only indoors.
Carbon dioxide (CO2) was monitored as an indicator of the adequacy of outdoor air ventilation in 46 classrooms using a non-dispersive-infrared CO2 sensor (Indoor Air Quality Monitor, Model IQ-610Xtra, Graywolf Sensing Solutions, Washington, USA) every minute, and a 6-h average was calculated. The same instrument was used to monitor temperature and relative humidity (RH) in 39 classrooms every 5 min for 6 h, and average temperature and relative humidity of all 73 measurements for each classroom were computed. Trained field staff during each sampling campaign collected and recorded information on school-or classroom-related features such as locations, surrounding area, presence of construction around schools, windows open/closed, floor cleaning methods, grade, floor type, wearing indoor shoes, number of teachers and students, and size of classroom. Vehicular traffic volume was estimated by evaluating presence of the largest-lane street/road within a 150 m radius (approximately 500 feet) from each school and defined as follows: small (2 or 3 lanes), moderate (4 or 5), high (6 or 7), and very high (8 or more). Presence of farms, oceans, and hills with dense trees within a 1.6 km (approximately one mile) radius from each school was evaluated through Google Maps.
2.3. Statistical analysis
The U.S. Environmental Protection Agency (EPA) document [13] on residential air cleaners emphasized the difference between ‘efficiency’ and ‘effectiveness.’ It defined that efficiency, which we did not evaluate in our study, is “a fractional measure of its ability to reduce the concentration of pollutants in the air that passes once through the device”. However, effectiveness is “a measure of its ability to remove pollutants from the space in which it is operated.” In our study, coarse particles were defined as PM between 2.5 and 10 μm (PM2.5–10) in aerodynamic diameter and fine particles as 0.1–2.5 μm. Thus, PM10 contains coarse and fine particles. Because indoor PM10 and PM2.5 measurements were approximately log normally distributed (Shapiro-Wilk normality test), we log transformed them for statistical modeling. Paired-Student t-tests were performed to test for differences between paired measurements (e. g., indoor and outdoor PAS PM measurements), indoor to outdoor ratio for PM2.5 and PM10, indoor PAS and indoor gravimetric PM measurements, and PM10 and PM2.5.
A model building procedure included log-transformed indoor PM10 or PM2.5 mass concentration measured with PAS or gravimetric method as the dependent variable, and school- or classroom-associated characteristics and outdoor PAS PM10 or PM2.5 as independent variables. To build final models, we performed stepwise regression analysis by allowing both backward elimination and forward addition of important predictors to the models to obtain the minimum AIC (Akaike Information Criteria) [18]. The full model included all school- and classroom-related variables described in the previous section. We forced the model building procedure to include three predictors (outdoor PM levels, classroom occupant density, and the use of an air cleaner) in the final models. To estimate effects of continuous predictors on indoor PM such as outdoor PM concentration (μg/m3) and classroom occupant density (number of occupants per m2 of classroom area), we calculated changes in indoor PM concentrations corresponding to IQR (interquartile range) changes in the predictor variables. We also estimated least squares means (LSMeans) for each level of categorical predictors adjusted for the rest of the predictors selected for the final models. CO2, temperature, and RH were not included in the model building because only a subset of classrooms (<50) were monitored for them, and their inclusion resulted in deleting many classrooms with PM measurements from the models. We could not evaluate effects of individual type of air cleaners on indoor PM levels in multivariate models because of a small sample size for each air cleaner type. Multiple regression models for the ratio of indoor PM2.5 to PM10 (mass fraction of PM2.5 in PM10 mass concentration) measured with PAS were also constructed through the same model building procedure as described earlier.
Pearson correlation coefficients were computed to examine correlations among indoor and outdoor PM measurements. Repeated measurement analyses were not performed because the number of repeated measurements was relatively small, not evenly distributed across schools and classrooms, and mostly (71%) from 3rd and 5th grades. All statistical analyses were performed using R (version 3.4.3, The R Foundation for Statistical Computing, Vienna, Austria; packages: tidy-verse, MASS, emmeans, Hmisc, rcorr, ggpairs, and arm) and statistical significance was set at p-value ≤ 0.05 and marginal significance at 0.05 < p-value ≤ 0.1.
3. Results
3.1. Characteristics of schools and classrooms
The majority of schools were located in either the northern part (metropolitan area) or a southern island in Korea (71%), and in residential areas (68%) (Table 1). Many schools (65%) had neighboring hills or parks with dense trees, farming areas, or ocean within a 1.6 km (one mile) radius from the school. At least one large street with 6 or more lanes was identified within an approximately 150 m radius from the majority of the schools (71%). More than 90% of school classroom floors were made of wood. Only two classrooms had mechanical ventilation with air filters running during the sampling campaign. Participating classrooms were from all six elementary grades with the highest number in 5th grade (29%). On average, the classrooms had 23 students and one teacher in an average classroom size of 68.1 m2, giving an average occupant density of 0.36 per m2. All students had to take off their outdoor shoes but students in 89% of classrooms had to wear indoor shoes (barefoot in the rest of the classrooms) when they entered the building. The most common floor cleaning method was sweeping with a broom or wet mopping (57%) after school classes. Approximately 64% of the participating classrooms operated air cleaners during the sampling period. Ninety-eight percent of the classrooms were in class session and only 13% of the measurements were collected from classrooms with windows ever opened during the sampling period.
Table 1.
Characteristics of schools (N = 34) and classrooms (N = 102) in the study.
| Schools | Classrooms | ||
|---|---|---|---|
| Characteristics | N (%) | Characteristics | N (% or SD) |
| Location within country | Grade | ||
| Northern region | 9 (27) | First | 18 (18) |
| Middle region | 5 (15) | Second | 18 (18) |
| Southern region | 5 (15) | Third | 17 (17) |
| Island | 15 (44) | Fourth | 13 (13) |
| Fifth | 30 (29) | ||
| Sixth | 6 (6) | ||
| Traffic volume around schoola | Average number of students/classroom (SD) | 23.4 (4.2) | |
| Low | 4 (12) | ||
| Moderate | 6 (18) | Average size of classroom, m2 (SD) | 68.1 (7.2) |
| High | 16 (47) | ||
| Very high | 8 (24) | ||
| Floor type | Classroom densityb, N/m2 (SD) | 0.36 (0.1) | |
| Wood | 30 (88) | ||
| Linoleum | 2 (6) | ||
| Rubber tile | 2 (6) | ||
| Construction around school | Indoor shoes on/bare feet | ||
| Yes | 3 (9) | Bare feet | 11 (11) |
| No | 31 (91) | Wearing indoor shoes | 91 (89) |
| Area | Air cleaner operation during the study | ||
| Residential | 23 (68) | Yes | 65 (64) |
| Commercial | 11 (32) | No | 37 (36) |
| Surrounding environmentsc | Floor cleaning method | ||
| Hills with dense trees | 10 (29) | Brooming | 25 (25) |
| Farms | 4 (12) | Brooming and wet mopping | 33 (32) |
| Ocean | 8 (24) | Vacuuming/vacuuming & 1 of other 2 | 28 (28) |
| None of above | 12 (35) | All three methods | 12 (12) |
| Missing | 4 (4) | ||
N: number, SD: standard deviation.
Vehicle traffic volume was estimated by presence of the largest-lane street/road within a 150m-radius from the school: small (2–3 lanes), moderate (4–5), high (6–7), Very high (8).
Range, median, and interquartile range (IQR) of classroom density: range = 0.1–0.5; median = 0.4; IQR = 0.05.
Presence of hills with dense trees, farms or ocean within a 1.6 km-radius from the school.
3.2. Indoor and outdoor PM, and the use of air cleaners
The indoor and outdoor levels of PM2.5 were significantly correlated (correlation coefficient, r = 0.51, p < 0.01) while indoor and outdoor PM10 were not correlated (0.09, p > 0.1) in all classroom PAS measurements (Fig. 1). These correlations were driven by the measurements in classrooms with air cleaners (0.52 for PM2.5 and 0.06 for PM10, n = 88). When the measurements in classrooms without air cleaners were used, correlations were higher (0.78 for PM2.5 and 0.49 for PM10, n = 28, p-values < 0.01) and the indoor-outdoor correlation for PM2.5 was still much stronger than that for PM10. The correlation coefficient between the indoor PM10 and PM2.5 levels measured with PAS was 0.72 (p < 0.01) which was lower than that (r = 0.84, p < 0.01) between outdoor PM10 and PM2.5 (Fig. 1). Likewise, indoor PM10 and PM2.5 measurements using the gravimetric method were highly correlated (0.81, p < 0.01). Indoor measurements with PAS and gravimetric method within the same classroom were significantly (p-values < 0.01) but moderately correlated (r = 0.51 for PM10 and 0.44 for PM2.5).
Fig. 1.
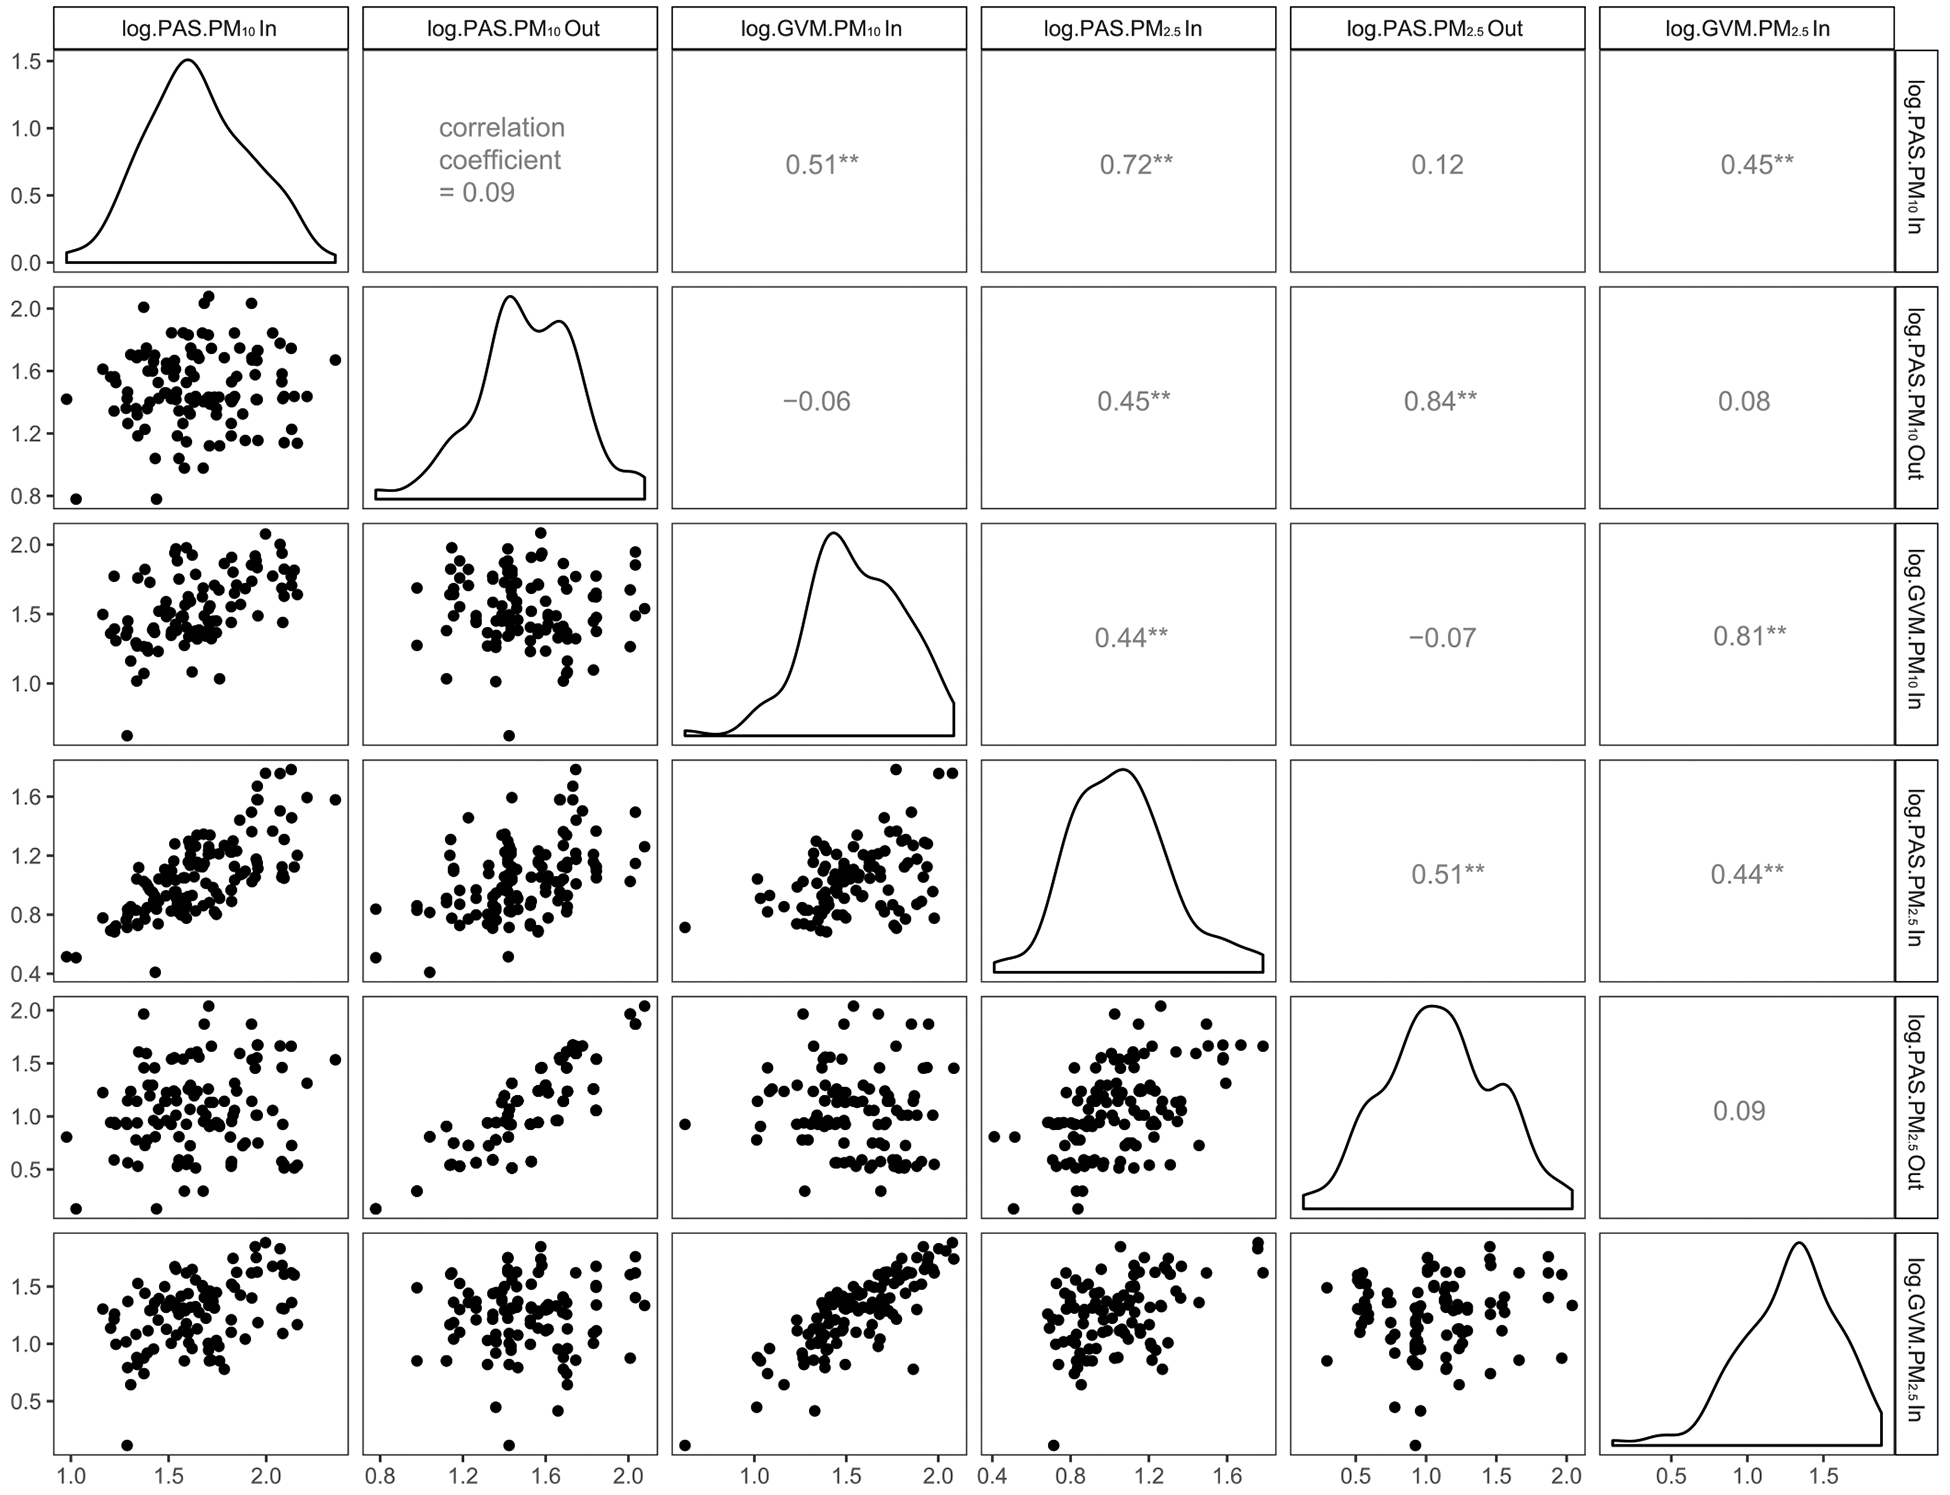
Scatter plots and correlation coefficients among indoor and outdoor PM measurements. Footnote: PAS (portable aerosol spectrometer; GRIMM); GVM = gravimetric method; ** p-value<0.05.
Paired Student t-tests (n = 116) using all classroom measurements indicated the level of indoor PM2.5 was similar to outdoor PM2.5 while indoor PM10 was significantly (p < 0.01) higher than outdoor PM10 (Table 2). The same analysis for the paired measurements (n = 91) using only classrooms with air cleaners indicated that indoor PM2.5 was significantly (p = 0.01) lower than outdoors (10.0 versus 12.3) while the indoor PM10 was still significantly (p = 0.03) higher than outdoors (39.3 versus 32.8). However, when we performed the same t-test using only classrooms without air cleaners (n = 28 pairs), both PM10 and PM2.5 levels were significantly (p-values < 0.01) higher indoors than outdoors (15.5 versus 9.2 for PM2.5; 66.6 versus 25.6 for PM10).
Table 2.
Summary statistics of measurements of particulate matters and other indoor parameters.
| Characteristics | Unit | N | Minimum | Maximum | GM (GSD)a or AM (SD)b | Paired t-testc |
|---|---|---|---|---|---|---|
| Aerosol spectrometer | ||||||
| Indoor PM2.5 | μg/m3 | 127 | 2.6 | 60.7 | 11.5 (1.8)a | A E** |
| Outdoor PM2.5 | μg/m3 | 141 | 1.3 | 109.6 | 12.6 (2.5)a | A |
| Indoor/Outdoor PM2.5 | No unit | 116 | 0.11 | 5.83 | 1.31 (1.12)b | D** |
| Indoor PM10 | μg/m3 | 127 | 9.5 | 226.0 | 44.9 (1.8)a | B**F** |
| Outdoor PM10 | μg/m3 | 141 | 6.0 | 119.8 | 32.4 (1.8)a | B** |
| Indoor/Outdoor PM10 | No unit | 116 | 0.23 | 10.53 | 2.01 (1.81)b | D** |
| Indoor PM2.5/PM10 | No unit | 127 | 0.09 | 0.59 | 0.28 (0.12)b | C** |
| Outdoor PM2.5/PM10 | No unit | 141 | 0.11 | 0.92 | 0.44 (0.22)b | C** |
| Gravimetry (Indoor only) | ||||||
| PM2.5 | μg/m3 | 118 | 1.3 | 76.2 | 19.0 (2.1)a,d | E** |
| PM10 | μg/m3 | 119 | 4.2 | 121.4 | 35.7 (1.8)a,d | F** |
| PM2.5/PM10 | No unit | 118 | 0.08 | 0.99 | 0.57 (0.20)b,d | – |
| Indoor carbon dioxide | ppm | 74 | 709 | 2,363 | 1,392 (364)b | – |
| Indoor temperature | °C | 67 | 12.8 | 25.7 | 20.4 (2.4)b | – |
| Indoor RH | % | 67 | 11.6 | 81.3 | 28.8 (1.4)a | – |
P-values:
< 0.001.
GM: geometric mean; GSD: geometric standard deviation; RH: relative humidity.
AM: arithmetic mean; SD: standard deviation.
Paired student t-test was comparing between the same letters across the rows: AA (indoor PM2.5 and outdoor PM2.5), BB (indoor PM10 and outdoor PM10), CC (indoor ratio of PM2.5 to PM10 and the outdoor ratio of PM2.5 to PM10), DD (PM10 ratio of indoor to outdoor and PM2.5 ratio of indoor to outdoor), EE (PAS PM2.5 and gravimetric PM2.5), and FF (PAS PM10 and gravimetric PM10); the comparison of AA was not significant (p = 0.65).
Integrated air sampling was conducted only in 80 classrooms of 24 schools.
Real-time indoor and outdoor monitoring data using PASs indicated the every-minute I/O ratios (the ratio of indoor to outdoor) for both PM2.5 and PM10 in classrooms without air cleaners typically remained higher than one throughout the 6-h monitoring period. However, in the majority of classrooms (higher than 70%) with air cleaners, the I/O ratios for PM2.5 were lower than one for most of the monitoring period while the ratios for PM10 still remained higher than one. Typical examples of the every-minute I/O ratios for both PM2.5 and PM10 in two first grade classrooms with and without air cleaners in the same school were presented in Fig. 2. To confirm this observation, we analyzed the I/O ratio using aggregate data of PAS PM measurements from all classrooms (Table 2), and classrooms with and without air cleaners. In classrooms without air cleaners, 85% of the indoor PM2.5 measurements and 97% of indoor PM10 were higher than outdoors. In the paired t-test using the same classrooms, the I/O ratio of PM2.5 was significantly (p = 0.02) lower than that of PM10 (mean ratio = 2.00 for PM2.5 and 3.16 for PM10). On the other hand, the same analyses using only classrooms with air cleaners indicated that only 35% of the indoor PM2.5 measurements were higher than outdoors (median I/O ratio = 0.79) while 55% of the indoor PM10 measurements were still higher than outdoors (median I/O ratio = 1.06).
Fig. 2.

Monitoring results of indoor and outdoor PM2.5 and PM10 concentrations in two first grade classrooms: one classroom without air cleaner (first column) and another classroom with air cleaner (second column) in the same school on the same day. Two classrooms had the same number of students (n = 26) and teacher (n = 1), and the same size of floor area. The class started 9:00am and continued until 1:50pm with a 10-min break for every 40 min and a lunch break between 12:20 and 1:10pm.
In crude analyses, indoor PM2.5 mass concentration measured with PAS in all classrooms represented, on average, 28% of the indoor PM10 concentration. And this was significantly (paired t-test p-value < 0.001) lower than the representation (44%) of outdoor PM2.5 in outdoor PM10 (Table 2). A similar amount (26%) was also represented by indoor PM2.5 in indoor PM10 in classrooms without air cleaners. When we used gravimetric measurements, indoor PM2.5 represented, on average, 57% of indoor PM10 (Table 2).
In unadjusted analyses, classroom occupant density was not correlated with the PAS PM2.5 levels while it was marginally (p = 0.07) correlated (r = 0.16) with the PAS PM10 levels. However, the gravimetric PM2.5 and PM10 levels were significantly (p-values < 0.01) but moderately correlated (0.43 and 0.40, respectively) with classroom occupant density. With paired measurements for both PAS and gravimetric method indoors, the level of PAS PM10 was significantly (p < 0.01) higher by an average of 9.2 μg/m3 than gravimetric PM10. On the other hand, PAS PM2.5 was significantly (p < 0.01) lower by 7.5 μg/m3 than gravimetric PM2.5 (Table 2).
The average level of indoor CO2 was 1,392 ppm with a large variation (SD = 364, range: 709–2,363 ppm) and the indoor CO2 level was significantly but weakly (r = 0.3, p = 0.01) correlated with classroom occupant density. Average temperature and relative humidity inside classrooms were 20.3 C and 28.8%, respectively, with a small variation (SD = 2.4 and 1.4, respectively).
3.3. Multivariate regression models for indoor PM
In the final multivariate linear regression models for indoor PM mass concentrations, outdoor PM was consistently a significant factor affecting both indoor PM2.5 and PM10 (Tables 3 and 4) although the windows were closed for most (87%) of the classrooms during PM measurements. However, Figs. 3 and 4 indicate the effect of the outdoor PM2.5 level on the log-transformed indoor PM2.5 level was stronger than that of outdoor PM10 on indoor PM10 in PAS measurements (0.34 versus 0.21 per 50 μg/m3 increase in the outdoor level). The average PAS PM2.5 and PM10 concentrations in the classrooms with air cleaners were significantly (p-values < 0.01) lower than those without air cleaners [10.4 versus 16.2 μg/m3 (36% lower) for PM2.5; 57.6 versus 87.5 μg/m3 (34% lower) for PM10]. However, we did not see the same significant effect of the air cleaners on gravimetric PM measurements. Classroom occupant density significantly increased both indoor PM2.5 and PM10. Fifth and 6th grade classrooms had significantly (p-values < 0.05) higher concentrations of gravimetric PM2.5 measurements than 1st graders’ classrooms while 2nd grade classrooms had marginally lower concentration in PAS PM10 than that of 1st grade. However, both the indoor PM10 and PM2.5 concentrations generally had an increasing trend as the grade level increased (Figs. 3 and 4).
Table 3.
Unadjusted and adjusted (least squares) means of indoor PM2.5 by school or classroom features.
| Explanatory variables | PAS | Gravimetry | ||
|---|---|---|---|---|
| Unadjusted | Adjusteda | Unadjusted | Adjusteda | |
| Continuous variable (exponentiated coefficient corresponding to IQR change)b | ||||
| PAS outdoor PM2.5 (IQR) | 1.22** | 1.25** | 1.08 | 1.10** |
| Classroom density, #/m2 (IQR) | 0.98 | 1.01 | 1.50** | 1.46** |
| Air cleaner operation | ||||
| (Ref.) No | 16.2 | 16.6 | 20.9 | 23.7 |
| Yes | 10.4** | 10.6** | 18.3 | 23.1 |
| School region | ||||
| (Ref.) North Metro | 10.9 | – | 16.3 | – |
| Middle | 17.4** | – | 32.0** | – |
| South | 8.1* | – | 22.7* | – |
| Island | 12.9 | – | 16.9 | – |
| School area | ||||
| (Ref.) Commercial | 12.7 | 14.8 | 17.7 | 30.5 |
| Residential | 11.0 | 11.8** | 19.8 | 17.9** |
| Grade | ||||
| (Ref.) 1 | 14.0 | – | 16.9 | 19.1 |
| 2 | 9.7** | – | 15.1 | 19.6 |
| 3 | 11.3 | – | 14.4 | 15.1 |
| 4 | 12.9 | – | 21.9 | 25.2 |
| 5 | 11.6 | – | 23.0 | 30.7** |
| 6 | 11.2 | – | 24.1 | 37.2** |
| Surrounding school area | ||||
| (Ref.) None | 10.5 | – | 19.1 | – |
| Ocean | 15.0** | – | 15.2 | – |
| Hills with trees | 11.8 | – | 20.4 | – |
| Farm | 10.4 | – | 13.1 | – |
| Traffic volume near school | ||||
| (Ref.) Low | 14.6 | 16.0 | 19.8 | 31.0 |
| Moderate | 15.1 | 32.2 | ||
| High | 11.5 | 14.2 | 17.9 | 25.4 |
| Very high | 9.3* | 10.3** | 15.9 | 16.2 |
| Windows ever opened during the measurement day | ||||
| (Ref.) No | 11.6 | – | 19.7 | 19.8 |
| Yes | 11.1 | – | 15.7 | 27.6* |
| Cleaning method | ||||
| (Ref) Dry | 11.3 | – | 17.3 | – |
| Wet | 11.9 | – | 20.6 | – |
| Construction near school | ||||
| (Ref.) No | 10.9 | – | 18.0 | 37.7 |
| Yes | 14.9** | – | 25.1* | 14.5 |
| Wearing indoor shoes or bare foot | ||||
| (Ref) Bare foot | 12.6 | – | 23.0 | 37.0 |
| Indoor shoes on | 11.3 | – | 18.5 | 14.8 |
P-values:
0.05–0.1;
< 0.05.
R2 (adjusted R2) are 0.45 (0.42) for the final model for PAS (portable aerosol spectrometer) measurements and 0.42 (0.33) for the gravimetric measurements.
effects of continuous variables were estimated from coefficients based on IQR (interquartile range) changes in outdoor PM2.5 concentration (14.1 μg/m3) or classroom occupant density (0.05).
Table 4.
Unadjusted and adjusted (least squares) means of indoor PM10 by school or classroom features.
| Explanatory variables | PAS | Gravimetry | ||
|---|---|---|---|---|
| Unadjusted | Adjusteda | Unadjusted | Adjusteda | |
| Continuous variable (exponentiated coefficient corresponding to IQR change)b | ||||
| PAS outdoor PM10, IQR | 1.06 | 1.29** | 0.99 | 1.17** |
| Classroom density, #/m2, IQR | 1.08* | 1.08* | 1.36** | 1.19** |
| Air cleaner operation | ||||
| (Ref.) No | 67.6 | 87.5 | 41.9 | 30.3 |
| Yes | 39.8** | 57.6** | 33.3* | 28.7 |
| School region | ||||
| (Ref.) North Metro | 38.0 | 49.0 | 30.1 | 24.1 |
| Middle | 67.7** | 80.0** | 59.5** | 38.0** |
| South | 48.1 | 46.6** | ||
| Island | 52.6** | 91.5** | 32.6 | 28.0 |
| School area | ||||
| (Ref.) Commercial | 45.2 | 83.8 | 34.1 | 37.5 |
| Residential | 44.7 | 60.2** | 36.6 | 23.2** |
| Grade | ||||
| (Ref.) 1 | 59.9 | 65.9 | 32.6 | – |
| 2 | 33.4** | 46.9* | 27.8 | – |
| 3 | 41.1** | 67.8 | 28.6 | – |
| 4 | 48.7 | 66.6 | 41.2 | – |
| 5 | 46.3 | 77.4 | 42.0 | – |
| 6 | 77.5 | 119.0 | 46.9 | – |
| Surrounding school are | ||||
| (Ref.) None | 41.1 | – | 34.1 | 33.2 |
| Ocean | 50.7 | – | 40.0 | 31.1 |
| Hills with trees | 47.3 | – | 38.8 | 41.3 |
| Farm | 43.0 | – | 22.8 | 17.8** |
| Traffic volume near school | ||||
| (Ref.) Low | 53.3 | – | 28.8 | 39.9 |
| Moderate | 52.5 | – | 51.6 | |
| High | 46.5 | – | 37.4 | 33.3 |
| Very high | 37.9 | – | 29.7 | 19.6** |
| Windows ever opened during the measurement day | ||||
| (Ref.) No | 46.4 | – | 38.3 | 32.4 |
| Yes | 36.1 | – | 25.5** | 26.9 |
| Cleaning method | ||||
| (Ref) Dry | 42.5 | – | 33.4 | – |
| Wet | 47.8 | – | 37.8 | – |
| Construction near school | ||||
| (Ref.) No | 44.7 | – | 34.0 | 37.7 |
| Yes | 45.7 | – | 45.8** | 23.1 |
| Wearing indoor shoes or bare foot | ||||
| (Ref) Bare foot | 45.3 | 81.6 | 35.5 | – |
| Indoor shoes on | 44.8 | 61.8 | 35.8 | – |
R2 (adjusted R2) are 0.39 (0.32) for the final model of PAS (portable aerosol spectrometer) measurements and 0.44 (0.36) for the gravimetric measurements.
effects of continuous variables were estimated from coefficients based on IQR (interquartile range) changes in outdoor PM10 concentration (25.6 μg/m3) or classroom occupant density (0.05).
P-values:
0.05–1;
< 0.05.
Fig. 3.

Coefficient plots of the final multivariate linear regression models for indoor PM2.5 measured with portable aerosol spectrometer (panel A) and gravimetric sampling method (panel B).
Footnote: Black dots and lines indicate regression coefficients and 95% confidence interval (CI), respectively. Empty information on coefficients and 95% CI for certain variables indicates that those variables were not selected in the final models. CR: classroom; Traffic H: high vehicular traffic; Traffic VH: very high vehicular traffic.
Fig. 4.

Coefficient plots of the final multivariate linear regression models for indoor PM10 measured with portable aerosol spectrometer (panel A) and gravimetric sampling method (panel B).
Footnote: Black dots and lines indicate regression coefficients and 95% confidence interval (CI), respectively. Empty information on coefficients and 95% CI for certain variables indicates that those variables were not selected in the final models. CR: classroom; Traffic H: high vehicular traffic; Traffic VH: very high vehicular traffic; MetSeoul: metropolitan area in the northern part of the country.
School region was not associated with indoor PM2.5 levels but was significantly associated with indoor PM10 (Tables 3 and 4). Schools located on the island or in the middle/southern part of the country had significantly higher indoor PM10 concentration than those in the metropolitan areas. In addition, school classrooms located in residential areas had the significantly lower indoor PM2.5 and PM10 concentrations than those in commercial areas. Classrooms with very high traffic volume around schools unexpectedly had the lowest concentrations of both indoor PM2.5 and PM10 (Tables 3 and 4). Opening windows anytime during the sampling period was associated with the increased indoor PM2.5 but decreased PM10 levels in the multivariate models for gravimetric measurements. While unadjusted average PM in school classrooms near construction was higher than those in classrooms without construction, adjusted indoor PM did not show the same effect. Adjusted R2 of the final multivariate models ranged from 0.32 to 0.42. The final multivariate model for the indoor PM2.5/PM10 ratio using PAS measurements indicated that the ratio was positively associated with the outdoor ratio (p < 0.01) and negatively with classroom occupant density (p = 0.04) (data not shown). The same model also indicated that schools in the metropolitan region in north had significantly higher ratio than those in the middle/southern region and the island (p < 0.01), and schools near the ocean had significantly higher ratios than schools with other surrounding environments (p < 0.01).
4. Discussion
4.1. Effect of air cleaners on indoor PM concentrations
Our study indicated that adjusted PM concentrations from classrooms using air cleaners were significantly lower than for classrooms not using air cleaners. Recently, the U.S. EPA reported through a comprehensive literature review that the use of high efficiency portable air cleaners in residential buildings reduced indoor PM10 and PM2.5 concentrations by 50% or higher [13]. Barn et al. [19] also reported from their study of 32 residential buildings with wood burning or during forest fire events that effectiveness of air cleaner with HEPA (high efficiency particulate air) filter in removal of PM2.5 was 55% in winter (19 homes) and 65% in summer (13 homes). Likewise, Cox and colleagues’ [20] most recent study of 41 homes with the use of HEPA air cleaners and 38 homes without their use documented that HEPA air cleaners substantially reduced occupants’ exposures to indoor PM2.5. Although our cross-sectional study, by nature, cannot provide a quantitative reduction rate of PM2.5 or PM10, we observed that these PM levels in classrooms using air cleaners were lower than those without air cleaners by 36% for PM2.5 and 34% for PM10. Thus, our results indicate that using air cleaners in classrooms is likely to reduce indoor PM concentrations. However, the effectiveness of PM removal in classroom air might be lower than that in residential buildings, possibly because of higher occupancy and higher generation or resuspension rate of PM in classrooms than in homes. Future studies of generation and resuspension rates by students’ activity level in chamber studies resembling classroom environments could be beneficial to better understand its contribution to the classroom PM2.5 and PM10 concentrations and impacts on removal effectiveness of air cleaners.
From our study, we also found that: 1) indoor PM2.5 was significantly correlated with outdoor PM2.5 in classrooms with air cleaners while indoor PM10 was not correlated with outdoor PM10 in those same rooms; 2) indoor PM2.5/PM10 ratios were negatively associated with classroom occupant density in multivariate models; 3) in classrooms using air cleaners, average indoor PM2.5 level was significantly lower than that outdoors but average indoor PM10 level was still significantly higher than outdoor PM10. On the other hand, both the average PM2.5 and PM10 levels were higher indoors than outdoors in classrooms without air cleaners; and 4) the I/O ratios for PM2.5 were mostly (>70%) lower than one during the real-time monitoring period within the classrooms using air cleaners while the ratios for PM10 remained higher than one for most of the monitoring period. Data analysis of the I/O ratios using aggregate data from classrooms with air cleaners also showed that 65% of those classrooms had the I/O ratios lower than one for PM2.5, compared to 45% for PM10. Our findings could indicate that occupants more strongly influence airborne coarse particles in classrooms compared with fine particles [7,21]. In addition, air cleaners, in general, more effectively remove PM2.5 compared with coarse particles in classroom air although they might efficiently remove both coarse and fine particles in air that entered the air cleaners.
Our observation that air cleaners can be more effective at removing PM2.5 than coarse particles might be further explained by two points: 1) the resuspension or generation rates of coarse or larger particles by students might be higher than the removal rates by air cleaners; or 2) coarse or larger particles settle on indoor surfaces faster than fine/ultrafine particles before reaching the air cleaners’ inlet air stream because terminal settling velocity is proportional to squared aerodynamic diameter [22]. In addition, settling of coarse or larger particles on indoor surfaces does not remove them from classroom air permanently; rather, those particles are likely to accumulate on indoor surfaces over time and be subject to resuspension with disturbance. Although information on efficiency and effectiveness of air cleaners in schools is limited and a large school study such as ours is infrequent in literature, our findings are also supported by a few other studies. Mattsson and Hygge [14] observed the CADR for the electrostatic air cleaners they used for a study of four classrooms was higher for the smaller particles (0.3–0.5 μm) than that for the larger particles (1–5 μm). Croxford et al. [23] also reported that installation of an electrostatic air cleaner in one office in London reduced smaller particles (PM2.0) more effectively than larger particles (PM2–10). Likewise, Ros en and Richardson [24] documented that newly developed electrostatic air cleaners installed in daycare centers in Sweden decreased smaller particles (<0.3 μm) more effectively (78%) than particles larger than 3 μm in aerodynamic diameter (45%). Oh et al.’s study of 10 daycare centers in Korea through repeated measurements of PM in summer, fall, and winter also reported higher effectiveness in reducing PM2.5 (69%) than PM10 (86%) [25]. On the other hand, Wargocki et al. [26] reported from their study of five elementary schools with a cross-over design that the use of electrostatic air cleaners in school classrooms substantially decreased the airborne indoor PM concentrations but not indoor surface dust levels. Taken together, our findings might imply that even in classrooms with air cleaners, settled coarse particles are more likely to remain indoors for a longer period of time with less effective removal than smaller particles. Therefore, routine and comprehensive cleaning of these settled dusts on indoor surfaces, in addition to the use of air cleaners, would be important to minimize exposures to PM, especially coarse particles in PM10.
4.2. Effect of ambient air and other school-/classroom-related features on indoor PM
We found that indoor and outdoor levels of PM2.5 were more strongly (r = 0.78) correlated than those of PM10 (r = 0.49) even in classrooms without air cleaners. We also observed, from the regression models adjusted for other covariates including the use of air cleaners, that the effect of outdoor PM2.5 on indoor PM2.5 was stronger than that of outdoor PM10 on indoor PM10 (Figs. 3 and 4). Our findings likely indicate higher infiltration of ambient PM2.5 into classrooms than that of ambient PM10 and higher generation and resuspension rates of coarse particles in PM10 than PM2.5 indoors [7]. Correlations between indoor and outdoor PM2.5 reported in Raysoni et al.’s [27] study of elementary schools with no air cleaners in a high-altitude city in Ecuador (r = 0.54–0.57) were lower than ours (r = 0.78) for classrooms without air cleaners. Amato et al. [15] reported from a study of 39 elementary schools in Spain that correlation coefficients between indoor and outdoor PM2.5 ranged from 0.71 to 0.96, which is similar to ours. They also showed that 53% of the classroom PM2.5 mass concentration was infiltrated from outdoors. Branis et al. [28] reported from a study of a university lecture room in the Czech Republic that the indoor/outdoor ratio for PM2.5 was lower than one while the ratio for PM10 was higher than one. Our findings along with other studies indicate that ambient air is likely to be one of the major sources of classroom PM2.5 while the main source of classroom coarse particles in PM10 is students themselves (human clothes and shedding from skin) and their indoor activities [7].
We observed that indoor PM2.5 represented 27% of indoor PM10 mass concentration in classrooms without air cleaners while outdoor PM2.5 represented 44% of outdoor PM10 when PAS was used. Alves et al. reported that on average, indoor PM2.5 represented only 13% of the indoor PM10 concentrations measured in one kindergarten and eight classrooms from three elementary schools in Portugal [29]. The PM2.5/PM10 ratio varied widely between studies (0.13–0.52) and was usually higher (up to 0.91) with no occupancy at night compared with during the day [28,29], indicating students’ activity is the main determinant of the ratio. A French school study also demonstrated that occupancy of classrooms contributed to larger particles more than smaller particles [21]. Branis et al. reported the fraction of coarse particle in PM10 was significantly and positively correlated with the number of students per hour and day [28]. Their observation was consistent with our finding of negative association of the indoor PM2.5/PM10 ratio with classroom occupant density. However, the ratio could be also affected by school location as seen from our study as well as other factors such as season, meteorological conditions, and ventilation. Our finding of low concentrations of indoor PM in school classrooms with estimated high vehicular traffic volume was unexpected. However it might be associated with sampling time for the study (9 a.m.–3 p.m.) that was outside of the rush hours (before 9 a.m. and after 4 p.m.). Or these results might be due to significant variations in outdoor traffic contribution to indoor PM2.5 that could be influenced by meteorological condition, school location, orientation of classroom windows, and condition of playground (paved vs unpaved) [15]. However, we cannot also rule out a possibility that estimating vehicle traffic volume by evaluating the presence of the largest-lane street nearby the school might have not accurately reflected actual traffic volume in surrounding areas of schools.
4.3. Comparisons of the classroom PM levels with the standards and other studies
Geometric mean levels of indoor PAS PM2.5 (16 μg/m3) in the study classrooms without air cleaners were lower than those (20–71.5 μg/m3) in elementary school classrooms or daycare centers without air cleaners reported from various countries [27,30–35] and another study from Korea [25]. We were not able to directly compare PM2.5 concentrations in our study to the PM2.5 standard (35 μg/m3) of the Korea Public Health Act for Schools because the current standard was based on 24-h average PM2.5 concentration. However, none of the classroom PM2.5 levels measured with PAS were higher than the current PM2.5 standard (6-h average 70 μg/m3) set by Korea Indoor Air Quality Management Act [36]. Two of the 118 PM2.5 concentrations measured with the gravimetric method (2%) were higher than the same PM2.5 standard (1% of measurements in classrooms with air cleaners versus 3% in the classrooms without). Geometric mean PAS PM10 levels (72 μg/m3) in classrooms without air cleaners in our study were within the range of the mean concentrations (32–169 μg/m3) summarized in Annesi-Maesano et al.’s review article of 20-year research since 1992 [37]. However, the PM10 levels in 11% (14/127) of all measurements with PAS were higher than the current PM10 standard of Korea Public Health Act for Schools (100 μg/m3 for 6-h average) [38]. Of these, eight were from classrooms without air cleaners (28%, 8/29) and six from classrooms with air cleaners (6%, 6/98). On the other hand, only three percent of measurements with gravimetric method (4/119) were higher than the PM10 standard. Of these, two were from classrooms without the use of air cleaner (6%, 2/36). Average CO2 concentrations in 85% of the measurements (62/73, median = 1,377 ppm) from classrooms with natural ventilation were higher than 1,000 ppm standard by the Korea Public Health Act for Schools for classrooms with natural ventilation. Only one of the two classrooms with mechanical ventilation had CO2 measurement (839 ppm) that was lower than 1,500 ppm standard by the same regulation. The average RH was 28.8%, and the majority of measurements were lower than optimal relative humidity, 40% at 18–21 °C during winter and 50% at 19–23 °C during spring, recommended by The Korean Ministry of Environment [39]. This finding indicated dry air in classrooms during the sampling period. Our findings underscore the need for further investigation on CO2 concentrations in classrooms with natural ventilation and humidity during the class hours.
4.4. PAS and gravimetric methods
Correlations between PAS and gravimetric measurement methods (r = 0.43 for PM2.5 and 0.40 for PM10) were lower than that reported (r = 0.71 for PM2.5) in Parker et al.’s study of a school library [40]. We also observed the level of PAS PM10 was higher than gravimetric PM10 while PAS PM2.5 was lower than gravimetric PM2.5. These observations might be associated with potential errors that could be involved in gravimetric sampling method. These errors could result from variations in weighing filters (especially in environments with low PM concentrations), loss of larger particles by deposition on walls of samplers for PM10, or collection of bounced-off particles from the impactor plate on filter for PM2.5. On the other hand, the PAS measurements can also involve errors. The PAS counts the scattering light pulse of every single particle in air passing through the measuring cell and then estimates mass from the counts. In the process of conversion of counts to mass by PAS firmware, several assumptions such as particle density, particle shape, degree of aggregation, refractive index, and hydration are involved [40,41]. These assumptions might not truly reflect the actual characteristics of PM in the specific classroom environments. Errors could be also introduced during particle sizing, which can influence calculated mass concentration because mass is proportional to the particle diameter cubed [41]. The PAS 1.108/1.109 firmware also utilizes calibration curves derived with poly-disperse dolomite dust comprised of calcium magnesium carbonate [17] which might not accurately reflect the measured PM in classrooms. Therefore, the conversion of particle counts to mass in PAS could be influenced by size distribution and aerosol type. Controlled chamber studies also reported overestimation of mass concentration by PAS for Arizona Road Dust which was primarily represented by coarse particles [41,42]. However, we were unable to determine which measurement method more accurately represented the true PM2.5 and PM10 concentrations in the classrooms of our observational study.
One of the strengths in our study is that a relatively large number of classrooms (n = 102) and schools (n = 34) were included in the analyses, which allowed us to build multivariate regression models to evaluate adjusted effects of the use of air cleaners and other predictors on classroom PM concentrations. On the other hand, we had only a one day measurement for most of the classrooms. Repeated measurements during multiple days over different seasons under the conditions with and without using air cleaners in the same classroom would have provided more reliable and generalizable results. However, conducting a longitudinal study of a large number of schools and classrooms is expensive and logistically challenging. Although the samplings were performed during two different seasons, we were not able to separate the effects of the season from those of the school region because all schools on the island were sampled during spring while all schools in other regions were sampled during winter. Our moderate level of model R2 might also indicate that unmeasured confounding or explanatory factors exist in our study. These include class activity level, actual vehicular traffic volume around schools during the measurement day, or potential intrinsic errors involved in instrument measurements. Finally, a range of cleaning efficiency for the different types of air cleaners which were not individually adjusted for might have also contributed to unexplained variation in indoor PM concentrations, resulting in reduced model R2 in our study.
5. Conclusions
From our observational study of 102 classrooms in 34 elementary schools in Korea, we found that classrooms using air cleaners had approximately 35% lower classroom PM2.5 or PM10 concentrations compared with those without air cleaners. However, our analyses indicated that air cleaners removed fine particles more effectively than coarse particles (PM2.5–10). These findings suggest that to remove settled PM, especially coarse particles that are less effectively eliminated by air cleaners, routine and thorough cleaning of classroom surfaces may also be important in minimizing occupants’ exposures. We also observed that ambient air quality is one of the major factors to determine indoor PM2.5 levels in classrooms even if windows are closed. This observation implies that continuous operation of air cleaners with windows closed is likely to help reduce occupants’ exposure to indoor PM2.5, especially during days with high level of outdoor PM2.5. Finally, our study indicated that not only classroom-related factors but also surrounding environments of schools were important determinants of the indoor PM levels, emphasizing the importance of the location of school buildings.
Acknowledgments
We are grateful to Nicole Edwards for her proofreading and Drs. Ginger Chew and Ethan Fechter-Leggett 4for their technical review of the manuscript.
Funding source
This work was supported by the Kyung Hee University, South Korea [grant number: 20181383, 2018] and partially by Korea Ministry of Education, South Korea [no grant number, 2017].
Footnotes
Publisher's Disclaimer: Disclaimer
Publisher's Disclaimer: The findings and conclusions in this report are those of the authors and do not necessarily represent the views of the National Institute for Occupational Safety and Health.
Declaration of competing interestCOI
The authors declare that they have no known competing financial interests or personal relationships that could have appeared to influence the work reported in this paper.
Appendix A. Supplementary data
Supplementary data to this article can be found online at https://doi. org/10.1016/j.buildenv.2019.106437.
References
- [1].U.S. National Academies of Sciences Engineering and Medicine, Microbiomes of the Built Environment: A Research Agenda for Indoor Microbiology, Human Health, and Buildings, The National Academies Press, Washington, DC, 2017. [PubMed] [Google Scholar]
- [2].Goldring RG, Bitterman L,A, Characteristics of Public and Private Elementary and Secondary School Teachers in the United States: Results from the 2011–12 Schools and Staffing Survey, US Department of Education, Washington, DC, 2013. [Google Scholar]
- [3].U.S. National Center for Education Statistics, Schools and staffing survey. https://nces.ed.gov/surveys/sass/tables/sass0708_035_s1s.asp, 2007. Accessed March 30 2019.
- [4].Paek KS, Final Report on International Comparison of Educational Programs and Instruction Days and Hours (in Korean), Ministry of Education, Seoul, Korea, 2013. [Google Scholar]
- [5].The Organization for Economic Co-operation and Development (OECD), Education at a Glance 2018, OECD Publishing, Paris, France., 2018. [Google Scholar]
- [6].U.S. National Research Council, Green Schools: Attributes for Health and Learning, The National Academies Press, Washington, DC, 2006. [Google Scholar]
- [7].U.S. National Academies of Sciences Engineering and Medicine, Health Risks of Indoor Exposure to Particulate Matter: Workshop Summary, The National Academies Press, Washington, DC, 2016. [PubMed] [Google Scholar]
- [8].Oeder S, Jorres RA, Weichenmeier I, Pusch G, Schober W, Pfab F, Behrendt H, Schierl R, Kronseder A, Nowak D, Dietrich S, Fernandez-Caldas E, Lintelmann J, Zimmermann R, Lang R, Mages J, Fromme H, Buters JT, Airborne indoor particles from schools are more toxic than outdoor particles, Am. J. Respir. Cell Mol. Biol 47 (5) (2012) 575–582. 10.1165/rcmb.2012-0139OC. [DOI] [PubMed] [Google Scholar]
- [9].Environmental Protection Agency US, Integrated science assessment for particulate matter, in: National Center for Environmental Assessment- RTP Division, U.S. Environmental Protection Agency, Research Triangle Park, NC, 2009. [PubMed] [Google Scholar]
- [10].Calderon-Garciduenas L, Mora-Tiscareno A, Ontiveros E, Gomez-Garza G, Barragan-Mejia G, Broadway J, Chapman S, Valencia-Salazar G, Jewells V, Maronpot RR, Henriquez-Roldan C, Perez-Guille B, Torres-Jardon R, Herrit L, Brooks D, Osnaya-Brizuela N, Monroy ME, Gonzalez-Maciel A, Reynoso-Robles R, Villarreal-Calderon R, Solt AC, Engle RW, Air pollution, cognitive deficits and brain abnormalities: a pilot study with children and dogs, Brain Cogn. 68 (2) (2008) 117–127. 10.1016/j.bandc.2008.04.008. [DOI] [PubMed] [Google Scholar]
- [11].Wang S, Zhang J, Zeng X, Zeng Y, Wang S, Chen S, Association of traffic-related air pollution with children’s neurobehavioral functions in Quanzhou, China, Environ. Health Perspect 117 (10) (2009) 1612–1618. 10.1289/ehp.0800023. [DOI] [PMC free article] [PubMed] [Google Scholar]
- [12].Mohai P, Kweon BS, Lee S, Ard K, Air pollution around schools is linked to poorer student health and academic performance, Health Aff. 30 (5) (2011) 852–862. 10.1377/hlthaff.2011.0077. [DOI] [PubMed] [Google Scholar]
- [13].U.S. Environmental Protection Agency, Residential Air Cleaners: a Technical Summary, The U.S. Environmental Protection Agency, Washington, DC, 2018. [Google Scholar]
- [14].Mattsson M, Hygge S, Effect of particulate air cleaning on perceived health and cognitive performance in school children during pollen season, in: Indoor Air 2005 Conference Proceedings, International Conference on Indoor Air Quality and Climate, Beijing, China, 2005, pp. 1111–1115. [Google Scholar]
- [15].Amato F, Rivas I, Viana M, Moreno T, Bouso L, Reche C, Alvarez-Pedrerol M, Alastuey A, Sunyer J, Querol X, Sources of indoor and outdoor PM2.5 concentrations in primary schools, Sci. Total Environ 490 (2014) 757–765. 10.1016/j.scitotenv.2014.05.051. [DOI] [PubMed] [Google Scholar]
- [16].Park JE, Installation of air cleaners in Korean schools. http://www.mdtoday.co.kr/mdtoday/index.html?no=348132, 2019.
- [17].GRIMM Aerosol Technik, Portable Laser Aerosol Spectrometer and Dust Monitor, Model 1.108/1.109, GRIMM Aerosol Technik GmbH&Co; KG, Ainring, Germany, 2010. [Google Scholar]
- [18].Sauerbrei W, Royston P, Binder H, Selection of important variables and determination of functional form for continuous predictors in multivariable model building, Stat. Med 26 (30) (2007) 5512–5528. 10.1002/sim.3148. [DOI] [PubMed] [Google Scholar]
- [19].Barn P, Larson T, Noullett M, Kennedy S, Copes R, Brauer M, Infiltration of forest fire and residential wood smoke: an evaluation of air cleaner effectiveness, J. Expo. Sci. Environ. Epidemiol 18 (5) (2008) 503–511. 10.1038/sj.jes.7500640. [DOI] [PubMed] [Google Scholar]
- [20].Cox J, Isiugo K, Ryan P, Grinshpun SA, Yermakov M, Desmond C, Jandarov R, Vesper S, Ross J, Chillrud S, Dannemiller K, Reponen T, Effectiveness of a portable air cleaner in removing aerosol particles in homes close to highways, Indoor Air 28 (6) (2018) 818–827. 10.1111/ina.12502. [DOI] [PMC free article] [PubMed] [Google Scholar]
- [21].Blondeau P, Iordache V, Poupard O, Genin D, Allard F, Relationship between outdoor and indoor air quality in eight French schools, Indoor Air 15 (1) (2005) 2–12. 10.1111/j.1600-0668.2004.00263.x. [DOI] [PubMed] [Google Scholar]
- [22].Ma H, Shen H, Shui T, Li Q, Zhou L, Experimental study on ultrafine particle removal performance of portable air cleaners with different filters in an office room, Int. J. Environ. Res. Public Health 13 (1) (2016). 10.3390/ijerph13010102. [DOI] [PMC free article] [PubMed] [Google Scholar]
- [23].Croxford B, Tham KW, Young A, Oreszczyn T, Wyon D, A study of local electrostatic filtration and main pre-filtration on airborne and surface dust levels in air-conditioned office premises, Indoor Air 10 (3) (2000) 170–177. 10.1034/j.1600-0668.2000.010003170.x. [DOI] [PubMed] [Google Scholar]
- [24].Rosen KG, Richardson G, Would removing indoor air particulates in children’s environments reduce rate of absenteeism–a hypothesis, Sci. Total Environ 234 (1–3) (1999) 87–93. 10.1016/S0048-9697(99)00266-1. [DOI] [PubMed] [Google Scholar]
- [25].Oh H, Nam I, Yun H, Kim J, Yang J, Sohn J, Characterization of indoor air quality and efficiency of air purifier in childcare centers, Korea, Build. Environ 82 (2014) 203–214. 10.1016/j.buildenv.2014.08.019. [DOI] [Google Scholar]
- [26].Wargocki PW, D.P., Lynge-Jensen K, Bornehag C, The effects of electrostatic particle filtration and supply-air filter condition in classrooms on the performance of schoolwork by children (RP-1257) C R Res. 14 (2008) 327–344. [Google Scholar]
- [27].Raysoni AU, Armijos RX, Weigel MM, Montoya T, Eschanique P, Racines M, Li WW, Assessment of indoor and outdoor PM species at schools and residences in a high-altitude Ecuadorian urban center, Environ. Pollut 214 (2016) 668–679. 10.1016/j.envpol.2016.04.085. [DOI] [PMC free article] [PubMed] [Google Scholar]
- [28].Branis M, Rezacova P, Domasova M, The effect of outdoor air and indoor human activity on mass concentrations of PM10, PM2.5, and PM1 in a classroom, Environ. Res 99 (2) (2005) 143–149. 10.1016/j.envres.2004.12.001. [DOI] [PubMed] [Google Scholar]
- [29].Alves CN, Nunes T, Silva J, Duarte M, Comfort parameters and particulate matter (PM10 and PM2.5) in school classrooms and outdoor air, Aerosol Air Qual. Res 13 (2013) 1521–1535. 10.4209/aaqr.2012.11.0321. [DOI] [Google Scholar]
- [30].Annesi-Maesano I, Hulin M, Lavaud F, Raherison C, Kopferschmitt C, de Blay F, Charpin DA, Denis C, Poor air quality in classrooms related to asthma and rhinitis in primary schoolchildren of the French 6 Cities Study, Thorax 67 (8) (2012) 682–688. 10.1136/thoraxjnl-2011-200391. [DOI] [PMC free article] [PubMed] [Google Scholar]
- [31].Canha N, Mandin C, Ramalho O, Wyart G, Riberon J, Dassonville C, Hanninen O, Almeida SM, Derbez M, Assessment of ventilation and indoor air pollutants in nursery and elementary schools in France, Indoor Air 26 (3) (2016) 350–365. 10.1111/ina.12222. [DOI] [PubMed] [Google Scholar]
- [32].Fromme HT, D., Dietrich S, Heitmann D, Schierl R, Liebl B, Ruden H, Particulate matter in the indoor air of classrooms-exploratory results from Munich and surrounding area, Atmos. Environ 41 (2007) 854–866. 10.1016/j.atmosenv.2006.08.053. [DOI] [Google Scholar]
- [33].John K, Karnae S, Crist K, Kim M, Kulkarni A, Analysis of trace elements and ions in ambient fine particulate matter at three elementary schools in Ohio, J. Air Waste Manag. Assoc 57 (4) (2007) 394–406. 10.3155/1047-3289.57.4.394. [DOI] [PubMed] [Google Scholar]
- [34].Zuraimi MS, Tham KW, Chew FT, Ooi PL, The effect of ventilation strategies of child care centers on indoor air quality and respiratory health of children in Singapore, Indoor Air 17 (4) (2007) 317–327. 10.1111/j.1600-0668.2007.00480.x. [DOI] [PubMed] [Google Scholar]
- [35].Rivas I, Viana M, Moreno T, Pandolfi M, Amato F, Reche C, Bouso L, Alvarez-Pedrerol M, Alastuey A, Sunyer J, Querol X, Child exposure to indoor and outdoor air pollutants in schools in Barcelona, Spain, Environ. Int 69 (2014) 200–212. 10.1016/j.envint.2014.04.009. [DOI] [PubMed] [Google Scholar]
- [36].Korea Ministry of Environment, Korea indoor air quality management Act. http://www.law.go.kr/, 2019. Accessed March 30 2019. [Google Scholar]
- [37].Annesi-Maesano I, Baiz N, Banerjee S, Rudnai P, Rive S, Group S, Indoor air quality and sources in schools and related health effects, J. Toxicol. Environ. Health B Crit. Rev 16 (8) (2013) 491–550. 10.1080/10937404.2013.853609. [DOI] [PubMed] [Google Scholar]
- [38].Korea Ministry of Education, Korea public health Act for schools. http://www.law.go.kr/LSW/nwRvsLsInfoR.do?lsiSeq=202935, 2018. Accessed March 30 2019. [Google Scholar]
- [39].Koren Ministry of Environment, Indoor Air Quality Guideline, Korean Ministry of Environment, Seoul, South Korea, 2014. [Google Scholar]
- [40].Parker JL, Larson RR, Eskelson E, Wood EM, Veranth JM, Particle size distribution and composition in a mechanically ventilated school building during air pollution episodes, Indoor Air 18 (5) (2008) 386–393. 10.1111/j.1600-0668.2008.00539.x. [DOI] [PubMed] [Google Scholar]
- [41].Sousan S, Koehler K, Hallett L, Peters TM, Evaluation of the alphasense optical particle counter (OPC-N2) and the Grimm portable aerosol spectrometer (PAS-1.108), Aerosol Sci. Technol 50 (12) (2016) 1352–1365. 10.1080/02786826.2016.1232859. [DOI] [PMC free article] [PubMed] [Google Scholar]
- [42].Peters TM, Ott D, O’Shaughnessy PT, Comparison of the Grimm 1.108 and 1.109 portable aerosol spectrometer to the TSI 3321 aerodynamic particle sizer for dry particles, Ann. Occup. Hyg 50 (8) (2006) 843–850. 10.1093/annhyg/mel067. [DOI] [PubMed] [Google Scholar]