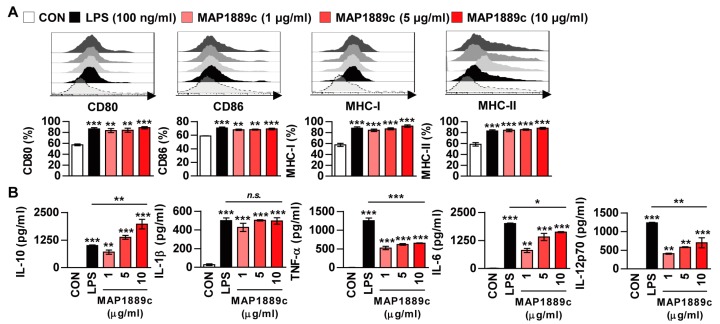
Figure 3.
MAP1889c induces BMDC maturation and high levels of IL-10 production. The BMDCs were stimulated with MAP1889c (1, 5, or 10 μg/mL) and LPS, 100 ng/mL for 24 h. (A) The expressions of surface markers were analyzed by two-color flow cytometry. The cells were gated to exclude CD11c+ cells. BMDCs were stained with anti-CD80, anti-CD86, anti-major histocompatibility complex (MHC) class I, or anti-MHC class II antibodies. The histograms are representative of five experiments. The bar graphs show the percentage (mean ± SD of five experiments) for each surface molecule on CD11c+ cells. (B) Interleukin (IL)-10, IL-1β, tumor necrosis factor (TNF)-α, IL-6, and IL-12p70 cytokines from the culture supernatants were measured by enzyme-linked immunosorbent assay (ELISA). All data are expressed as the mean ± SD (n = 3). All data are expressed as the mean ± SD (n = 3). * p < 0.05, ** p < 0.01, and *** p < 0.001 for treatment compared with untreated controls (CON) or for the difference between treatment data.

