

Abstract

Concrete structures in the sewer are corroded by sulfuric acid solution resulted from the actions of microorganisms in a sewer environment. Many reports pointed out that it can shorten the service life of concrete sewer networks from 10 to 50 years. Isolation of sulfuric acid solution from the surface of the sewerage concrete structures by using a polymer lining is effective corrosion protection. This study presents the preparation of a silica–epoxy nanocomposite material used for this lining purpose. Diffusion behavior, the cohesion of the lining on the concrete surface under the severer conditions, was investigated. Dispersion and distribution of the nanoparticles in the epoxy matrix confirmed by scanning electron microscopy (SEM) and X-ray diffraction analysis contribute to the enhancement of the lining’s barrier properties to water and to H2SO4 acid solution at different temperatures. An improvement of cohesion between the concrete and the nanocomposite lining was found. The nanocomposite lining remained cohesive on a concrete substrate almost two times longer than the neat lining when they were exposed to the 10.0 wt % H2SO4 acid solution at both 40 and 60 °C. The energy-dispersive system combined SEM analysis results of the pulled-off linings confirmed that the corrosion of the concrete interfaces is because of H2SO4 acid. It contributes to the adhesion loss of the lining. Thus, loaded nanosilica particles into epoxy enhance barrier properties, bond strength, and longevity of the service life of the sewerage concrete structure.
Introduction
Concrete is the most widely used construction material in the sewer network structure of urban infrastructure because of its compatibility with the environment, cost-effectiveness, and ease of production.1 In Germany alone, the concrete material accounted for 46% of the material structure used for sewer network.2 However, this material can be corroded by hydrogen sulfide (H2S) resulting from the action of microorganisms in the wastewater and shorten the life of the sewer concrete structures. Under severe corrosion of hydrogen sulfide, the service life of sewer concrete can reduce to ess than 10 years from the expected life of 50 to 100 years.3 The corrosion rate of sewer pipes is in the range of 1–10 mm/year.4 This corrosion leads to the loss of concrete volume, cracking of sewers, and even the collapse of the structure.4−9 Sewer systems suffering from corrosion often require premature replacement or rehabilitation of damaged pipes, manholes, and pump stations, which involves very high costs. Replacement and rehabilitation of sewers are estimated to cost several billion dollars a year globally.10,11 H2S is formed by sulfate-reducing bacteria in the anaerobic sewer biofilms/sediments. From the sewage, H2S is emitted to the sewer air, absorbed/adsorbed into the moist layer on the concrete walls exposed to air, at which it is oxidized to sulfuric acid by the activity of sulfide-oxidizing bacteria and causes corrosion.12Figure 1 shows the schematic of the corrosion process within the sewer. H2S is ubiquitous in sewer systems, although the concentrations differ temporally and spatially from a few ppm (parts per million) to several hundred ppm.13,14
Figure 1.

Schematic of the corrosion process within the sewer.
Current strategies for controlling sewer corrosion are focused on the following: (i) prevent H2S production and its partition from the sewer liquid phase through the dosing of antimicrobials, iron salts, pH elevating compounds, and oxidants (i.e., oxygen and nitrate) to the sewage; (ii) reduce the H2S concentration in sewer air through forced ventilation; (iii) applying the surface treatment on concrete sewers.15 Corrosion-resistant materials such as antimicrobials, silver-loaded zeolite, and polymers coatings are widely used to mitigate the corrosion of sewers.16−19
Isolating H2SO4 in-contact to concrete by the application of polymeric lining on the surface concrete sewer is an effective solution to mitigate the corrosion. The polymeric lining materials require to have good barrier properties, great significant chemical resistance, and remain to adhere to the concrete in the presence of corrosive components. Therefore, to prevent the corrosion of sewer concrete, many efforts have been taken to develop effective polymeric linings.20−23 Among several factors affecting the life expectation of the lining system, the diffusion rate or permeation rate of the environment components through the lining is the most significant. The permeability/diffusivity of a lining is affected by the film thickness. Thicker films are generally less permeable and therefore more resistant to the corrosive environment.24 However, lining pull-off due to the long length of the sewer network should also be considered. Many reports pointed out that for epoxy and polyurethane materials used, the effective thickness could be only in the range of 0.30–3.5 mm.25−28
Epoxy resin has been widely used in corrosion protection because of its good adhesive property and chemical durability. In the uncured state, this resin has low viscosity, therefore, it can be lined on the concrete structure without the use of high-pressure equipment. However, in comparison to other polymers, epoxy is more permeable to sulfuric acid. To overcome this weak point, a nanoscale dispersion of inorganic nanoparticle into epoxy continuous phase may improve its barrier property, especially for sulfuric acid solution and moisture. The addition of nanoparticles has exhibited a high potential for proven mechanical properties of polymers. Battistella et al. obtained an increase of 54% of fracture toughness by filling an epoxy resin with 0.5 vol % of fuming silica modified with 3-aminopropyl tri methoxy silane.29 Another study found that adding 10 wt % of TiO2 nanoparticles within epoxy resin increased fracture toughness by a considerable percentage.30 A study conducted by Hussain et al. showed that an increase of 47% of the tensile modulus takes place when an epoxy filling with 5 wt % of nanoclay is carried out.31 Maximum tensile strength and Young’s modulus resulting in 5 wt % of cup-stacked carbon nanotubes filling in epoxy.32 Rajulu et al. used epoxy and polyester as coating materials and observed that alkali-treated epoxy and polyester-coated fibers showed an increase of 55 and 88% in tensile strength, respectively, over the uncoated fibers.33
When an epoxy–silica nanocomposite lining is exposed to the environment for a long time, degradation processes such as chemical degradation, reduction of mechanical properties, and so forth may occur. The penetration of environmental components into a polymer composite are influenced by the composite’s characteristics such as the density, the order of pore, defects, or contamination, and the polymer-environment affinity.34,35
The high order absorption of water or exposed environmental penetrant is the major disadvantage of the lined layer. Furthermore, the absorbed water is considered as the main factor in the degradation of the functional, structural, and mechanical properties of the composites.36−38 Therefore, understanding of the diffusion behavior of water in particular epoxy–silica nanocomposite systems is needed for the application in the material lining/coating industry (Figure 2).
Figure 2.

Image of the inner sewage concrete pipeline lined by epoxy.
This study reports our findings on the development of a SiO2/epoxy nanocomposite lining material in an application for the anticorrosion of concrete structures in the sewer.
Technical Background
An enormous number of studies related to various applications of the diffusion equation is presented for describing the transport of penetrant molecules through the polymeric membranes or kinetics of sorption/desorption of the penetrant in/from the polymer bulk. The mass transfer in the former systems, after a short time, goes to be steady-state, and in the later systems, all the time, is under the unsteady state situation. The first and the second Fick’s laws are the basic formulae to model both kinds of systems, respectively.39 The first law governs the steady-state diffusion circumstance without convection, as given by eq 1.
| 1 |
where J is the flux, which gives the quantity of penetrant diffusing across a unit area of medium per unit time and has units of mol cm–2 s –1, D the diffusion coefficient, c the concentration, x the distance, and ∂c/∂x is called the gradient of the concentration along the axis. If J and c are both expressed in terms of the same unit of quantity, for example, gram, then D is independent of the unit and has a unit of cm2 s–1. Equation 1 is the starting point of numerous models of diffusion in polymer systems. The first law can only be directly applied to diffusion in the steady-state, where concentration is not varying with time.40 A simple schematic representation of the concentration profile of the penetrant during the diffusion process between two boundaries is shown in Figure 3a. Under unsteady-state circumstances, at which the penetrant accumulates in a certain element of the system, Fick’s second law describes the diffusion process as given by eq 2.39,40
| 2 |
Figure 3.

Concentration profile under (a) steady-state and (b) unsteady-state condition.
Equation 2 stands for the concentration change of penetrant at certain elements of the system with respect to the time (t), for one-dimensional diffusion, say in the x-direction. The diffusion coefficient, D, is available after the appropriate mathematical treatment of kinetic data. A well-known solution was developed by Crank, at which it is more suitable to moderate and longtime approximation.41 Sorption kinetics is one of the most common experimental techniques to study the diffusion of small molecules in polymers. In this technique, a polymer film of thickness 2l is immersed into the infinite bath of penetrant, then concentrations, ct, at any spot within the film at time t is given by eq 3.40
| 3 |
where c∞ is the amount of accumulated penetrant at equilibrium, that is, the saturation equilibrium concentration within the system. L = 2l is the distance between two boundaries layers, x0 and x1 (see Figure 3b).
Integrating eq 3 yields eq 4 that gives the mass of sorption penetrant by the film as a function of time t, Mt, and compared with the equilibrium mass, M∞.
| 4 |
For the processes, which take place at short times, eq 4 can be written, for a thickness of L = 2l, as
| 5 |
Plotting the Mt/M∞ as a function of t1/2, the diffusion coefficient can be determined from the linear portion of the curve. Using eq 5 instead of eq 4, the error is in the range of 0.1% when the ratio of Mt/M∞ is lower than 0.5.42
In the case of long-time diffusion, by which there may be limited data at Mt/M∞ < 0.5, eq 4 can be written as follow
| 6 |
Equation 6 is usually used in the form of eq 7, as given following
| 7 |
This estimation also shows a similarly negligible error on the order of 0.1%.42
The steady-state and unsteady-state diffusion of small molecules through the polymer system was developed mathematically, considering the basic assumption of Fickian diffusion. However, there are cases where diffusion is nonickian. Considering a simple type of experiment, a piece of the polymer film is exposed to the penetrant liquid phase or the vapor atmosphere. According to the second Fick’s law, the basic equation of mass uptake by the polymer film can be given by eq 8.43
| 8 |
where the exponent n is called the type of diffusion mechanism and k is a constant, which depends on diffusion coefficient and thickness of the film.
Fickian diffusion (case I) is often observed in the polymer systems when the temperature is well above the glass transition temperature of the polymer (Tg). Therefore, it expects that the Mt/M∞ is proportional to the square-root of time, that is, n = 05. Other mechanisms have been established for the diffusion phenomenon and categorized based on the exponent n, as follow44
n > 1 super case II
n = 1 case II
1 > n > 0.5 anomalous
0.5 > n pseudo-Fickian
Case II diffusion is the second most important mechanism of diffusion for the polymer. This is a process of moving boundaries and linear sorption kinetics, which is opposed to Fickian. A sharp penetration front is observed, by which it advances at a constant rate. More detailed features of the process, as induction period and front acceleration in the latter stage, have been reported in the literatures.45 An exponent between 1 and 0.5 signifies anomalous diffusion. Case II and anomalous diffusion are usually observed for the polymer whose glass transition temperature is higher than the experimental temperature. The main difference between these two diffusion modes concerns the solvent diffusion rate.46
The high order absorption of water or exposed environmental penetrant is a major disadvantage of the lined layer. Furthermore, the absorbed water is considered as the main factor that resulted in the degradation of functional, structural, and mechanical properties of the composites.36−38 Therefore, understanding of the diffusion behavior of water in a particular epoxy–silica nanocomposite system is needed for the application of the material lining/coating industry.
Results and Discussion
The test pieces and the lining specimens formed from the unfilled (neat) amine-cured epoxy and the 3.0 phr SiO2 nanoparticle-filled amine-cured epoxy named as EPS-0 and EPS-3, respectively.
Incorporation of the SiO2 Nanoparticle
The X-ray diffraction (XRD) patterns of the EPS-0 and EPS-3 is shown in Figure 4. The broad peak in a range of 15–20° contributes to the amorphous nature of the epoxy, whereas the diffraction peak at 2θ = 27.44° found in EPS-3 corresponds to the crystalline nature of SiO2 particles. This can imply that the silica nanofillers well-embedded in the epoxy matrix.
Figure 4.

XRD patterns of the samples.
However, the distribution of fillers in the matrix base plays an important role in barrier properties because it influences on the formation of micro-void or free-volumes in the bulk composites. The smoother surface of the test piece cross-section of EPS-0 comparing to of the EPS-3 observed by the scanning electron microscopy (SEM) analysis (see Figure 5) represents the lower density of free-volumes and/or micro-voids in the unfilled samples than in the SiO2 nanoparticle-filled samples.
Figure 5.

Morphological analysis: (a) SEM image of EPS-0, (b) SEM image of EPS-3; (c) transmission electron microscopy image of ÉP-3.
Diffusion Properties
The mass change of the test piece to its initial weight was measured by immersion time and shown in Figures 6–9. The uptake increased linearly with increasing time at first, then leveled off for the EPS-0 immersed in deionized water and the 10 wt % H2SO4 acid solution at 40 and 60 °C. This was also observed for the EPS-3 pieces immersed in the 40 and 60 °C deionized water and the 10 wt % H2SO4 acid solution at 40 °C. However, the second stage of diffusion seems to have occurred after about 433 h of immersion in the 10 wt % H2SO4 acid solution at 60 °C for the EPS-3 test pieces. When the uptake was not time-dependent, the test pieces were saturated. By applying eq 6, diffusion coefficients of the water and the 10 wt % H2SO4 acid solution at different temperatures are estimated (Table 1). Diffusion of water and the 10 wt % H2SO4 acid solution into the EPS-0 and EPS-3 was then classified by applied eq 8. Fickian curves are superimposed in these figures.
Figure 6.

Mass change vs time of the neat and epoxy–silica nanocomposite exposure of deionized water at 40 °C.
Figure 9.

Mass change vs time of the neat and epoxy–silica nanocomposite exposure of the 10 wt % H2SO4 acid solution at 60 °C.
Table 1. Diffusion Parameters Into the Polymers.
| in water |
in the 10 wt % H2SO4 solution |
|||||
|---|---|---|---|---|---|---|
| sample | saturation value (%) | saturation time (h) | 1st diffusivity, 10–4 (mm2 h–1) | saturation value (%) | saturation time (h) | 1st diffusivity, 10–4 (mm2 h–1) |
| At 40 °C | ||||||
| EPS-0 | 2.65 | 403 | 5.11 | 15.56 | 259 | 6.77 |
| EPS-3 | 2.80 | 1438 | 1.47 | 16.77 | 937 | 2.36 |
| At 60 °C | ||||||
| EPS-0 | 16.03 | 342 | 5.99 | 22.72 | 238 | 8.27 |
| EPS-3 | 16.91 | 929 | 2.48 | 24.87 | 528 | 4.54 |
Figure 7.

Mass change vs time of the neat and epoxy–silica nanocomposite exposure of deionized water at 60 °C.
Figure 8.

Mass change vs time of the neat and epoxy–silica nanocomposite exposure of the 10 wt % H2SO4 acid solution at 40 °C.
The presence of incorporated SiO2 nanoparticles in the epoxy matrix improved its barrier properties to water and the 10 wt % H2SO4 acid solution. Immersion in the 40 and 60 °C deionized water, the time needed to attain the saturation of the EPS-3 (1438 and 937 h) was longer than of the EPS-0 (403 and 259 h). The rate of the 40 and of the 60 °C water diffusion in the EPS-3 test pieces was only 1.47 and 2.48 mm2 h–1, respectively, whereas in the EPS-0 test pieces it was 5.11 and 5.99 mm2 h–1. This enhancement was also observed for immersion in the 10 wt % H2SO4 acid solution (see Table 1). As discussed in several studies,47−49 environment molecules after being diffused in the polymer occupied in micro-voids, form clusters. When all micro-voids and free-volumes were filled by the diffused molecules, the saturation is attained. For the EPS-3 samples, SiO2 nanoparticles filled in the amine-cured epoxy matrix may be under two forms: distribution as fillers and dispersion in terms of inter intercalation and exfoliation. The distribution could increase numbers of micro-voids and free volumes (shown by SEM analysis in Figure 5) while dispersion could form intercalation and/or exfoliation. The former resulted in a higher order of saturation while the latter caused the low diffusion rate for the ESP-3. The density and size of free-volumes and/or micro-voids, pores in the polymer may increase because of heat relaxation and of epoxy’s affinity to the nature of the immersion solution. Thus, the diffusion rate and the saturation degree for each polymer increased with an increase of temperature and with the 10 wt % H2SO4 acid solution instead of deionized water (see Table 1).
Penetration Depth of H2SO4
The energy-dispersive system (EDS) combined with SEM analysis on the cross-section of the immersed pieces showed that the sulfuric acid penetrated uniformly into the polymers (Figure 10).
Figure 10.

EDS pattern of the penetrated H2SO4 layer in the polymer.
By this observation, the penetration depth was measured. Figures 11 and 12 presents the penetration depth of H2SO4 plotted with root immersion time. It can be seen that the depth is proportional to the square root of immersion time, therefore the penetration rate, λ, can be defined by the slope between the penetration depth and square root of immersion time. The results showed that the barrier feature of the silica nanocomposite is better than those of the neat epoxy polymer at both 40 and 60 °C. This result is consistent with the results discussed above.
Figure 11.

Penetration depth of H2SO4 vs immersion time of the neat and the epoxy-nanocomposites immersion in the 10 wt % H2SO4 acid solution at 40 °C.
Figure 12.

Penetration depth of H2SO4 vs immersion time of the neat and the epoxy-nanocomposites immersion in the 10 wt % H2SO4 acid solution at 60 °C.
Degradation of Bond Strength
Figure 13 shows the relationship between average bond strength and the square root of time for the specimens exposed to the 10 wt % H2SO4 acid solution at 40 and 60 °C. The results show that the degradation behavior of bond strength consists of the remaining stage and the reduction stage. An enhancement of the bond strength for the EPS-3 lining specimens comparing to the EPS-0 specimens was observed. The initial bond strength of the EPS-3 specimens was about 3.37 MPa, about 20% higher than those of the EPS-0 lining specimens.
Figure 13.

Adhesion behavior of lined epoxy and epoxy–silica nanocomposite lined on the concrete substrate exposure of the 10 wt % H2SO4 solution.
During exposure to the H2SO4 acid solution, even though results are scattered, there was no obvious reduction in bond strength up to the saturation time, indicating the lining is a well barrier to the solution. The bond strength of the EPS-3 lining remained up 18 and 11 months exposure to the 10 wt % H2SO4 acid solution at 40 and 60 °C, respectively, while the EPS-0 lining remained only 4.2 and 2.5 months. Thus, the presence of the incorporated SiO2 nanoparticles in the epoxy matrix improved the bond strength on concrete and longevity of the lining service life.
Figure 14 shows the failure modes of the pull-off test at the reduction stage for both lining systems. The failure mode’s change may be due to the effect of the corrosion of the interface by the penetrated solutions. The EDS-combined SEM analysis was conducted to tracing sulfur elements on the pull-off face of the lining. The results show that the penetrated sulfur elements presented on the interfaces, for example, the loss of adhesion was due to the corrosion of the interface caused by a reaction of the accumulated H2SO4 with the minerals of concrete at the interface.
Figure 14.

Demonstrate of failure modes.
Conclusions
The SiO2–epoxy nanocomposite lining was prepared using a 3.0 phr of nanosilica particles. Dispersion and distribution of the nanoparticles in the epoxy matrix confirmed by SEM and XRD analysis contributes to the enhancement of the lining’s barrier properties to water and to H2SO4 acid solution at different temperatures. An improvement of cohesion between the concrete and the nanocomposite lining was found. The nanocomposite lining remained cohesive on the concrete substrate and became almost two times longer than the neat lining when they were exposed to the 10.0 wt % H2SO4 acid solution at both 40 and 60 °C. The EDS-combined SEM analysis results of the pulled-off linings confirmed the corrosion of concrete interfacial by H2SO4 acid. It contributes to the adhesion loss of the lining. Thus, loading nanosilica particles into epoxy enhances barrier properties, bond strength, and longevity of the service life of th sewerage concrete structure.
Experimental Details
Materials
Nanosilica fillers branded Aerosil R812 from Evonik having an average diameter of 7 nm, a specific area of 260 m2/g, and purity >99.8%. The surface of this material was modified with hexamethyldisilazane. The epoxy matrix was a mixture of a diglycidyl ether of bisphenol F (DGEBF) epoxy resin (EPOKUDO YDF-175, Kukdo Chemical), having an equivalent mass of 160–180 (grams of resin containing 1 g equivalent of epoxide) and a polyetheramine curing agent (Jeffamine D230, Huntsman Corporation). The solvent used for nanocomposite processing was reagent grade toluene (Aldrich) with purity >99.5% (Figure 15).
Figure 15.

EDS analysis image of the sulfur elements on the debonded surface of the lining.
Immersion Test Piece Preparation
Free-standing nanocomposite sheets having a thickness of 1.0 mm of the 15 phr (parts per hundred epoxy resin) amine-cured epoxy polymer containing 3.0 phr of SiO2 nanofillers were prepared following the steps shown in Figure 16. The SiO2 nanofillers were first sonicated in a large amount of toluene for 30 min using an 80 kHz tip sonicator. After adding epoxy resin, the nanofiller suspension was ultra-sonicated by a magnetic stirrer at a speed of 2500 rpm for 1 h. The amine curing agent was then added to the suspension. Unfilled (neat) epoxy films having similar thickness were also prepared for comparison by mixing 15 phr amine curing agent and epoxy resin. The mixture was stirred and sonicated continuously for another hour. After the mixing step, both the nanosilica-free and epoxy–nanosilica mixture was degassed for 1 h at room temperature, then drawn down on a polyethylene terephthalate mold to form sheets. The sheets were cured under ambient conditions (24 °C and 75% relative humidity approximately) for 72 h followed by postcuring for 4 h at 110 °C in an air circulating oven. The test pieces having dimensions of 60 × 25 × 1.0 mm were cut out from the prepared sheets, then dried up at 50 °C for 72 h to ensure that the remaining moisture/gas was removed before being used for the immersion test.
Figure 16.

Steps used to prepare epoxy–silica nanocomposite linings and films.
Lining Specimen Preparation
The concrete substrates were cast from mix design (Table 2) prepared in compliance with the Vietnamese Standard.50 The substrate’s side length and thickness are 150 mm × 150 mm × 50 mm.
Table 2. Concrete Mix Design and Properties.
| constituentsc, (kg m–3) |
||||||||
|---|---|---|---|---|---|---|---|---|
| aggregates | superplasticizer | compressive strength, (MPa) | ||||||
| W/Ca | cementb | crushed aggregate (max. 10 mm) | crushed manufactured sand | natural river sand | natural fine sand | total | ||
| 0.42 | 415 | 748 | 372 | 478 | 287 | 1885 | 4.2 | 62 |
Water/cement mass ratio.
Constituents are given as the mass ratio needed to form 1 m3 of concrete.
Vietnamese standard Portland cement (PCB40).
The substrates were cured in moist air for 24 h and then cured in lime-saturated water for 28 days. After curing, the substrates were dried in an oven at 60 °C for 7 days to achieve a similar and stable initial water content.51 The front surface of the substrates was prepared by disk grinding. An image of the substrate’s surface preparation before and after applying disk grinding is shown in Figure 17. The degassed mixtures (prepared in the same manner as the sheet-forming pattern) drawn down on the ground surfaces to form the lining specimens. The lining specimens then were cured under ambient conditions (24 °C and 75% relative humidity approximately) for 72 h followed by postcuring for 4 h at 110 °C in an air circulating oven. Thickness of the lining is 1.0 mm.
Figure 17.

Images of substrate’s surface preparation by disk grinding: (a) before; (b) after.
Immersion Test
The immersion experiment was carried out by simply immersing the test pieces in deionized water and in the 10 wt % H2SO4 acid solution. The test pieces were fixed in a polytetrafluoroethylene holder to avoid contact with the surface of each other and immersed in separable flash bottles filled with water. The temperature was constantly set at 40 and 60 °C. Figure 18 shows a schematic of the immersion test apparatus.
Figure 18.

(a) Schematic of the immersion test apparatus; (b) image of test pieces before immersion.
At interval time, the test pieces were taken out, wiped by filter paper to remove attached immersed solutions on their surfaces, and then were investigated for the mass uptake.
Environment-Induced Adhesion Lost Test
The loose adhesion of the lining during exposure to water and the 10 wt % H2SO4 acid solution was carried out by using a fabricated apparatus (see Figure 19). The temperature of water and the 10 wt % H2SO4 acid solution was kept at 40 and 60 °C constantly. An interval time, the lining specimens were taken out to measure the lining adhesion by the pull-off test.
Figure 19.
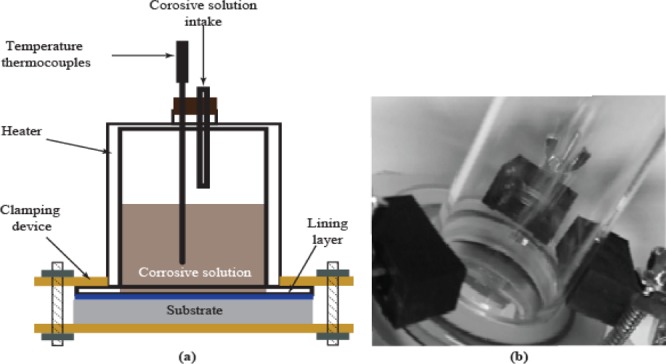
Illustration of: (a) schematic, (b) environment-induced adhesion lost apparatus.
Measurement
Mass change, the cross-section surface morphology, the penetration depth of sulfur elements, and the adhesion of the lining were studied. The mass change was determined using an analytical balance having a resolution of 10–5 g. The phase identification of incorporated SiO2 nanoparticles in epoxy matric was determined by an X-ray diffractometer (Shimadzu XRD-6100, Japan) using Cu Kα radiation = 1.5405 Å with scanning rate of 2° per min and 2 theta (2θ) angle range from 10 to 60° at current 30.0 mA and voltage 40.0 kV. The surface morphological changes and penetrated depth of sulfur elements into the test pieces were determined using an energy X-ray spectrometer applied on their cut-cross section surfaces. A JSM-5310LV (for SEM) combined with JED 2100 (for EDS) used for this measurement. The bond strength of the lining on the substrate was measured by a pull-off test in accordance with ASTM D-C158352 using an Elcometer F510S (Elcometer, UK) pull-off adhesion tester. Equation 9 was used to calculate the pull-off bond strength.
| 9 |
where Pfailure is the load at failure and A is the pull-off area.
Acknowledgments
The author is grateful to the Department of Science & Technology (Hanoi, Vietnam) for financial support (grant no. TC.03-2016-03).
The author declares no competing financial interest.
References
- Hvitved-Jacobsen T.; Vollertsen J.; Nielsen A. H.. Sewer Processes-Microbial and Chemical Process Engineering of Sewer Networks, 2nd ed.; CRC Press: London, 2013. [Google Scholar]
- Kaempfer W.; Berndt M.. In Polymer Modified Mortar with High Resistance to Acid and to Corrosion by Biogenous Sulphuric Acid; ICPIC Proceedings: Bologna, 1998.
- USEPA . Detection, Control, and Correction of Hydrogen Sulfide; Office of Wastewater Enforcement and Compliance: Washington, 1992. [Google Scholar]
- Zhang L.; De Schryver P.; De Gusseme B.; De Muynck W.; Boon N.; Verstraete W. Chemical and biological technologies for hydrogen sulfide emission control in sewer systems: a review. Water Res. 2008, 42, 1–12. 10.1016/j.watres.2007.07.013. [DOI] [PubMed] [Google Scholar]
- Davis J. L.; Nica D.; Shields K.; Roberts D. J. Analysis of concrete from corroded sewer pipe. Int. Biodeterior. Biodegrad. 1998, 42, 75–84. 10.1016/s0964-8305(98)00049-3. [DOI] [Google Scholar]
- Harrison A. P. The Acidophilic thiobacilli and other acidophilic bacteria that share their habitat. Annu. Rev. Microbiol. 1984, 38, 265–292. 10.1146/annurev.mi.38.100184.001405. [DOI] [PubMed] [Google Scholar]
- Islander R. L.; Devinny J. S.; Mansfeld F.; Postyn A.; Shih H. Microbial ecology of crown corrosion in sewers. J. Environ. Eng. 1991, 117, 751–770. 10.1061/(asce)0733-9372(1991)117:6(751). [DOI] [Google Scholar]
- Nica D.; Davis J. L.; Kirby L.; Zuo G.; Roberts D. J. Isolation and characterization of microorganisms involved in the biodeterioration of concrete in sewers. Int. Biodeterior. Biodegrad. 2000, 46, 61–68. 10.1016/s0964-8305(00)00064-0. [DOI] [Google Scholar]
- Parker C. D. Species of sulphur bacteria associated with the corrosion of concrete. Nature 1947, 159, 439–440. 10.1038/159439b0. [DOI] [PubMed] [Google Scholar]
- Jiang G.; Sun J.; Sharma K. R.; Yuan Z. Corrosion and odor management in sewer systems. Curr. Opin. Biotechnol. 2015, 33, 192–197. 10.1016/j.copbio.2015.03.007. [DOI] [PubMed] [Google Scholar]
- Sydney R.; Esfandi E.; Surapaneni S. Control concrete sewer corrosion via the crown spray process. Water Environ. Res. 1996, 68, 338–347. 10.2175/106143096x127785. [DOI] [Google Scholar]
- Li X.; Jiang G.; Kappler U.; Bond P. The ecology of acidophilic microorganisms. Front. Microbiol. 2017, 8, 683–700. 10.3389/fmicb.2017.00683. [DOI] [PMC free article] [PubMed] [Google Scholar]
- Jiang G.; Keller J.; Bond P. L. Determining the long-term effects of H2S concentration, relative humidity and air temperature on concrete sewer corrosion. Water Res. 2014, 65, 157–169. 10.1016/j.watres.2014.07.026. [DOI] [PubMed] [Google Scholar]
- Wells T.; Melchers R. E. Modelling concrete deterioration in sewers using theory and field observations. Cem. Concr. Res. 2015, 77, 82–96. 10.1016/j.cemconres.2015.07.003. [DOI] [Google Scholar]
- Jiang G.; Sun J.; Sharma K. R.; Yuan Z. Corrosion and odor management in sewer systems. Curr. Opin. Biotechnol. 2015a, 33, 192–197. 10.1016/j.copbio.2015.03.007. [DOI] [PubMed] [Google Scholar]
- Berndt M. L. Evaluation of coatings, mortars and mix design for protection of concrete against sulphur oxidising bacteria. Constr. Build. Mater. 2011, 25, 3893–3902. 10.1016/j.conbuildmat.2011.04.014. [DOI] [Google Scholar]
- De Muynck W.; De Belie N.; Verstraete W. Effectiveness of admixtures, surface treatments and antimicrobial compounds against biogenic sulfuric acid corrosion of concrete. Cem. Concr. Res. 2009, 31, 163–170. 10.1016/j.cemconcomp.2008.12.004. [DOI] [Google Scholar]
- Haile T.; Nakhla G. The inhibitory effect of antimicrobial zeolite on the biofilm of Acidithiobacillus thiooxidans. Biodegradation 2010, 21, 123–134. 10.1007/s10532-009-9287-6. [DOI] [PubMed] [Google Scholar]
- Sun X.; Jiang G.; Bond P. L.; Keller J.; Yuan Z. A novel and simple treatment for control of sulfide induced sewer concrete corrosion using free nitrous acid. Water Res. 2015, 70, 279–287. 10.1016/j.watres.2014.12.020. [DOI] [PubMed] [Google Scholar]
- Kubouchi M.Evaluation method of degradation of anti-corrosion epoxy lining for concrete structures. In Third International Conference on Sustainable Constructions Material and Technology, Kyoto, 2013.
- Masuda Y.; Toyama K.; Uno Y.; Mochida M.; Sakai T.; Kubouchi M.; Tanaka Y.. Effect of stress on penetration behaviour of sulfuric acid into epoxy resin. In The 45th Annual Conference Sewage, Osaka, Japan, 2008.
- Masuda Y.; Toyama K.; Uno Y.; Mochida M.; Sakai T.; Kubouchi M.; Tanaka Y.. In Life-Estimation on Epoxy Lining for Concrete Structure Used in Sewage and Waste Water Plant, Osaka, Japan, 2009.
- Nakamoto I. Study on the Chemical Corrosion of Concrete structure in Sewerage Facilities. J. Mater. Concr. Struct. Pavement 2002, 20, 472. [Google Scholar]
- Greenfield T. K. Specifying coatings for concrete surfaces. J. Material Perfor. 1994, 33, 37–41. [Google Scholar]
- Chattopadhyay D. K.; Raju K. V. S. N. Structural engineering of polyurethane coating for high performance applications. Prog. Polym. Sci. 2007, 32, 352–418. 10.1016/j.progpolymsci.2006.05.003. [DOI] [Google Scholar]
- Jie L.Performance of Coatings in Wastewater Systems and Verification with Analytical Models; University of Houston: Houston-USA, 2000. [Google Scholar]
- Shon M.; Kwon H. Comparison of surface modification with amino terminated polydi methylsiloxane and amino branched polydimethyl siloxane on the corrosion protection of epoxy coating. Corrosion Sci. 2009, 51, 650–657. 10.1016/j.corsci.2008.11.022. [DOI] [Google Scholar]
- Moukwa M.; Apicella F. Controlling metal corrosion with polymer coatings. J. Paint and Coatings Indus. 1996, 7, 209–215. [Google Scholar]
- Battistella M.; Cascione M.; Fiedler B.; Wichmann M. H. G.; Quaresimin M.; Schulte K. Fracture behavior of fumed silica/epoxy nanocomposites. Composites, Part A 2008, 39, 1851–1858. 10.1016/j.compositesa.2008.09.010. [DOI] [Google Scholar]
- Ragosta G.; Abbate M.; Musto P.; Scarinzi G.; Mascia L. Epoxy-silica particulate nanocomposites: chemical interactions, reinforcement and fracture toughness. Polymer 2005, 46, 10506–10516. 10.1016/j.polymer.2005.08.028. [DOI] [Google Scholar]
- Hussain F.; Chen J.; Hojjati M. Epoxy silicate nanocomposites: cure monitoring and characterization. J. Mater. Sci. Eng. A 2007, 445–446, 467–476. 10.1016/j.msea.2006.09.071. [DOI] [Google Scholar]
- Choi Y.-K.; Gotoh Y.; Sugimoto K.-i.; Song S.-M.; Yanagisawa T.; Endo M. Processing and characterization of epoxy nanocomposites reinforced by cup-stacked carbon nanotubes. Polymer 2005, 46, 11489–11498. 10.1016/j.polymer.2005.10.028. [DOI] [Google Scholar]
- Rajulu A. V.; Devi L. G.; Rao G. B.; Reddy R. L. Chemical resistance and tensile properties of epoxy/unsaturated polyester blend coated bamboo fibers. J. Reinf. Plast. Compos. 2003, 22, 1029–1034. 10.1177/0731684403024571. [DOI] [Google Scholar]
- Wong T. C.; Broutman L. J. Water in epoxy resins Part II. Diffusion mechanism. Polym. Eng. Sci. 1985, 25, 529–534. 10.1002/pen.760250904. [DOI] [Google Scholar]
- Moy P.; Karasz F. E. Epoxy-water interactions. Polym. Eng. Sci. 1980, 20, 315–319. 10.1002/pen.760200417. [DOI] [Google Scholar]
- Lee H.; Neville K.. Epoxy Resins, their Applications and Technology; McGaw-Hill: USA, 1957. [Google Scholar]
- Lu M. G.; Shim M. J.; Kim S. W. Effect of moisture on the properties of epoxy molding compound. J. Appl. Polym. Sci. 2001, 81, 2253–2259. 10.1002/app.1664. [DOI] [Google Scholar]
- Nunez L. M.; Villanueva M.; Fraga F.; Nunez M. R. Influence of water absorption on the mechanical properties of a DGEBA (n=0)/1,2 DCHepoxy system. J. Appl. Polym. Sci. 1999, 74, 353–358. . [DOI] [Google Scholar]
- Crank J.; Park G. S.. Diffusion in Polymer, 1st ed.; Academic Press: USA, 1968. [Google Scholar]
- Comyn J.Introduction to Polymer Permeability and the Mathematics of Diffusion. In Polymer Permeability; Comyn J., Ed.; Elsevier Applied Science: Northern Ireland, 1985; pp 1–10. [Google Scholar]
- Crank J.The Mathematics of Diffusion; Clarendon Press: Oxford, U.K., 1975. [Google Scholar]
- Vergnaud J. M.Liquid Transport Processes in Polymeric Materials. In Modeling and Industrial Applications; Prentice-Hall: USA, 1991; p 362. [Google Scholar]
- Massaro L.; Zhu X. X. Physical Models of Diffusion for Polymer Solutions, Gels and Solids. Prog. Polym. Sci. 1999, 24, 731–735. 10.1016/s0079-6700(99)00016-7. [DOI] [Google Scholar]
- Sperling L. H.Introduction to Physical Polymer Science, 2nd ed.; Wiley Interscience: USA, 2006. [Google Scholar]
- Windle A. H.Case II Sorption. In Polymer Permeability; Comyn J., Ed.; Elsevier Applied Science: Northern Ireland, 1985; pp 75–118. [Google Scholar]
- Alfey T.; Gurnee E. F.; Lloy W. G. Diffusion in glassy polymers. J. Polym. Sci., Part C: Polym. Symp. 1966, 12, 249–261. 10.1002/polc.5070120119. [DOI] [Google Scholar]
- Chau D. V. A study on water absorption and its effects on strength of nano organoclay-epoxy composites. J. Appl. Sci. 2012, 12, 1939–1945. 10.3923/jas.2012.1939.1945. [DOI] [Google Scholar]
- Abacha N.; Kubouchi M.; Sakai T. Diffusion behavior of water in polyamide 6 organoclay nanocomposites. eXPRESS Polym. Lett. 2009, 3, 245–255. 10.3144/expresspolymlett.2009.31. [DOI] [Google Scholar]
- Lan T.; Pinnavaia T. J. Clay-reinforced epoxy composites. Chem. Mater. 1994, 6, 2216–2219. 10.1021/cm00048a006. [DOI] [Google Scholar]
- TCVN9113, Reinforced Concrete Pipes for Water Draining; TCVN: Vietnam, 2012.
- Joseph A. P.; Keller J.; Bustamante H.; Bond P. L. Surface neutralization and H2S oxidation at early stages of sewer corrosion: influence of temperature, relative humidity and H2S concentration. Water Res. 2012, 46, 4235–4245. 10.1016/j.watres.2012.05.011. [DOI] [PubMed] [Google Scholar]
- ASTM . AC1583-13, Standard Test Method for Tensile Strength of Concrete Surfaces and the Bond Strength or Tensile Strength of Concrete Repair and Overlay Materials by Direct Tension (Pull-off Method); ASTM International: West Conshohocken, PA, USA, 2013. [Google Scholar]