

Abstract
Infectious diseases remain as an important public health threat to humans. Research into pathogens can be useful for planning an organized response to infectious diseases. Bibliometric analysis is an important method for scientific research and assessing capability. In this study, 100 pathogens of public health importance were selected, and the distributions of annual, national, institutional, and journal publications on Science Citation Index (SCI) journals were statistically analyzed. The United States of America ranked the first in terms of the number of relevant studies published. China attaches great importance to the prevention and control of infectious diseases, but still needs to improve in the following areas: for example, insufficient SCI reports on particular pathogens, institutions SCI reports on pathogens lower than world top pathogen research institutions, and lack of influential international pathogen-related journals. Scientific literature databases are important tools for science-of-science analysis. The findings of this study shed light on the hot spots and the ignored spots in pathogen researches, and thus would be useful for drawing a national and institutional research plan.
Keywords: Bibliometric analysis, Pathogens, Microorganisms, Parasites, Research, Biosafety, Biosecurity
Highlights
-
•
Scientific question
-
•
Scientific literature databases are important tools for science-of-science analysis, which can be referred as Science of the Science of biosafety/biosecurity (SSBS) in the field of biosafety and biosecurity.
-
•
Evidence before this study
-
•
In this study, we conducted a comprehensive literature analysis of pathogens, including health-threatening pathogens (HTPs) and biodefense-associated pathogens (BDAPs).
-
•
New findings
-
•
Our new findings indicated that some literature on pathogens, particularly BDAPs, showed a decrease followed by an increase. The total number of Science Citation Index reports on pathogens in China is the second highest in the world, but it is significantly behind the number of published studies in the United States. Particularly, SCI reports on BDAPs in China is insufficient, specifically at the university level.
-
•
Significance of this study
-
•
The findings of this study highlight the hot spots and ignored spots in pathogen research; therefore, can be helpful on drawing a national and institutional research plan.
1. Introduction
Living standards have continuously been improving on account of the rapid developments in science and technology. Although infectious diseases, in general, have become less common than other diseases such as cancer, cardiovascular disease, metabolic diseases, etc., the frequent genetic transformation of pathogens and the existence of antimicrobial-resistant pathogens are still issues that we have to face today.
During the last few decades, there have been significant advances in the treatment and prevention of infectious diseases, such as HIV, viral hepatitis, and tuberculosis. However, many new infectious diseases have emerged since the SARS epidemic in 2003, such as H5N1 and H7N9 avian influenza, Middle East Respiratory Syndrome, Ebola virus disease, Zika virus disease, Chikungunya virus disease, and the current Coronavirus Disease 2019 (COVID-19). Consequently, human beings are constantly facing the threat of new and re-emerging infectious diseases [1]. In addition to naturally occurring infectious diseases, another danger posed by pathogens is their potential use as biological weapons or in bioterrorism. Large-scale research and development of biological weapons were once carried out in some countries [2]. In 2001, the anthrax mail attack in the United States resulted in significant public panic. Therefore, in recent years, both the United States and United Kingdom have released biosecurity or biodefense national strategies for responding to such threats [3].
Pathogens are defined as microorganisms and parasites that cause infectious and parasitic diseases. At present, there are still many infectious diseases that do not have effective treatments. The development of diagnostic test kits, drugs, vaccines and other countermeasures needs to be based on the full understanding of the biological characteristics and pathogenic mechanisms of these infectious diseases.
Bibliometric analysis is an important method of scientific research assessment. Science-of-science analysis in the field of biosafety and biosecurity can be called Science of Science of biosafety/biosecurity (SSBS). Based on the statistical data of published studies on pathogens, it is possible to gain overall understanding of the worldwide pictures, such as the number of studies on pathogens, the research capability of different countries, the key research institutions, the major journals reporting studies on pathogens, and other parameters of research capability. It is then possible to know the research status, dominant areas, and major gaps, which are important for making strategic plans for scientific research. In the present bibliometric analysis, 100 species of pathogens of public health importance were selected, and the related published literatures were retrieved and statistically analyzed. The findings shed light on the hot spots and ignored spots in pathogen research and can be useful for drawing a national and institutional research plan.
2. Methods
An SCI literature search was performed in November 2018 by using Web of Science and the search scope of SCI-EXPANDED. We examined the titles and screened for article types. The names of pathogens, but not the names of the corresponding disease, were used for the search (Tables 1 –3). Use of the title as the search target can avoid those non-essential studies, but in the same time some studies may have been missed, when compared with the search results using abstracts as the search target. The main purpose of the study is to compare the studies from different years, countries, institutions, and journals, under the same search conditions.
Table 1.
Query key words and comparison by the number of published pathogen studies between China and the United States (bacterial pathogens only).
| Order | Pathogens | Abbreviation | Group* | Disease | Query | Article | Country-wise distribution | United States |
China |
||
|---|---|---|---|---|---|---|---|---|---|---|---|
| Sort | Quantity | Sort | Quantity | ||||||||
| 1 | Bacillus anthracis | B. anthracis | A | Anthrax | TI = “Bacillus anthracis” | 1,722 | 68 | 1 | 1,104 | 6 | 59 |
| 2 | Yersinia pestis | Y. pestis | A | Plague | TI = “Yersinia pestis” | 1,216 | 59 | 1 | 715 | 2 | 137 |
| 3 | Clostridium botulinum | C. botulinum | A | Botulinum | TI = “Clostridium botulinum” | 794 | 56 | 1 | 238 | 12 | 13 |
| 4 | Francisella tularensis | F. tularensis | A | Tularemia | TI = “Francisellatularensis” | 1,039 | 42 | 1 | 634 | 11 | 17 |
| 5 | Brucella spp. | Brucella | A | Brucellosis | TI=Brucella | 3,132 | 106 | 1 | 713 | 5 | 234 |
| 6 | Burkholderia mallei | B.mallei | A | Glanders | TI = “Burkholderia mallei” | 141 | 29 | 1 | 97 | 27 | 1 |
| 7 | Burkholderia pseudomallei | B. pseudomallei | A | Melioidosis | TI = “Burkholderiapseudomallei” | 1,041 | 54 | 2 | 285 | 11 | 31 |
| 8 | Clostridium perfringens | C.perfringens | A | Gas gangrene | TI = “Clostridium perfringens” | 1,952 | 69 | 1 | 635 | 8 | 90 |
| 9 | Salmonella spp. | Salmonella | A | Food poisoning | TI=Salmonella | 21,476 | 160 | 1 | 7,306 | 4 | 1,282 |
| 10 | Escherichia coli O157:H7 | O157:H7 | A | Enteric disease | TI=O157 AND TI=H7 | 4,261 | 93 | 1 | 2,226 | 3 | 329 |
| 11 | Shigella | Shigella | A | Enteric disease | TI=Shigella | 2,283 | 115 | 1 | 692 | 3 | 253 |
| 12 | Staphylococcus | Staphylococcus | A | Skin infections | TI=Staphylococcus | 27,944 | 157 | 1 | 8,383 | 3 | 1,847 |
| 13 | Vibrio cholerae | V. cholerae | A | Cholera | TI = “Vibrio cholerae” | 3,151 | 102 | 1 | 1,361 | 5 | 156 |
| 14 | Helicobacter pylori | H. pylori | B | peptic ulcers | TI = “Helicobacter pylori” | 17,677 | 153 | 1 | 3,386 | 4 | 1,433 |
| 15 | Mycobacterium tuberculosis | M. tuberculosis | B | Tuberculosis | TI = “Mycobacterium tuberculosis” | 13,511 | 155 | 1 | 4,634 | 4 | 1,220 |
| 16 | Mycobacterium leprae | M. leprae | B | Human leprosy | TI = “Mycobacterium leprae” | 632 | 66 | 1 | 212 | 13 | 14 |
| 17 | Haemophilus influenzae | H. influenzae | B | Respiratory tract infections | TI = “Haemophilus influenzae” | 3,116 | 115 | 1 | 1,261 | 17 | 54 |
| 18 | Corynebacterium diphtheriae | C. diphtheriae | A | Diphtheria | TI = “Corynebacterium diphtheriae” | 230 | 45 | 1 | 79 | ||
| 19 | Clostridium tetani | C. tetani | B | Tetanus | TI = “Clostridium tetani” | 51 | 27 | 2 | 8 | 9 | 3 |
| 20 | Streptococcus pyogenes | S. pyogenes | B | Tonsilitis | TI = “Streptococcus pyogenes” | 1,597 | 72 | 1 | 490 | 14 | 34 |
| 21 | Streptococcus pneumoniae | S. pneumoniae | B | Respiratory disease | TI = “Streptococcus pneumoniae” OR TI = pneumococcus | 6,439 | 127 | 1 | 2,350 | 8 | 284 |
| 22 | Streptococcus suis | S. suis | B | meningitis, endocarditis, and arthritis in swine | TI = “Streptococcus suis” | 920 | 42 | 6 | 67 | 1 | 348 |
| 23 | Neisseria meningitidis | N. meningitidis | B | Septicemia and meningitis | TI = “Neisseria meningitidis” OR TI = Meningococcus OR TI = Meningococci | 2,206 | 97 | 1 | 562 | 14 | 48 |
| 24 | Neisseria gonorrhoeae | N.gonorrhoeae | B | Gonorrhea | TI = “Neisseria gonorrhoeae” OR TI = Gonococcus OR TI = Gonococci | 2,029 | 109 | 1 | 887 | 8 | 88 |
| 25 | Bordetella pertussis | B. pertussis | B | Whooping cough | TI = “Bordetella pertussis” | 1,205 | 63 | 1 | 345 | 16 | 29 |
| 26 | Legionella pneumophila | L.pneumophila | A | Legionnaire's disease | TI = “Legionella pneumophila” | 1,604 | 63 | 1 | 554 | 9 | 61 |
| 27 | Campylobacter jejuni | C. jejuni | B | Food poisoning | TI = “Campylobacter jejuni” | 2,958 | 92 | 1 | 850 | 9 | 113 |
| 28 | Borreliella burgdorferi | B. burgdorferi | B | Lyme disease | TI = “Borrelia burgdorferi” OR TI = “Lyme disease spirochete” | 2,731 | 72 | 1 | 1,640 | 12 | 57 |
| 29 | Treponema pallidum | T. pallidum | B | Pathogenic spirochete | TI = “Treponema pallidum” | 494 | 59 | 1 | 232 | 2 | 78 |
| 30 | Leptospira | Leptospira | B | Leptospirosis | TI = Leptospira | 1,555 | 97 | 1 | 392 | 6 | 101 |
| 31 | Listeria monocytogenes | L.monocytogenes | B | Meningitis and sepsis | TI = “Listeria monocytogenes” | 7,493 | 95 | 1 | 2,525 | 5 | 354 |
* A = Biodefense-associated pathogens (BDAPs), B = Health-threatening pathogens (HTPs).
The selection of the 100 pathogens was based on their historical importance in infectious diseases or their potential impact on humans, in the case of newer pathogens. Several parasitic pathogens, such as those caused malaria and schistosomiasis, were also included. The pathogens were selected from the laboratory biosafety pathogen lists of the National Institutes of Health of the United States, the European Union, and China; the bioterrorism response pathogen lists of the Centers for Disease Control and Prevention of the United States, the European Union, and Russia; and select agent program pathogens listed by the United States [4]. Additionally, the World Health Organization's list of key emerging pathogens for preparedness and response [5], the list of pathogens released by Law of the PRC on the Prevention and Treatment of Infectious Diseases [6], and the pathogens listed in some Chinese textbooks were also referred to [[7], [8], [9], [10]]. The pathogenicity and epidemiologic potential of the pathogens were considered in the selection process.
The selected 100 pathogens were divided into two categories (50 each): biodefense-associated pathogens (BDAPs) and health-threatening pathogens (HTPs)(Table 1, Table 2, Table 3 ). HTPs mainly affect people's health, while BDAPs, which are characterized by rapid and widespread infection, have a serious impact on social stability. We retrieved the relevant literature on the pathogens published from 1995 to retrieval time in 2018. For the annual analysis, we retrieved the literatures published from 1995 to 2017, and used all the literatures for the country-, institution-, and journal-wise analysis based on Web of Science online statistics. The Web of Science literature statistics does not distinguish the first author from the other authors for country-wise and institution-wise analysis, so the cumulative number of studies for each country or institution may higher than the total number of studies.
Table 2.
Query key words and comparison by the number of published pathogen studies between China and the United States (viral pathogens only).
| Order | Pathogens | Abbreviation | Group* | Disease | Query | Article | Country-wise distribution | United States |
China |
||
|---|---|---|---|---|---|---|---|---|---|---|---|
| Sort | Quantity | Sort | Quantity | ||||||||
| 1 | Variola virus | Variola | A | Smallpox | TI = “Smallpox virus” OR TI = “Variola virus” | 72 | 16 | 1 | 35 | ||
| 2 | Ebola virus | Ebola | A | Ebola virus disease | TI = “Ebola virus” OR TI = ebolavirus | 1,641 | 97 | 1 | 996 | 6 | 123 |
| 3 | Marburg virus | Marburg | A | Marburg virus disease | TI = “Marburg virus” OR TI = marburgvirus | 211 | 30 | 1 | 129 | 6 | 12 |
| 4 | Lassa virus | Lassa | A | Lassa fever | TI = “Lassa virus” | 156 | 26 | 1 | 82 | 16 | 3 |
| 5 | Venezuelan equine encephalitis virus | VEE | A | Venezuelan equine encephalitis | TI = “Venezuelan equine encephalitis virus” | 237 | 25 | 1 | 191 | 23 | 1 |
| 6 | Eastern equine encephalitis virus | EEE | A | Eastern equine encephalitis | TI = “Eastern Equine Encephalitis virus” | 85 | 10 | 1 | 77 | 2 | 5 |
| 7 | Western equine encephalitis virus | WEE | A | Western equine encephalitis | TI = “Western equine encephalitis virus” | 41 | 9 | 1 | 25 | 9 | 1 |
| 8 | Nipah virus | Nipah | A | Nipah virus infection | TI = “Nipah virus” | 307 | 27 | 1 | 170 | 13 | 6 |
| 9 | Hendra virus | Hendra | A | Hendra virus disease | TI = “Hendra virus” | 141 | 15 | 2 | 70 | 9 | 4 |
| 10 | Hantavirus | Hantavirus | A | Hemorrhagic feverpulmonary syndrome | TI = “Hantavirus” | 1,181 | 82 | 1 | 426 | 8 | 64 |
| 11 | Hantaan virus | Hantaan | A | Hantavirus hemorrhagic fever with renal syndrome (HFRS) | TI = “Hantaan virus” | 168 | 19 | 2 | 44 | 1 | 77 |
| 12 | Sin Nombre virus | SNV | A | Hantavirus pulmonary syndrome (HPS) | TI = “Sin nombre virus” | 84 | 7 | 1 | 82 | ||
| 13 | Crimean-Congo hemorrhagic fever virus | CCHFV | A | Crimean-Congo hemorrhagic fever | TI = “Crimean Congo hemorrhagic fever virus” | 245 | 56 | 1 | 66 | 6 | 22 |
| 14 | Rift Valley fever virus | RVFV | A | Rift Valley fever | TI = “Rift Valley fever virus” | 390 | 58 | 1 | 198 | 15 | 8 |
| 15 | Junin virus | Junin | A | Argentine hemorrhagic fever | TI = “Junin virus” | 102 | 14 | 2 | 38 | 6 | 2 |
| 16 | Yellow fever virus | YFV | A | Yellow fever | TI = “Yellow fever virus” | 259 | 43 | 1 | 130 | 10 | 8 |
| 17 | Dengue virus | Dengue | B | Dengue fever | TI = “Dengue virus” | 3,131 | 111 | 1 | 1,045 | 6 | 236 |
| 18 | Japanese encephalitis virus | JEV | A | Japanese encephalitis | TI = “Japanese encephalitis virus” | 932 | 44 | 5 | 132 | 1 | 202 |
| 19 | Tick-borne encephalitis virus | TBEV | A | Tick-borne encephalitis | TI = “Tick-borne encephalitis virus” OR TI = TBEV | 459 | 49 | 8 | 31 | 20 | 6 |
| 20 | West Nile virus | WNV | A | West Nile fever | TI = “West Nile virus” | 2,802 | 104 | 1 | 1,778 | 8 | 70 |
| 21 | Zika virus | Zika | B | Zika fever | TI = “Zika Virus” | 1,486 | 102 | 1 | 788 | 3 | 144 |
| 22 | Chikungunya virus | Chikungunya | B | Chikungunya fever | TI = “Chikungunya virus” OR TI=CHIKV | 849 | 90 | 1 | 260 | 17 | 16 |
| 23 | Severe fever with thrombocytopenia syndrome virus | SFTSV | B | Severe fever with thrombocytopenia syndrome | TI = “Severe fever with thrombocytopenia syndrome virus” OR TI = “SFTS virus” | 113 | 14 | 4 | 19 | 1 | 67 |
| 24 | Influenza virus | Influenza | A | Influenza | TI = “Influenza virus” | 6,869 | 116 | 1 | 2,642 | 2 | 1,199 |
| 25 | H5N1 influenza virus | H5N1 | A | Influenza | TI=H5N1 AND TI = “Influenza virus” | 742 | 69 | 1 | 241 | 2 | 223 |
| 26 | H1N1 influenza virus | H1N1 | A | Influenza | TI=H1N1 AND TI = “Influenza virus” | 635 | 60 | 1 | 198 | 2 | 138 |
| 27 | H7N9 influenza virus | H7N9 | A | Influenza | TI=H7N9 AND TI = “Influenza virus” | 89 | 16 | 2 | 29 | 1 | 57 |
| 28 | Measles virus | Measles | B | Measles | TI = “Measles virus” | 1,317 | 84 | 1 | 480 | 6 | 61 |
| 29 | Rubella virus | Rubella | B | Rubella | TI = “Rubella virus” | 317 | 51 | 1 | 107 | 5 | 25 |
| 30 | Mumps virus | Mumps | B | Mumps | TI = “Mumps virus” | 259 | 37 | 1 | 63 | 5 | 17 |
| 31 | Adenovirus | Adenovirus | B | upper respiratory tract infection | TI = Adenovirus | 9,706 | 104 | 1 | 4,390 | 2 | 1,416 |
| 32 | Respiratory syncytial virus | RSV | B | Upper respiratory tract infection | TI = “Human respiratory syncytial virus” OR TI=HRSV | 428 | 63 | 1 | 131 | 4 | 35 |
| 33 | Severe acute respiratory syndrome coronavirus | SARS | A | Severe acute respiratory syndrome | TI = “SARS Coronavirus” OR TI = “Severe acute respiratory syndrome Coronavirus” OR TI=SARS-CoV | 1,394 | 50 | 2 | 481 | 1 | 551 |
| 34 | Middle East respiratory syndrome coronavirus | MERS | A | Middle-East respiratory syndrome | TI = “Middle East Respiratory Syndrome Coronavirus” OR TI = “MERS coronavirus” OR TI = MERS-CoV | 610 | 51 | 1 | 251 | 3 | 138 |
| 35 | Human immunodeficiency virus | HIV | B | Acquired immunodeficiency syndrome (AIDS) | TI = “Human immunodeficiency virus” | 17,846 | 147 | 1 | 10,019 | 11 | 450 |
| 36 | Human T-lymphotropic virus | HTLV | B | T-cell leukemia | TI = “Human T-lymphotropic virus” OR TI=HTLV | 2,680 | 99 | 2 | 814 | 11 | 52 |
| 37 | Hepatitis A virus | HAV | B | Hepatitis A | TI = “Hepatitis A virus” | 1,088 | 81 | 1 | 221 | 2 | 94 |
| 38 | Hepatitis B virus | HBV | B | Hepatitis B | TI = “Hepatitis B virus” | 10,712 | 147 | 2 | 2,017 | 1 | 3,099 |
| 39 | Hepatitis C virus | HCV | B | Hepatitis C | TI = “Hepatitis C virus” | 16,791 | 151 | 1 | 5,335 | 6 | 1,077 |
| 40 | Coxsackievirus | Coxsackievirus | B | Viral myocarditis | TI=Coxsackievirus OR TI = “Coxsackie virus” | 1,489 | 61 | 1 | 409 | 2 | 376 |
| 41 | Rotavirus | Rotavirus | B | Severe diarrhea | TI = Rotavirus | 4,723 | 149 | 1 | 1,677 | 6 | 257 |
| 42 | Enterovirus 71 | EV71 | B | Hand-foot-and-mouth disease | TI = “Enterovirus 71” OR TI = EV71 | 1,111 | 43 | 3 | 115 | 1 | 569 |
| 43 | Norwalk virus | Norwalk | B | Gastroenteritis | TI=Norovirus OR TI = “Norwalk virus” | 2,444 | 95 | 1 | 892 | 3 | 201 |
| 44 | Poliovirus | Poliovirus | B | Polio | TI=Poliovirus | 1,577 | 114 | 1 | 843 | 7 | 62 |
| 45 | Herpes simplex virus | HSV | B | Gingival stomatitis and neonatal infection, etc. | TI = “Herpes simplex virus” | 7,544 | 114 | 1 | 3,959 | 6 | 336 |
| 46 | Varicella-zoster virus | VZV | B | Varicella and herpes zoster | TI = “Varicella zoster virus” | 1,611 | 78 | 1 | 667 | 14 | 36 |
| 47 | Human cytomegalovirus | HCMV | B | Congenital malformation | TI=Cytomegalovirus | 10,832 | 113 | 1 | 4,170 | 7 | 492 |
| 48 | Epstein-Barr virus | EBV | B | Infectious mononucleosis | TI = “Epstein barr virus” | 7,497 | 107 | 1 | 2,295 | 3 | 746 |
| 49 | Monkeypox virus | Monkeypox | A | Monkey pox | TI = “Monkeypox virus” | 82 | 16 | 1 | 70 | 14 | 1 |
| 50 | Rabies virus | Rabies | B | Rabies | TI = “Rabies virus” | 1,129 | 92 | 1 | 321 | 2 | 179 |
| 51 | Human papillomavirus | HPV | B | Squamous epithelial proliferation of human skin and mucosa | TI = “Human papillomavirus” | 10,975 | 147 | 1 | 4,383 | 2 | 899 |
| 52 | Human parvovirus B19 | B19 | B | Fetal severe anemia, abortion or death | TI = “Human Parvovirus B19” OR TI = “Erythrovirus B19” | 423 | 64 | 2 | 73 | 5 | 23 |
| 53 | Foot-and-mouth disease virus | FMDV | A | Foot-and-mouth disease | TI = “Foot-and-mouth disease virus” | 1,487 | 86 | 3 | 273 | 2 | 290 |
| 54 | African swine fever virus | ASFV | A | African swine fever | TI = “African swine fever virus” | 416 | 53 | 3 | 73 | 13 | 9 |
| 55 | Newcastle disease virus | NDV | A | Newcastle disease | TI = “Newcastle disease virus” | 1,317 | 96 | 1 | 371 | 2 | 324 |
| 56 | Vesicular stomatitis virus | VSV | B | Bubbles and erosion of the epithelium of the tongue, lip, oral mucosa | TI = “Vesicular Stomatitis” AND TI = Virus | 932 | 46 | 1 | 640 | 3 | 58 |
* A = BDAPs; B = HTPs.
Table 3.
Query key words and comparison by the number of published pathogen studies between China and the United States (Rickettsia, Mycoplasma, Chlamydia, fungi, and protozoa).
| Order | Pathogens | Abbreviation | Group* | Disease | Query | Article | Country-wise distribution | United States |
China |
||
|---|---|---|---|---|---|---|---|---|---|---|---|
| Sort | Quantity | Sort | Quantity | ||||||||
| 1 | Coxiella burnetii | C. burnetii | A | Q-fever | TI = “Coxiella burnetii” | 1,055 | 87 | 1 | 292 | 16 | 18 |
| 2 | Rickettsia prowazekii | R. prowazekii | A | Typhus | TI = “Rickettsia prowazekii” | 95 | 15 | 1 | 69 | 11 | 1 |
| 3 | Rickettsia rickettsii | R. rickettsii | A | Rocky Mountain Spotted Fever | TI = “Rickettsia rickettsii” | 132 | 15 | 1 | 78 | 3 | 6 |
| 4 | Orientia tsutsugamushi | O.tsutsugamushi | B | Scrub typhus | TI = “Rickettsia tsutsugamushi” OR TI = “Orientia tsutsugamushi” | 294 | 28 | 3 | 69 | 6 | 19 |
| 5 | Bartonella | Bartonella | B | Trench fever | TI=Bartonella | 1,504 | 94 | 1 | 706 | 12 | 35 |
| 6 | Mycoplasma pneumoniae | M. pneumoniae | B | Respiratory tract infections | TI = “Mycoplasma pneumoniae” | 1,289 | 63 | 1 | 287 | 2 | 188 |
| 7 | Chlamydia psittaci | C. psittaci | A | Psittacosis in birds | TI = “Chlamydophila psittaci” OR TI = “Chlamydia psittaci” | 436 | 49 | 1 | 83 | 5 | 35 |
| 8 | Chlamydia pneumoniae | C. pneumoniae | B | Respiratory infections in people | TI = “Chlamydophila pneumoniae” OR TI = “Chlamydia pneumoniae” | 1,891 | 71 | 1 | 476 | 10 | 66 |
| 9 | Chlamydia trachomatis | C. trachomatis | B | Disease in either the eye or the urogenital tract | TI = “Chlamydia trachomatis” | 3,366 | 119 | 1 | 1,316 | 8 | 143 |
| 10 | Coccidioides immitis | C. immitis | A | Coccidioidomycosis | TI = “Coccidioides immitis” | 134 | 15 | 1 | 124 | ||
| 11 | Plasmodium spp. | Plasmodium | B | Human malaria | TI=Plasmodium OR TI = “malaria parasite” | 16,098 | 162 | 1 | 5,451 | 15 | 482 |
| 12 | Cryptosporidium | Cryptosporidium | A | Diarrhea | TI=Cryptosporidium | 3,862 | 114 | 1 | 1,602 | 3 | 259 |
| 13 | Schistosome | Schistosome | B | Schistosomiasis | TI=Schistosome OR TI = “Blood flukes” | 704 | 78 | 1 | 292 | 3 | 58 |
* A = BDAPs; B = HTPs.
3. Results
3.1. Annual number of publications
In this study, a total of 309,624 articles were retrieved. Of these, 295,866 were published in the period 1995–2017, and the highest number of articles (n = 16,658) was published in the year 2006. Based on the trends in the published literatures, three stages were identified: from 1995 to 2002, the increase in the number of published articles was not very remarkable; during 2002 to 2011, the increase was rapid; and during 2011–2017, the increase tended to slow down (Fig. 1 ).
Fig. 1.
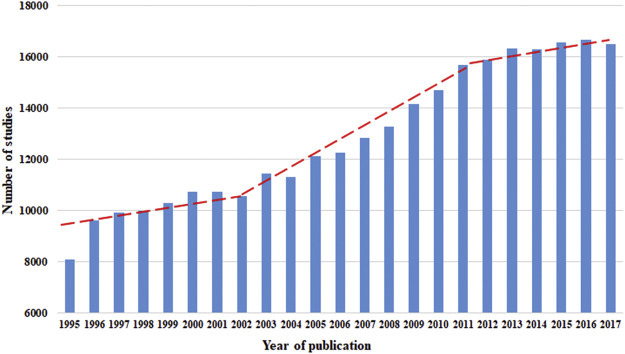
Annual number of published studies on all the pathogens.
We noted that the number of studies for some pathogens showed (1) continuous growth, such as Mycobacterium tuberculosis, Dengue virus, Hepatitis B virus, Norwalk virus, and Plasmodium spp.; (2) a rapid increase followed by a gradual decrease, such as Bacillus anthracis, Yersinia pestis, Ebola virus, H5N1 Influenza virus, H1N1 Influenza virus, H7N9 Influenza virus, SARS coronavirus, and Chlamydia pneumoniae (Fig. 2 ); and (3) a generally decreasing trend. For example, there were 1109 reports on human immunodeficiency virus in 1995, but the number decreased to 471 in 2017.
Fig. 2.

Annual number of published studies on different pathogens (increase followed by a decrease).
In addition to the above three trends, the reports on other pathogens showed (4) a plateau followed by an increase, such as Zika virus; (5) an increase followed by a plateau, such as Escherichia coli O157:H7; (6) a decrease followed by an increase, such as Vibrio cholerae; (7) a consistent plateau, such as Epstein-Barr virus; (8) a plateau followed by a decrease, such as measles virus; (9) a decrease followed by a plateau, such as poliovirus; and (10) an irregular pattern, mainly for pathogens with a small number of reports (Table 4 , Supplementary Table 1).
Table 4.
Trends by the annual number of published pathogen studies.
| Order | Trend | Pathogens |
|---|---|---|
| A | Sustained growth | Brucella; B. pseudomallei; Salmonella; M. tuberculosis; L.monocytogenes; Hendra; Dengue; SFTSV; HBV; HCV; Norwalk; Rabies; M. pneumoniae; Plasmodium |
| B | Plateau followed by increase | S. suis; N.gonorrhoeae; Leptospira; Marburg; Lassa; CCHFV; RVFV; YFV; JEV; TBEV; Zika; Chikungunya; RSV; Coxsackievirus; Rotavirus; EV71; HPV; FMDV; ASFV; NDV; C. burnetii; O. sutsugamushi; C. trachomatis |
| C | Increase followed by plateau | F. tularensis; B.mallei; O157:H7; Staphylococcus; S. pneumoniae; L.pneumophila; C. jejuni; WNV; MERS; Cryptosporidium |
| D | Increase followed by decrease | B. anthracis; Y. pestis; H. pylori; Ebola; Influenza; H5N1; H1N1; H7N9; SARS; Bartonella; C. pneumoniae |
| E | Decrease followed by increase | V. cholerae; T. pallidum |
| F | Plateau | C. botulinum; Shigella; M. leprae; H. influenzae; C. diphtheriae; C. tetani; N. meningitidis; B. pertussis; B. burgdorferi; Variola; EEE; WEE; Hantavirus; Rubella; Adenovirus; HAV; VZV; HCMV; EBV; B19; VSV; Schistosome |
| G | Plateau followed by decrease | Measles; Mumpsvirus; C. immitis |
| H | Decrease followed by steady | HTLV; Poliovirus |
| I | Continued reduction | HIV; HSV |
| G | Irregular | C.perfringens; S. pyogenes; VEE; Nipah; Hantaan; SNV; Junin; Monkeypox; R. prowazekii; R. rickettsii; C. psittaci |
In the case of some pathogens, particularly BDAPs, the literature showed a decrease followed by a rapid increase. For example, after the outbreak of SARS, many studies were focused on vaccine researches and productions [[11], [12], [13]], which were discontinued thereafter. Had the research been continued, the world would have been better prepared for the current COVID-19 pandemic.
3.2. Country and region distributions of pathogen studies
The pathogens with the highest number of published studies were Staphylococcus (27,944), Salmonella (21,476), human immunodeficiency virus (17,846), Helicobacter pylori (17,677), and Hepatitis C virus (16,791). The most common pathogens across countries were Plasmodium (162), Salmonella (160), Staphylococcus (157), Mycobacterium tuberculosis (155), and Helicobacter pylori (153) (Table 1, Table 2, Table 3, Fig. 3 ).
Fig. 3.

Number of published studies and country/region distribution for each type of pathogen.
The countries/regions with the largest number of published studies on pathogens included the United States of America, China, Japan, England, Germany, France, Canada, Italy, Spain, and India. The United States of America led the highest number of publications on most of the pathogens (82 of the 100 pathogens selected), and also had the second highest number of publications on the following pathogens: Hepatitis B virus, Human T-lymphotropic virus, severe acute respiratory syndrome coronavirus, Burkholderia pseudomallei, Human parvovirus B19, Hendra virus, Hanta Virus, Junin virus, H7N9 Influenza virus, and Clostridium tetani. It had the third and after highest number of publications on the following pathogens: Foot-and-mouth disease virus, Enterovirus 71, African swine fever virus, Orientia tsutsugamushi, severe fever with thrombocytopenia syndrome virus, Japanese encephalitis virus, Streptococcus suis, and tick-borne encephalitis virus.
China had the highest number of published studies on the following pathogens: Hepatitis B virus, Enterovirus 71, severe acute respiratory syndrome coronavirus, Streptococcus suis, Japanese encephalitis virus, Hanta virus, severe fever with thrombocytopenia syndrome virus, and H7N9 Influenza virus. It had also the second highest number of publications on the following pathogens: Adenovirus, Influenza virus, human papillomavirus, Coxsackievirus, Newcastle disease virus, foot-and-mouth disease virus, H5N1 Influenza virus, Mycoplasma pneumoniae, rabies virus, H1N1 Influenza virus, Yersinia pestis, hepatitis A virus, Treponema pallidum, and Eastern equine encephalitis virus. In addition, it had the third highest number of publications on the following pathogens: Staphylococcus, Epstein-Barr virus, Escherichia coli O157:H7, Cryptosporidium, Shigella, Norwalk virus, Zika virus, Middle East respiratory syndrome coronavirus, vesicular stomatitis virus, Schistosoma, and Rickettsia rickettsii.
Japan had the highest number of studies on human T-lymphotropic virus and human parvovirus B19, while England had the highest number of studies on foot-and-mouth disease virus. Further, France had the highest number of studies on Clostridium tetani, while Spain had the highest number of studies on African swine fever virus. For Australia, it was Hendra virus; for Korea, Orientia tsutsugamushi; for Russia, tick-borne encephalitis virus; for Thailand, Burkholderia pseudomallei; and for Argentina, Junin virus (Table 5 ).
Table 5.
Top ranked Countries/regions by number of published studies on various pathogens.
| Countries/regions | Top-ranked |
|---|---|
| United States | Except: HBV, HTLV, SARS, B. pseudomallei, B19, Hantaan, Junin, H7N9, C. tetani, Hendra (Rank 2); FMDV, EV71, ASFV, O. sutsugamushi (Rank 3); SFTSV; JEV; S. suis; TBEV (Rank after 3) |
| China | S. suis; Hantaan; JEV; SFTSV; H7N9; SARS; HBV; EV71 |
| Japan | HTLV; B19 |
| England | FMDV |
| France | C. tetani |
| Spain | ASFV |
| Australia | Hendra |
| Russia | TBEV |
| South Korea | O. sutsugamushi |
| Thailand | B. pseudomallei |
| Argentina | Junin |
The number of studies exploring various pathogens in the selected 15 countries and regions is shown in Supplementary Table 2. The countries have been selected mainly based on the total number of published studies.
3.3. Top-ranked institutes on published pathogen studies
With regard to the distribution of studies across institutions, the following institutions had the highest number of publications: Pasteur Institute (4,688), Harvard University (4,330), Unites States National Institute of Allergy and Infectious Diseases (NIAID) (3,808), Johns Hopkins University (3,188), University of Washington (3,140), University of Oxford (2,753), University of California San Francisco (2,658), Emory University (2,314), University of Maryland (2,220), and University of Tokyo (2,178). Furthermore, some institutions had the highest number of studies for specific pathogens, such as: Baylor College of Medicine on Helicobacter pylori; Harvard University on human immunodeficiency virus; Chinese Academy of Sciences on severe acute respiratory syndrome coronavirus (Table 6 ).
Table 6.
Institutions with the highest number of published studies on select pathogens.
| Countries/regions | Institutes | Pathogens |
|---|---|---|
| United States | ARS | O157:H7 |
| Baylor Coll Med | H. pylori | |
| Colorado State Univ | M. leprae | |
| Ctr Dis Control Prevent | S. pneumoniae; Variola; EEE; Nipah; CCHFV; WNV; Influenza; Rotavirus; Norwalk; Poliovirus; Monkeypox; Bartonella; Cryptosporidium | |
| Georgia State Univ | Rubella | |
| Harvard Univ | Staphylococcus; HIV; HSV | |
| Mayo Clin | Measles | |
| NCI | HPV | |
| NIAID | Ebola; C. trachomatis | |
| Northwestern Univ | L. pneumophila | |
| Oregon Hlth Sci Univ | HCMV | |
| Thomas Jefferson Univ | Rabies | |
| Univ Arizona | C. immitis | |
| Univ Colorado | VZV | |
| Univ Georgia | M. pneumoniae | |
| Univ Kentucky | Y. pestis | |
| Univ New Mexico | SNV | |
| Univ Pittsburgh | C. perfringens | |
| Univ S Alabama | R. prowazekii | |
| Univ Texas | Adenovirus; Zika | |
| Univ Washington | T. pallidum | |
| US FDA | Mumps | |
| USA (US Army) | B. anthracis; B. mallei; VEE | |
| USDA ARS | Salmonella | |
| Yale Univ | B. burgdorferi; VSV | |
| China | Chinese Acad Agr Sci | FMDV; NDV |
| Chinese Acad Sci | SARS | |
| Chung Shan Med Univ | B19 | |
| Fourth Mil Med Univ | Hantaan | |
| Fudan Univ | HBV | |
| Univ Hong Kong | H1N1; H7N9; MERS | |
| Chang Gung Univ (Taiwan of China) | EV71 | |
| Natl Def Med Ctr (Taiwan of China) | JEV | |
| Japan | Hokkaido Univ | H5N1 |
| Kagoshima Univ | HTLV | |
| Natl Inst Infect Dis | SFTSV | |
| England | Inst Food Res | C. botulinum |
| Univ Birmingham | EBV | |
| Univ Oxford | H. influenzae; N. meningitidis | |
| Univ York | Schistosome | |
| Germany | Bernhard Nocht Inst Trop Med | Lassa |
| Univ Marburg | Marburg | |
| France | INRA | Brucella |
| INSERM | HCV | |
| Inst Pasteur | Shigella; M. tuberculosis; C. tetani; B. pertussis; L.monocytogenes; RVFV; YFV; Chikungunya | |
| Canada | Def Res Dev Canada Suffield | WEE |
| Natl Res Council Canada | C. jejuni | |
| Univ British Columbia | Coxsackievirus | |
| Univ Montreal | S. suis | |
| Spain | Inst Salud Carlos III | RSV |
| Univ Autonoma Madrid | ASFV | |
| Univ Barcelona | HAV | |
| India | Natl Inst Cholera Enter Dis | V. cholerae |
| Australia | CSIRO | Hendra |
| Sweden | Lund Univ | S. pyogenes |
| Orebro Univ Hosp | N.gonorrhoeae | |
| Umea Univ | F. tularensis | |
| Russia | Russian Acad Sci | TBEV |
| Belgium | Univ Ghent | C. psittaci |
| Slovakia | Slovak Acad Sci | C. burnetii |
| Finland | Univ Helsinki | Hantavirus |
| Brazil | Univ Estado Rio De Janeiro | C. diphtheriae |
| Univ Sao Paulo | Leptospira; R. rickettsii | |
| Argentina | Univ Buenos Aires | Junin |
| South Korea | Seoul Natl Univ | O. sutsugamushi |
| Thailand | Mahidol Univ | B. pseudomallei; Dengue; Plasmodium |
The number of studies exploring various pathogens by the selected 20 institutions is shown in Supplementary Table 3. The institutions were mainly selected based on the total number of published studies. The list also included some institutions and universities in China, such as the Chinese Academy of Sciences, University of Hong Kong, Fudan University, Chinese Academy of Medical Sciences, Chinese Center for Disease Control and Prevention, and Peking University. “CTR DIS CONTROL PREVENT” ranked the first for its number of published studies. However, as “CTR DIS CONTROL PREVENT” represents the Centers for Disease Control and Prevention of the United States, its published number of studies may come from more than one institution, therefore, it was not selected. The next institution was Pasteur Institute, but studies on influenza virus, severe acute respiratory syndrome coronavirus, and Francisella tularensis were relatively rare. Harvard University was listed next to Pasteur Institute, but studies on Japanese encephalitis virus, Influenza virus, Middle East respiratory syndrome coronavirus, and foot-and-mouth disease virus were relatively rare. The Chinese Academy of Sciences had a relatively high number of studies on Yersinia pestis, Escherichia coli O157:H7, Zika virus, Influenza virus, and severe acute respiratory syndrome coronavirus, and the University of Hong Kong also had a relatively high number of studies on Burkholderia pseudomallei, Helicobacter pylori, influenza virus, severe acute respiratory syndrome coronavirus, and hepatitis B virus. Some universities and institutions in China, such as Fudan University and the Chinese Academy of Medical Sciences, had a small number of studies on BDAPs, such as Bacillus anthracis and Francisella tularensis, in comparison with some universities and institutions in the United States, such as University of Maryland or National Institute of Allergy and Infectious Diseases (NIAID) (Supplementary Table 3).
3.4. Journal distribution of the published studies
With regard to the total number of studies on various pathogens, the following journals had published the highest number of studies: Journal of Virology (14,586), Journal of Clinical Microbiology (7,273), Infection and Immunity (6,885), Journal of Infectious Diseases (5,643), and Vaccine (4,151) (Supplementary Table 4). Some journals had the highest number of studies on some particular pathogens: For example, Emerging Infectious Disease had the highest number of studies on Ebola virus, Infection and Immunity had the highest number of studies on Yersinia pestis, and Vaccine had the highest number of studies on Rotavirus (Table 7 ).
Table 7.
Journals with the highest number of published studies on select pathogens.
| Journal country/regions | Journals | Impact Factor (2018) | Pathogens |
|---|---|---|---|
| United States | Emerg Infect Dis | 7.2 | Hantavirus; SNV; MERS |
| J Virol | 4.3 | Ebola; Marburg; Lassa; VEE; WEE; Nipah; Hendra; Hantaan; CCHFV; RVFV; Junin; YFV; Dengue; JEV; TBEV; SFTSV; Influenza; H5N1; H1N1; H7N9; Measles; Rubella; Mumps; Adenovirus; RSV; SARS; HIV; HAV; HBV; HCV; Coxsackievirus; Norwalk; Poliovirus; HSV; VZV; HCMV; EBV; Monkeypox; Rabies; HPV; FMDV; ASFV; NDV; VSV | |
| PLoS Negl Trop Dis | 4.5 | Leptospira; Chikungunya | |
| Antimicrob Agents Chemother | 4.7 | Staphylococcus; S. pneumoniae | |
| Helicobacter | 3.4 | H. pylori | |
| J Clin Microbiol | 5.0 | M. tuberculosis; C. diphtheriae; T. pallidum; Variola; Bartonella; M. pneumoniae | |
| Appl Environ Microbiol | 4.1 | C. botulinum; C. jejuni | |
| Infect Immun | 3.2 | Y. pestis; F. tularensis; Brucella; B.mallei; B. pseudomallei; Shigella; H. influenzae; S. pyogenes; N. meningitidis; B. pertussis; L.pneumophila; B. burgdorferi; C. burnetii; R. rickettsii; C. pneumoniae; C. immitis | |
| J Bacteriol | 3.2 | B. anthracis; V. cholerae; R. prowazekii | |
| PLoS One | 2.8 | EV71 | |
| Am J Trop Med Hyg | 2.3 | C. tetani; EEE; O. sutsugamushi | |
| Vector Borne Zoonotic Dis | 1.9 | WNV | |
| J Med Virol | 2.0 | B19 | |
| Sex Transm Dis | 2.3 | N. gonorrhoeae; C. trachomatis | |
| AIDS Res Hum Retroviruses | 1.8 | HTLV | |
| J Food Prot | 1.6 | Salmonella; O157:H7; L.monocytogenes | |
| England | Vaccine | 4.8 | Rotavirus |
| Sci Rep | 4.0 | Zika | |
| Malar J | 2.8 | Plasmodium | |
| Anaerobe | 2.7 | C. perfringens | |
| Parasitology | 2.5 | Schistosome | |
| Lepr Rev | 0.5 | M. leprae | |
| Netherlands | Vet Microbiol | 2.8 | S. suis; C. psittaci |
| Vet Parasitol | 2.0 | Cryptosporidium |
The number of studies exploring various pathogens for the selected 20 journals is shown in Supplementary Table 4. The journals were selected mainly based on their impact factor and the total number of pathogens studies published. Infection and Immunity and Molecular Microbiology had the highest number of publications on bacterial pathogens; Vaccine had publications on almost all kinds of pathogens; PNAS mainly had reports on viruses; and Emerging Infectious Diseases had more virus-related literature. Some top journals published a number of related studies on particular pathogens: pathogens studies published on Science rank first and second are Plasmodium spp. and Salmonella spp., Nature are Plasmodium spp. and influenza virus; Cell are Plasmodium spp. and Zika virus; New England Journal of Medicine are human immunodeficiency virus and human cytomegalovirus; Lancet are Helicobacter pylori and Hepatitis C virus. (Supplementary Table 4).
4. Discussion
4.1. Characteristics of the retrieved studies
From the quantitative analysis of studies on the selected pathogens, the following characteristics were evidenced:
-
(1)
The number of studies is closely related to disease epidemics. Some pathogens, such as SARS coronavirus, H1N1 influenza virus, and Ebola virus, have resulted in a rapid increase in the number of studies published after the disease outbreaks. However, once the epidemic has been controlled, the number of studies declined.
-
(2)
The number of studies was closely related to disease distribution. The number of studies related to pathogens tended to be related to the geographical distribution of the corresponding diseases. For example, the literatures on H7N9 avian influenza is predominate in China, while the most relevant literatures on Burkholderia pseudomallei is in Thailand. In studies assessing Junin virus, it was Argentina which published the most studies.
-
(3)
Core research institutions play significant roles on pathogen studies. Such as the Pasteur Institute in France, Harvard University, the National Institute of Allergy and Infectious Diseases in the United States, and the Chinese Academy of Sciences.
4.2. Research studies on pathogens in China
China attaches great importance to the prevention and control of infectious diseases; thus has made significant progress in relevant research and biosafety management since the SARS outbreak in 2002–2003 [14]. Although the great advance and progress have been made, improvement in the following areas are still needed:
-
(1)
Pathogens studied are unbalanced. Relatively large number of published studies is on health-threatening pathogens, such as hepatitis B virus and Japanese encephalitis, while relatively small number of published studies is on biodefense-associated pathogens such as Bacillus anthracis and Ebola virus, specifically at the university level.
-
(2)
Institutions SCI reports on pathogens lower than world top pathogen research institutions. In the field of pathogen research, national institutions such as the Chinese Academy of Sciences, Chinese Academy of Medical Sciences, and Chinese Center for Disease Control and Prevention play an important role. However, in comparison with the world's top pathogen research institutions such as the Pasteur Institute in France and the National Institute of Allergy and Infectious Diseases in the United States of America, there are still some gap on pathogen research SCI reports.
-
(3)
The level of Chinese pathogen-related journals needs to be enhanced. It can be seen from the data that the pathogen-related SCI journal are mainly from the United States and Europe. Although the total number of Chinese SCI reports on pathogens is the second largest in the world, there are still not many influential international journals in China in this field.
4.3. Pathogen research is closely related to biosafety and biosecurity
Pathogen researches can protect human health, but it can also create potential biosafety and biosecurity issues that threaten human health.
-
(1)
The level of research on pathogens is an important index for the ability to deal with infectious diseases. Pathogen research is based on historic infectious diseases, emerging infections, and control of new biological threats. In addition, it is also an important aspect of national biodefense capacity. By strengthening investment in science and technology, China's ability to prevent and control infectious diseases has increased significantly [15]. Consequently, the number of related SCI reports has grown significantly [16], although there is still gaps between China and the United States [17].
-
(2)
Pathogen research can result in biosafety and biosecurity risks. With the rapid development of life sciences and biotechnology, biosafety and biosecurity issues are receiving increasing attention [[18], [19], [20], [21]]. Pathogen-related researches may lead to an increased likelihood of pathogen laboratory errors, and there is also the possibility of deliberate use by humans [22].
-
(3)
Towards reducing the biosafety and biosecurity risk, it is necessary to ameliorate the supervision and support for pathogenic researches, including improvement on biosafety management monitoring and risk assessment systems [23]. Furthermore, researches on molecular biocontainment and other methods should also be strengthened [[24], [25]].
Conflict of interest statement
The authors declare that there are no conflicts of interest.
Footnotes
Supplementary data to this article can be found online at https://doi.org/10.1016/j.bsheal.2020.05.004.
Appendix A. Supplementary data
Supplementary material
References
- 1.Morens D.M., Folkers G.K., Fauci A.S. The challenge of emerging and re-emerging infectious diseases. Nature. 2004;6996:242–249. doi: 10.1038/nature02759. [DOI] [PMC free article] [PubMed] [Google Scholar]
- 2.Frischknecht F. The history of biological warfare. EMBO Rep. 2003;4:S47–S52. doi: 10.1038/sj.embor.embor849. [DOI] [PMC free article] [PubMed] [Google Scholar]
- 3.Tian D.Q., Wang H. Comparison of USA and UK biosecurity and biodefense strategies based on word frequency analysis. Mil. Med. Sci. 2019;7:481–487. doi: 10.7644/j.issn.1674-9960.2019.07.001. [DOI] [Google Scholar]
- 4.Tian D.Q., Zheng T. Comparison and analysis of biological agent category lists based on biosafety and biodefense. PLoS One. 2014;6 doi: 10.1371/journal.pone.0101163. e101163. [DOI] [PMC free article] [PubMed] [Google Scholar]
- 5.WHO An R&D Blueprint For Action To Prevent Epidemics. https://www.who.int/blueprint/what/improving-coordination/workstream_5_document_on_financing.pdf 2016 (accessed 8 April 2020)
- 6.Law of the PRC on the Prevention and Treatment of Infectious Diseases http://www.npc.gov.cn/npc/c238/202001/099a493d03774811b058f0f0ece38078.shtml (accessed 28 April 2020)
- 7.Li F., Xu Z.K. Ninth edition. People’s Medical Publishing House, Beijing; 2018. Medical microbiology. [Google Scholar]
- 8.Luo E.J. Fifth edition. Science Press; Beijing: 2016. Pathogenic Biology. [Google Scholar]
- 9.Jin N.Y., Hu Z.M., Feng S.Z. Science Press; Beijing: 2007. New Zoology. [Google Scholar]
- 10.Jin Q. Science Press; Beijing: 2001. Medical Molecular Virology. [Google Scholar]
- 11.Yang Z.Y., Kong W.P., Huang Y., Roberts A., Murphy B.R., Subbarao K., Nabel G.J. A DNA vaccine induces SARS coronavirus neutralization and protective immunity in mice. Nature. 2004;6982:561–564. doi: 10.1038/nature02463. [DOI] [PMC free article] [PubMed] [Google Scholar]
- 12.Gao W.T., Tamin A., Soloff A., D'Aiuto L., Nwanegbo E., Robbins P.D., Bellini W.J., Barratt-Boyes S., Gambotto A. Effects of a SARS-associated coronavirus vaccine in monkeys. Lancet. 2003;9399:1895–1896. doi: 10.1016/S0140-6736(03)14962-8. [DOI] [PMC free article] [PubMed] [Google Scholar]
- 13.Bukreyev A., Lamirande E.W., Buchholz U.J., Vogel L.N., Elkins W.R., Claire M.St, Murphy B.R., Subbarao K., Collins P.L. Mucosal immunisation of African green monkeys (Cercopithecus aethiops) with an attenuated parainfluenza virus expressing the SARS coronavirus spike protein for the prevention of SARS. Lancet. 2004;9427:2122–2127. doi: 10.1016/S0140-6736(04)16501-X. [DOI] [PMC free article] [PubMed] [Google Scholar]
- 14.Gao G.F. For a better world: biosafety strategies to protect global health. Biosaf. Heal. 2019;1:1–3. doi: 10.1016/j.bsheal.2019.03.001. [DOI] [PMC free article] [PubMed] [Google Scholar]
- 15.Wang Y. The H7N9 influenza virus in China—changes since SARS. N. Engl. J. Med. 2013;25:2348–2349. doi: 10.1056/NEJMp1305311. [DOI] [PubMed] [Google Scholar]
- 16.Tian D.Q., Zheng T. Emerging infectious disease: trends in the literature on SARS and H7N9 influenza. Scientometrics. 2015;105:485–495. doi: 10.1007/s11192-015-1681-8. [DOI] [PMC free article] [PubMed] [Google Scholar]
- 17.Tian D.Q., Yu Y.Z., Wang Y.M., Zheng T. Comparison of trends in the quantity and variety of Science Citation Index (SCI) literature on human pathogens between China and the United States. Scientometrics. 2012;93:1019–1027. doi: 10.1007/s11192-012-0772-z. [DOI] [PMC free article] [PubMed] [Google Scholar]
- 18.National Research Council (US) National Academies Press (US); Washington DC: 2004. Biotechnology Research in an Age of Terrorism. [PubMed] [Google Scholar]
- 19.National Research Council(US) National Academies Press; Washington DC: 2006. Globalization, biosecurity, and the future of the life sciences. [Google Scholar]
- 20.Jonathan B. The MIT Press; Cambridge Massachusetts (US): 2012. Tucker, Innovation, dual use and security:managing the risks of emerging biological and chemical technologies. [Google Scholar]
- 21.Tian D.Q. Bibliometric analysis of the most concerned life science dual-use research literature. Lett. Biotechnol. 2016;5:684–687. doi: 10.3969/j.issn.1009-0002. [DOI] [Google Scholar]
- 22.Scientific Gryphon. Risk and Benefit Analysis of Gain-of-Function Research, Final Report. 2016. http://www.gryphonscientific.com/wp-content/uploads/2016/04/Risk-and-Benefit-Analysis-of-Gain-of-Function-Research-Final-Report.pdf (accessed 13 April 2017)
- 23.Zhou D.S., Song H.B., Wang J.W., Li Z.J., Xu S., Ji X.Z., Hou X.X., Xu J.G. Biosafety and biosecurity. J. Biosafety and Biosecurity. 2019;1:15–18. doi: 10.1016/j.jobb.2019.01.001. [DOI] [PMC free article] [PubMed] [Google Scholar]
- 24.Langlois R.A., Albrecht R.A., Kimble B., Sutton T., Shapiro J.S., Finch C., Angel M., Chua M.A., Gonzalez-Reiche A.S., Xu K., Perez D., García-Sastre A., Tenoever B.R. MicroRNA-based strategy to mitigate the risk of gain-of-function influenza studies. Nat. Biotechnol. 2013;9:844–847. doi: 10.1038/nbt.2666. [DOI] [PMC free article] [PubMed] [Google Scholar]
- 25.Rovner A.J., Haimovich A.D., Katz S.R., Li Z., Grome M.W., Gassaway B.M., Amiram M., Patel J.R., Gallagher R.R., Rinehart J., Isaacs F.J. Recoded organisms engineered to depend on synthetic amino acids. Nature. 2015;7537:89–93. doi: 10.1038/nature14095. [DOI] [PMC free article] [PubMed] [Google Scholar]
Associated Data
This section collects any data citations, data availability statements, or supplementary materials included in this article.
Supplementary Materials
Supplementary material