

Abstract
A recent study has suggested that aggressive (AGG) and non-aggressive, rule-breaking (RB) antisocial behavior evidence differential and subtype-specific patterns of genetic expression during development. Namely, although genetic influences on RB increase dramatically during early- to mid-adolescence, genetic influences on AGG appear to remain stable. As no other study has examined age-related change in AGG versus RB, more research is clearly needed before any firm conclusions can be drawn. The current study thus examined whether and how age impacted genetic and environmental influences on AGG and RB in a sample of 252 10- to 15-year-old twin pairs assessed as part of the Michigan State University Twin Registry (MSUTR). Results constructively replicated and extended prior findings, indicating that while the magnitude of genetic and environmental influences on AGG remained stable across adolescence, genetic influences on RB increased dramatically with age. Such findings provide additional support for etiological distinctions within the broader construct of antisocial behavior based on the presence or absence of aggression, and offer insights into the expression of genetic influences during development.
Keywords: genetic influences, age, aggression, rule-breaking, twins
Developmental timing constitutes a core difference between physical aggression and non-aggressive, rule-breaking behaviors, the two primary behavioral sub-types within the broader construct of antisocial behavior. Physical aggression first manifests in early-childhood (Tremblay, 2003); in fact, aggression is most prevalent during the toddler years, after which mean levels decrease (though they may increase again briefly during mid-adolescence) (Stranger, Achenbach, & Verhulst, 1997; Tremblay, 2003). Even so, aggression exhibits high levels of rank-order stability across development, such that those with the highest levels of aggression as children continue to be particularly aggressive as adults (Tremblay, 2003). Non-aggressive, rule-breaking behaviors evidence a very different pattern. They are relatively rare in childhood, increase dramatically from mid- to late-adolescence (i.e., during high school and perhaps college), and then dissipate following the transition into adulthood (Stanger et al., 1997). Further, they are far less stable during development, evidencing lower levels of rank-order stability (Stanger et al., 1997). Indeed, so noteworthy are the differences between the two behavioral sub-types that they have been incorporated into Moffitt’s seminal theory of antisocial behavior (Moffitt, 1993). Rule-breaking behaviors are thought to characterize adolescent-limited antisocial behavior, whereas aggression is thought to be largely specific to life-course persistent antisocial behavior (see review by Moffitt, 2003).
Given these developmental differences in the phenotypes of aggression versus rule-breaking, a recent study asked whether the developmental timing of genetic expression also varied across the two sub-types (Burt & Neiderhiser, in press). Burt & Neiderhiser (in press) examined age-related etiological change in aggressive versus rule-breaking antisocial behavior in a sample of 720 10- to 18-year-old sibling pairs with varying degrees of genetic relatedness. Cross-sectional analyses revealed that the magnitude of genetic and environmental influences on aggression remained stable across adolescence, whereas genetic influences on rule-breaking nearly tripled in magnitude from age 10 to age 15, after which they slowly decreased. Subsequent longitudinal analyses fully supported these findings. When combined with prior research indicating that genetic influences on aggression increase from age 3 to age 7 and then stabilize (van Beijsterveldt, Bartels, Hudziak, & Boomsma, 2003) (as well as the phenotypic research highlighted above), such findings imply that genetic influences on aggression and rule-breaking are expressed during childhood and adolescence, respectively.
One prominent theoretical concept that may explain at least some of these developmental shifts in genetic expression is that of the active gene-environment correlation (i.e., active rGE), in which individuals select environmental experiences consistent with their genotype (Plomin, DeFries, & Loehlin, 1977; Scarr & McCartney, 1983). Scarr & McCartney (1983) postulated that as children age, they exert increasingly greater control over the environments they experience, progressively shaping their environments to be consistent with their genetic predispositions. The relative importance of active rGE is thus thought to change across development, such that it has less impact in childhood and becomes progressively more important as children transition into adolescence and adulthood. This increasing influence of active rGE should manifest as increasing genetic influences from childhood to adulthood. Put differently, as individuals exert an increasingly greater impact on the environments they experience, their genetic predispositions should be more fully expressed.
Given this, the results of Burt & Neiderhiser (in press) imply that aggression and rule-breaking may be differentially susceptible to active rGE. In particular, because active rGE seems likely to induce increasing heritability during adolescence in particular (the developmental period most characterized by increasing independence from parental decision-making), it may be that rule-breaking is particularly responsive to active rGE. By contrast, if the genes contributing to aggression are first expressed during early- to mid-childhood (as suggested by van Beijsterveldt et al., 2003), a more limited role for active rGE processes in aggression may be implied. If these findings (and subsequent interpretations) are correct, they would highlight a potential avenue for intervention in the case of rule-breaking (e.g., identify and prevent exposure to rGE triggers).
However, outside of Burt & Neiderhiser (in press), we know of no study1 that explicitly examines timing of genetic expression for aggression versus rule-breaking. Until these results are replicated in an independent sample, any conclusions must remain somewhat speculative. Moreover, Burt & Neiderhiser (in press) used aggression and rule-breaking scales fashioned out of the relatively short antisocial behavior scale on the Behavior Problems Index (Zill, 1985). Replication using more comprehensive and better-validated indices of aggression and rule-breaking, such as those in the well-regarded Child Behavior Checklist (CBCL) (Achenbach & Rescorla, 2001), would certainly augment prior findings. The current study sought to do just this, and in this way, strengthen our confidence that aggressive and rule-breaking antisocial behavior evidence distinctive patterns of etiological moderation by age.
METHODS
PARTICIPANTS
The MSUTR includes several independent twin projects (Klump & Burt, 2006). The 252 same-sex twin pairs included in the current study were assessed as part of one of the two adolescent projects within the MSUTR: the Adolescent Twin Study of Behavioral Adjustment and Development (ATSBAD; n=144 pairs; 67% female) and the Twin Study of Behavioral and Emotional Development in Adolescents (TBED-A; n=108 pairs, 49% female). Both projects required that neither twin had a cognitive or physical handicap that would preclude completion of our on-site assessments. However, exclusion criteria for the ATSBAD also included current medication use (i.e., oral contraceptives, antibiotics, psychotropic or other medications) or medical conditions (e.g., diabetes) that could affect steroid hormone levels (a primary focus of that study). Adolescents gave informed assent, while parents gave informed consent for themselves and their children. Twins ranged from ages 10 to 15 (n= 84, 101, 110, 97, 80, and 31 at ages 10, 11, 12, 13, 14, and 15, respectively).
For both projects, families were recruited via State of Michigan birth records in collaboration with the Michigan Department of Community Health (MDCH). The MDCH manages birth records and can identify all twins born in Michigan. Birth records are confidential in Michigan; thus, the following recruitment procedures were designed to ensure anonymity of families until they indicate an interest in participating. MDCH identified twins who met the study’s criteria and made use of the Michigan Bureau of Integration, Information, and Planning Services database to locate current addresses through parent drivers’ license information. MDCH then mailed pre-made recruitment packets to parents. A reply postcard was included for parents to indicate their interest in participating. Interested families were then contacted directly by project staff. Parents who did not respond to the first mailing were sent additional mailings approximately one month apart until either a reply was received or up to four letters had been mailed. Though we cannot be sure how many families actually received the recruitment packets, we typically receive reply postcards from 45–52% of recruited families (roughly 10% are undeliverable). These response rates are similar to those of other twin registries that use similar types of anonymous recruitment mailings (Baker, Barton, & Raine, 2002; Hay, McStephen, Levy, & Pearsall-Jones, 2002). Moreover, participating families endorsed ethnic group memberships at rates comparable to other area inhabitants (e.g., Caucasian: 83.7% and 85.5%, African-American: 7.2% and 6.3% for the participating families and the 2005 local census, respectively). Parental education was also generally comparable to that of the area population (i.e., high school graduates: 93.8% and 89.4% for the participating families and the 2005 local census, respectively). Such results suggest that our recruitment strategy yields a sample that is broadly representative of the area population.
Zygosity was established using physical similarity questionnaires administered to the twins’ primary caregiver (Peeters, Van Gestel, Vlietinck, Derom, & Derom, 1998), as well as a research assistant who independently evaluated the twins on physical similarity indices. Zygosities were then compared between the participant and research assistant reports. Discrepancies were resolved through review of questionnaire data and twin photographs (when available) by one of the MSUTR principal investigators (KLK or SAB) or by DNA markers. On average, the physical similarity questionnaires used by the MSUTR have accuracy rates of 95% or better.
MEASURES
Mothers completed the Child Behavior Checklist (CBCL; Achenbach & Rescorla, 2001) separately for each twin. Mothers were asked to rate the extent to which a series of statements described each of their children’s behavior over the past six months using a three point scale (0=never to 2=often/mostly true). We utilized the well-known aggressive (e.g. “bullied”, “cruel”, “gets in fights”, “attacks people”; 18 items; α = .87) and rule-breaking (e.g. “cheat or lie”, “breaks rules”, “no guilt”, “steals”; 17 items; α = .75) scales. Higher scores reflect endorsement of more aggressive and/or rule-breaking behaviors. Consistent with recommendations in the manual (Achenbach & Rescorla, 2001), analyses were conducted on the raw scale scores.
STATISTICAL ANALYSES
Behavioral genetic analyses make use of the difference in the proportion of genes shared between reared-together siblings: monozygotic twins (MZ; who share 100% of their genetic material) and dizygotic twins (DZ; who share an average of 50% of their segregating genetic material). Utilizing these differences, the variance within observed behaviors or characteristics (i.e., phenotypes) is partitioned into three components, additive genetic (a2), shared environment (c2), and non-shared environment plus measurement error (e2). The additive genetic component (a2) is the effect of individual genes summed over loci, and acts to increase twin correlations relative to the amount of genes shared. The shared environment (c2) is that part of the environment common to siblings that acts to make them similar to each other. The non-shared environment (e2) encompasses environmental factors (and measurement error) differentiating twins within a pair. More information on genetically-informative studies is provided elsewhere (Plomin, DeFries, McClearn, & McGruffin, 2008).
We evaluated the impact of age on the etiology of RB and AGG via a series of nested moderation models (Purcell, 2002). Models were run separately for each measure, as models that would allow age to simultaneously and differentially moderate both AGG and RB are not currently available. The first and least restrictive model allows for both linear and non-linear moderation of the genetic, shared, and non-shared environmental contributions (i.e., a, c, e) to AGG and RB. At each age, linear (i.e., A1, C1, E1) and non-linear (i.e., A2, C2, E2) moderators are added to these genetic and environmental paths using the following equation: Unstandardized VarianceTotal = (a + A1(age) + A2(age2))2+ (c + C1(age) + C2(age2))2 + (e + E1(age) + E2(age2))2. We then fit a series of more restrictive moderator models for each measure, constraining the moderators for each source of etiological influence to be zero and evaluating the reduction in model fit.
Several steps of data preparation were necessary for these analyses. First, we log-transformed each scale to better approximate normality (skew following transformation was 1.17 for RB and 0.16 for AGG). We then standardized the log-transformed scale scores to facilitate interpretation of the unstandardized values (i.e., Purcell (2002) recommends that unstandardized estimates be presented for these models, as the more typical standardized estimates can obscure absolute changes across levels of the moderator). We also subtracted 10 from each age, thereby bringing the floor moderator value to 0. We next statistically controlled gender effects via regression techniques (Deater-Deckard & Plomin, 1999; McGue & Bouchard, 1984). Finally, Purcell (2002) reports that quadratic moderator models are prone to local minima, and should therefore be run at least five times using multiple start values to ensure that the obtained estimates do in fact minimize minus twice the log-likelihood (−2lnL). This procedure was implemented.
Because these interaction models effectively involve fitting a separate biometric model for each individual as a function of their age, they require the use of Full-Information Maximum-Likelihood raw data techniques (FIML). Mx, a structural-equation modeling program (Neale, 1997), was used to fit models to the transformed raw data. When fitting models to raw data, variances, covariances, and means of those data are freely estimated by minimizing minus twice the log-likelihood (−2lnL). The minimized value of −2lnL in the full moderation model is compared with the −2lnL obtained in more restrictive moderator models to yield a likelihood-ratio χ2 test for the significance of the moderator effects. Non-significant changes in chi-square indicate that the more restrictive model (i.e., that model with fewer parameters and thus more degrees of freedom) provides a better fit to the data. The chi-square was then converted to the Akaike’s Information Criterion (AIC; AIC = χ2 - (2*df); Akaike, 1987), so as to measure model fit relative to parsimony. AIC is the most commonly employed fit index within the field of behavioral genetics. The lowest AIC among a series of nested models is considered best.
RESULTS
Descriptives
Mean levels of AGG (4.1 (SD = 4.5) and 3.0 (SD = 3.9) for boys and girls, respectively) and RB (1.6 (SD = 2.6) and 0.8 (SD = 1.4) for boys and girls, respectively) varied significantly by gender, such that boys evidenced higher rates of these behaviors than did girls (both p<.05). Age was not associated with mean levels of AGG or RB, results that likely reflect the narrow age-range of the current samples. However, as noted by Purcell (2002), phenotypic associations with the moderator are not a prerequisite for significant moderation, in part because such associations may be attenuated by genetic and environmental moderation.
Mean levels of AGG and RB varied to some extent by project, with lower levels reported in the ATSBAD than in the TBED-A (standardized effect sizes (ES) were −.30 and −.33 for RB and AGG in girls and −.42 for AGG in boys, all p<.05), though mean levels of RB in boys did not vary across sample (ES = −.09, p=.51). The existing differences are likely due to the ATSABD’s additional requirement that neither twin take medications (including psychotropic medications such as Ritalin, Prozac, etc.). Importantly, however, when analyses were restricted to the ATSBAD sample alone, results were notably similar to those reported herein. Analyses reported here thus included participants from both samples.
Intraclass correlations
Intraclass correlations were calculated using the double-entry method, which removes the variance associated with the ordering of siblings within a pair. These correlations offer a preliminary indication of genetic and environmental influences on RB and AGG. For these analyses, the sample was divided into two groups: early-adolescence (ages 10–13) and mid-adolescence (ages 14–15) (note that our formal age moderation analyses did not sub-divide the sample in this way, but made use of participants’ actual age). The specific age cut point was the same as that used in Burt & Neiderhiser (in press). Higher MZ twin than DZ twin correlations implicate genetic influences.
As seen in Table 1, MZ correlations were generally larger than their corresponding DZ correlations, suggesting that genetic effects are important for AGG and RB during both early- and mid-adolescence. However, close inspection across age and sub-type reveals some key differences. For RB, the MZ-DZ difference was far larger in mid-adolescence as compared to early-adolescence, tentatively suggesting that genetic influences on RB may increase from early- to mid-adolescence. By contrast, genetic influences on AGG did not appear to shift appreciably across adolescence, as the magnitude of the difference between MZ and DZ correlations remained essentially constant (though it was no longer significant in the older group). Such findings are suggestive of differential etiological moderation of AGG and RB.
Table 1.
Twin Intraclass Correlations for Aggressive (AGG) and Rule-Breaking (RB) Antisocial Behavior by Age-Range.
| RB | AGG | N | |
|---|---|---|---|
| Younger (between ages 10–13) | |||
| MZ | .74* | .70* | 100 |
| DZ | .53* | .45* | 96 |
| Older (between ages 14–15) | |||
| MZ | .90* | .73 | 31 |
| DZ | .13* | .50 | 25 |
Note. Monozygotic (MZ) twins share 100% of their genetic material and dizygotic (DZ) twins share an average of 50% of their genetic material. N corresponds to the number of twin pairs. All correlations were significantly larger than zero at p<.01 (except for RB in older DZ twins, which was not significantly greater than zero).
MZ correlations are significantly larger than the corresponding DZ correlation at p<.05.
Moderator models
Test statistics for a series of nested moderator models are reported separately for each sub-type in Table 2. We compared the −2lnL obtained in the least restrictive model to the −2lnL found for the more restrictive model to yield likelihood-ratio χ2 and AIC tests of the constraints implied by the more restrictive model. For AGG, there was little evidence of etiological moderation by age. None of the individual moderators (i.e., A, C, or E) were statistically significant. Indeed, all linear and quadratic moderators could be fixed to zero without a significant decrement in fit, as indicated by the non-significant change in chi-square and the lower AIC value. Such results suggest that the magnitude of genetic and environmental contributions to AGG does not vary across early- to mid-adolescence. By contrast, there was evidence of etiological moderation by age for RB. Fixing the A moderators to zero resulted in a significant decrement in fit, suggesting that the magnitude of genetic influences on RB varies across age. The environmental moderators, however, could be fixed to zero without a significant decrease in fit, suggesting minimal shifts in environmental influences on RB with age.
Table 2.
Indices of fit for a Series of Nested ACE Models Examining the Etiology of Aggressive (AGG) and Rule-Breaking (RB) Antisocial Behavior.
| Measure | Model | −2lnL | df | AIC | Δχ2 | Δdf | p-value |
|---|---|---|---|---|---|---|---|
| AGG | |||||||
| 1) Full model | 1300.22 | 492 | 316.22 | ---- | ---- | ---- | |
| 2) No A moderation | 1301.19 | 494 | 313.19 | 0.97 | 2 | ns | |
| 3) No C moderation | 1301.67 | 494 | 313.67 | 1.45 | 2 | ns | |
| 4) No E moderation | 1302.11 | 494 | 314.11 | 1.89 | 2 | ns | |
| 5) No moderation | 1304.64 | 498 | 308.64 | 4.42 | 6 | ns | |
| RB | |||||||
| 1) Full model | 1269.81 | 492 | 285.81 | ---- | ---- | ---- | |
| 2) No A moderation | 1276.55 | 494 | 288.55 | 6.74 | 2 | .034 | |
| 3) No C moderation | 1272.10 | 494 | 284.10 | 2.29 | 2 | ns | |
| 4) No E moderation | 1271.66 | 494 | 283.66 | 1.85 | 2 | ns | |
| 5) No C or E moderation | 1273.64 | 496 | 281.64 | 3.83 | 4 | ns | |
Note. A, C, and E represent genetic, shared environmental, and non-shared environmental parameters. The fit indices for a series of nested ACE moderator models are presented for each sub-type. The fit of each model is compared to that of the least restrictive model (i.e., model#1; allows for linear and quadratic ACE moderation). Non-significant changes in chi-square indicate that the more restrictive model (i.e., that model with fewer estimated parameters and therefore more degrees of freedom) provides a better fit to the data, as does the lowest AIC value. The best-fitting model for each sub-type is highlighted in bold font. Thus, for AGG, the best-fitting model was the main effects model (i.e., there was no etiological moderation by age), whereas for RB, the best-fitting model allowed for linear and quadratic moderation of genetic influences.
For the best-fitting models, we made use of the estimated paths and moderators (presented in Table 3) to calculate and plot (see Figure 1) the unstandardized genetic and environmental variance components at each age using the following equation: VarianceGenetic = (a + A1(age) + A2(age2))2. For AGG, the plots are flat because neither linear nor quadratic moderators were statistically significant (i.e., the genetic and environmental path estimates apply to all ages). Only genetic and non-shared environmental influences made statistically detectable etiological contributions to AGG (49% and 29% of the variance, respectively). Shared environmental contributions (22% of the variance) were not statistically significant.
Table 3.
Unstandardized path and moderator estimates in the best-fitting models for Aggressive (AGG) and Rule-Breaking (RB) Antisocial Behavior.
| Measure | PATHS | LINEAR | QUADRATIC | ||||||
|---|---|---|---|---|---|---|---|---|---|
| a | c | e | A1 | C1 | E1 | A2 | C2 | E2 | |
| AGG | .699 (.463, .896) | .468 (−.696, .696) | .537 (.478, .609) | ---- | ---- | ---- | ---- | ---- | ---- |
| RB | .705 (.412, .963) | .417 (−.668, .668) | .471 (.420, .534) | −.034 (−.268, .170) | --- | ---- | .021 (−.022, .068) | ---- | ---- |
Note. Paths and moderators are presented; their 95% confidence intervals are presented below them in brackets. A, C, and E (both upper and lower case) represent genetic, shared, and non-shared environmental parameters, respectively. In the left portion of the table, the path estimates (i.e., a, c, and e) are presented. Because we subtracted 10 from each age prior to data analysis (setting the floor to 0), these path estimates function as intercepts. Accordingly, the genetic and environmental variance components at age 10 can be obtained simply by squaring these path estimates. At each subsequent age, significant linear (i.e., A1, C1, E1) and non-linear (i.e., A2, C2, E2) moderators are added to these genetic and environmental paths using the following equation: Unstandardized VarianceTotal = (a + A1(age) + A2(age2))2 + (c + C1(age) + C2(age2))2 + (e + E1(age) + E2(age2))2. The variance component estimates calculated in this way are then presented in Figure 1, separately by sub-type. Bold font indicates that estimate is significant at p<.05.
Figure 1. Unstandardized Variance Components in Aggressive (AGG) and Rule-Breaking (RB) Antisocial Behavior across Early- to Mid-Adolescence.
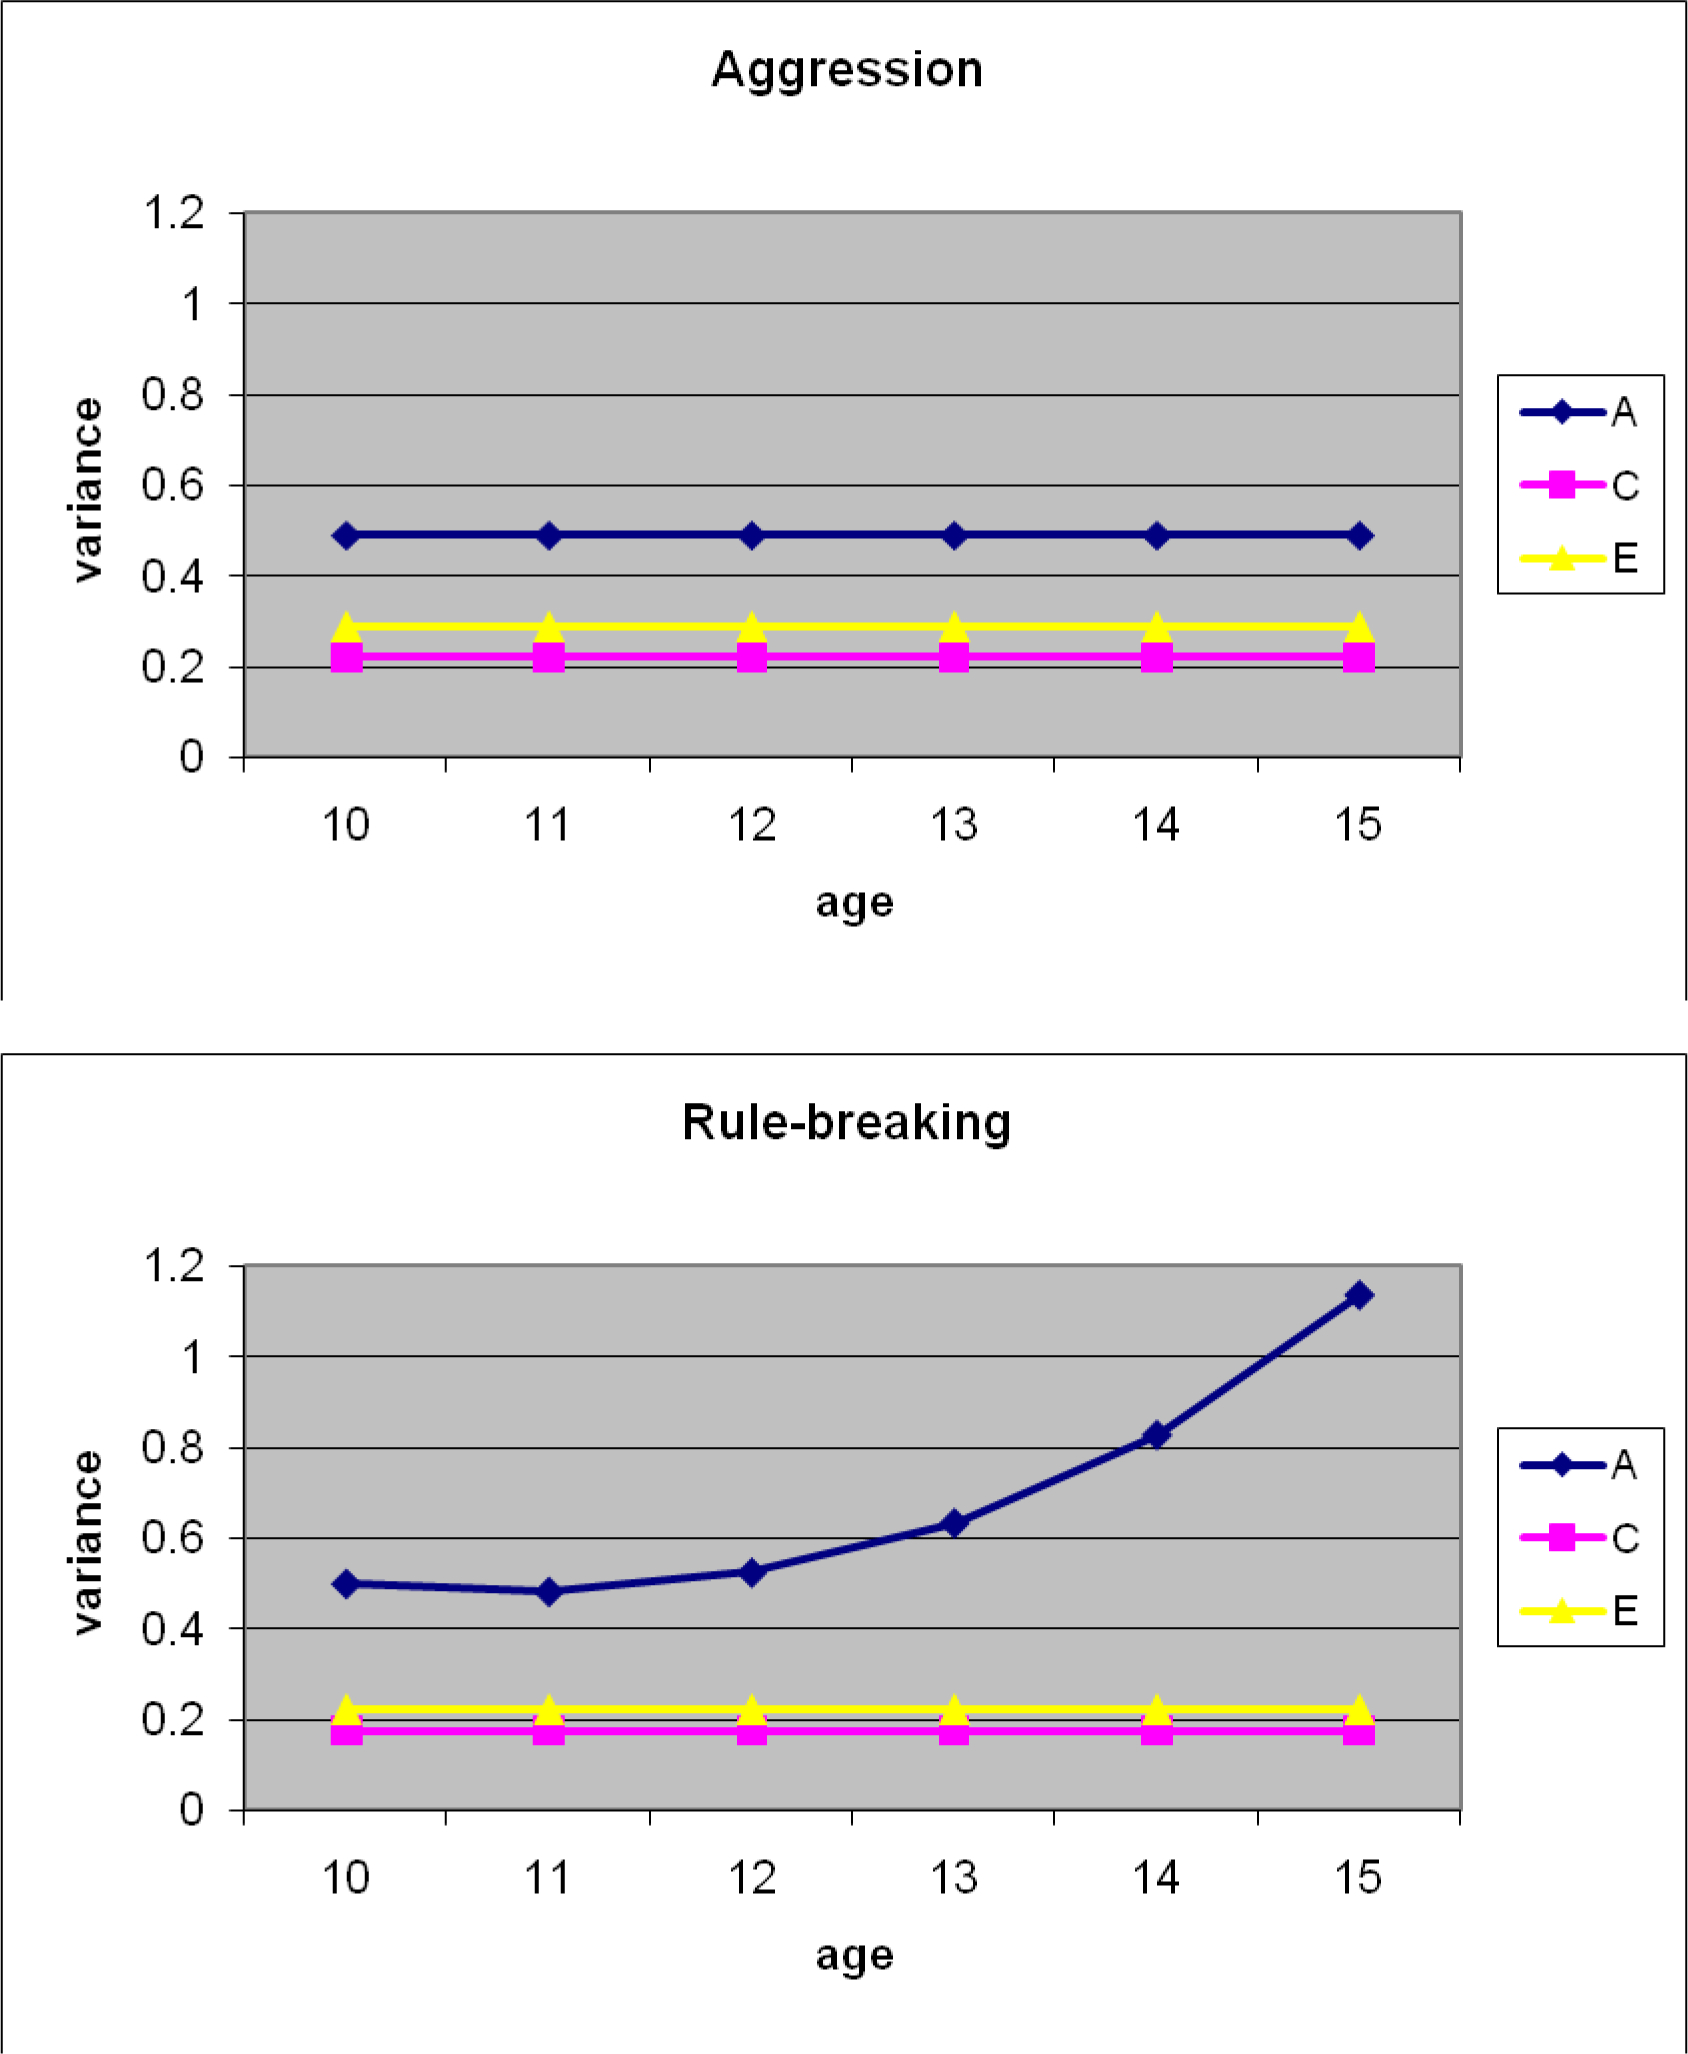
Note. A, C, and E represent genetic, shared, and non-shared environmental variance components, respectively. These estimates index the absolute changes in genetic and environmental variance in AGG and RB from ages 10 to 15.
For RB, only genetic and non-shared environmental influences were significant at age 10. Shared environmental influences made a moderate, though non-significant contribution. Although neither of the genetic moderators was individually significant, we could not drop both from the model without a significant decrement in fit (as noted above). In short, while the model clearly suggests the presence of genetic moderation of RB with age, it is unclear whether this moderation is linear or non-linear in nature. When plotted, results suggest that genetic influences on RB increase substantially from early- to mid-adolescence, more than doubling in magnitude. Non-shared and shared environmental parameters, by contrast, remained stable across adolescence.2
DISCUSSION
The aim of the present study was to replicate prior findings (Burt & Neiderhiser, in press) suggesting that genetic influences on RB, but not AGG, increase dramatically over the course of early- to mid-adolescence. We examined AGG and RB scales from the well-known CBCL in an independent sample of adolescent twins. Results revealed that AGG remained etiologically stable across adolescence, whereas genetic influences on RB increased substantially (more than doubling in magnitude) from age 10 to age 15. Such findings offer key support for prior findings of distinctive patterns of etiological moderation by age across aggression and rule-breaking forms of antisocial behavior, indicating that these results are largely robust to sampling variation and persist across multiple measures of these constructs.
These findings are generally consistent with those of other studies. Other twin and adoption studies of aggression have reported strong genetic influences on aggression (50–65% of the variance) and smaller shared environmental influences (Burt, 2009), results that were generally replicated here. Further, the very high heritability of RB in mid-adolescence is quite consistent with that reported in Burt & Neiderhiser (in press). By contrast, our finding of insignificant shared environmental influences on RB is less consistent with prior work (Burt, in press), as is our finding of no shared environmental moderation with age (Burt & Neiderhiser, in press). Though the exact cause of these differences remains unclear, they may in part reflect our rather small sample size (and the corresponding reduction in statistical power), as larger samples are required to simultaneously detect genetic and shared environmental influences.
There are some limitations to consider when interpreting our findings. First, we did not examine how age-of-onset of AGG and RB impacted our results. However, because of the close link between aggression and early-onset ASB (Moffitt, 1993, 2003), and between rule-breaking and adolescent-onset ASB, our findings are at least circumstantially tied to Moffitt’s (1993) developmental taxonomy. Next, due to sample size considerations, gender was regressed out of AGG and RB prior to analysis. Fortunately, prior studies (Burt, 2009; Rhee & Waldman, 2002) have suggested that heritability estimates for ASB do not vary across gender, suggesting that our exclusion of gender is unlikely to have impacted our results. Even so, future analyses should evaluate whether gender further moderates the impact of age. Finally, neither of the genetic moderators for RB was individually significant. Such findings are very likely a reflection of the reduced power inherent in small sample sizes. Even so, we could not drop both genetic moderators from the model without a significant decrement in fit, indicating that while it is unclear whether the genetic moderation is linear or non-linear in nature, there is clear evidence for the genetic moderation of RB with age.
The results of the current study highlight the utility of explicitly examining the moderating role of age to understand timing of genetic expression. Our results indicate that genetic influences on RB may increase rather dramatically from early- to mid-adolescence, constructively replicating those of Burt & Neiderhiser (in press). Such findings are at least consistent with a prominent role for active rGE in the development of non-aggressive delinquency, such that individuals seek out experiences consistent with their genotypes that then serve to further activate their genetic predispositions. One likely mechanism for these active rGE effects is deviant peer affiliation, particularly as there is evidence to suggest that affiliation with deviant peers exacerbates antisocial behaviors (Deater-Deckard, 2001), and moreover, that rule-breaking is more frequently committed in the company of peers (Gardner & Steinberg, 2005).
By contrast, the magnitude of genetic influences on AGG remained constant, results that again replicate those of Burt & Neiderhiser (in press). Such findings suggest that although genetic influences on RB may not fully express themselves until adolescence, this timeline does not apply to all forms of antisocial behavior. Instead, it may be that genetic influences on AGG are initially expressed in early childhood after which they stabilize, consistent with the findings of van Beijsterveldt et al. (2003). As the theory of rGE postulates that active rGE exerts relatively little influence until late childhood or early adolescence (Scarr & McCartney, 1983), such findings are may be suggestive of a more limited role for active rGE processes in the development of aggression. Indeed, building on the example of deviant peer affiliation mentioned above, there is evidence to suggest that although aggressive youth will aggress in the company of friends, they are just as likely to initiate fights and other aggressive acts when alone (Moffitt, 1993, 2003), a pattern of behavior that is not applicable to the more “sociable” rule-breaking.
Acknowledgments
This work was supported by grants from the National Institute on Mental Health (MH 63851, MH 70542) awarded to Dr. Klump and by institutional grants from Michigan State University awarded to Drs. Klump and Burt.
Footnotes
We know of at least one other study contrasting the etiology of aggression and rule-breaking over time (Eley, Lichtenstein, & Moffitt, 2003). Importantly, however, Eley et al. (2003) was focused primarily on understanding etiological continuity across age rather than etiological change with age. As a result, the parameter estimates reported in Eley et al. (2003) were standardized at each age (i.e., genetic variance was divided by the total variance to yield a proportional estimate of genetic influence). This is a critical point because although the decision to standardize is appropriate for examining the origins of stability over time (as was the goal in the above study), it is much less useful for examining the origins of change. To examine etiological change, it is strongly recommended that researchers report unstandardized or absolute parameter estimates, as proportional estimates can mask absolute changes across age (Purcell, 2002). Eley et al. (2003) is thus not directly relevant to the goals of the current study.
To ensure that our results were not driven solely by the relatively small number of 15 year-olds twins in our dataset, we repeated analyses omitting these twins from the sample. For AGG, there was again no evidence of any etiological moderation by age (full moderation: −2lnL = 1215.86 on 462 df, AIC = 291.85; no moderation: −2lnL = 1220.06 on 468 df, AIC = 284.06). By contrast, for RB, genetic moderators could not be constrained to be zero without a significant decrement in fit (full moderation: −2lnL = 1180.04 on 462 df, AIC = 256.04; no A moderation: −2lnL = 1190.22 on 464 df, AIC = 262.22). Constraining the C and E moderators, however, did not appreciably alter model fit (no C or E moderation: −2lnL = 188.06 on 466 df, Δχ2 = 10.18 on 4 df, AIC = 256.06). In short, our results appear to be robust to sampling issues.
References
- Achenbach TM, & Rescorla LA (2001). Manual for ASEBA School-Age Forms & Profiles. Burlington, VT: University of Vermont, Research Center for Children, Youth, & Families. [Google Scholar]
- Akaike H (1987). Factor analysis and AIC. Psychometrika, 52, 317–332. [Google Scholar]
- Baker LA, Barton M, & Raine A (2002). The Southern California Twin Register at the University of Southern California. Twin Research, 5, 456–459. [DOI] [PMC free article] [PubMed] [Google Scholar]
- Burt SA (2009). Are there meaningful etiological differences within antisocial behavior? Results of a meta-analysis. Clinical Psychology Review, 29, 163–178. [DOI] [PubMed] [Google Scholar]
- Burt SA (in press). Rethinking environmental contributions to child and adolescent psychopathology: A meta-analysis of shared environmental influences. Psychological Bulletin. [DOI] [PubMed] [Google Scholar]
- Burt SA, & Neiderhiser JM (in press). Aggressive versus non-aggressive antisocial behavior: Distinctive etiological moderation by age. Developmental Psychology. [DOI] [PMC free article] [PubMed] [Google Scholar]
- Deater-Deckard K (2001). Annotation: Recent research examining the role of peer relationships in the development of psychopathology. Journal of Child Psychology and Psychiatry, 42, 565–579. [PubMed] [Google Scholar]
- Deater-Deckard K, & Plomin R (1999). An adoption study of the etiology of teacher and parent reports of externalizing behavior problems in middle childhood. Child Development, 70, 144–154. [DOI] [PubMed] [Google Scholar]
- Eley TC, Lichtenstein T, & Moffitt TE (2003). A longitudinal behavioral genetic analysis of the etiology of aggressive and nonaggressive antisocial behavior. Development and Psychopathology, 15, 383–402. [DOI] [PubMed] [Google Scholar]
- Gardner M, & Steinberg L (2005). Peer influence on risk taking, risk preference, and risky decision making in adolescence and adulthood: An experimental study. Developmental Psychology, 41, 625–635. [DOI] [PubMed] [Google Scholar]
- Hay DA, McStephen M, Levy F, & Pearsall-Jones J (2002). Recruitment and attrition in twin register studies of childhood behavior: The example of the Austrailian Twin ADHD Project. Twin Research, 5, 324–328. [DOI] [PubMed] [Google Scholar]
- Klump KL, & Burt SA (2006). The Michigan State University Twin Registry (MSUTR): Genetic, environmental, and neurobiological influences on behavior across development. Twin Research and Human Genetics, 9, 971–977. [DOI] [PubMed] [Google Scholar]
- McGue M, & Bouchard TJJ (1984). Adjustment of twin data for the effects of age and sex. Behavior Genetics, 14, 325–343. [DOI] [PubMed] [Google Scholar]
- Moffitt TE (1993). Adolescence-limited and life-course-persistent antisocial behavior: A developmental taxonomy. Psychological Reveiw, 100, 674–701. [PubMed] [Google Scholar]
- Moffitt TE (2003). Life-course persistent and adolescence-limited antisocial behavior: A research review and a research agenda In The causes of conduct disorder and serious juvenile delinquency (In Lahey B, Moffitt TE, and Caspi A (Eds.) ed.). New York: Guilford. [Google Scholar]
- Neale MC (1997). Mx: Statistical modeling. (Fourth Edition). [Google Scholar]
- Peeters H, Van Gestel S, Vlietinck R, Derom C, & Derom R (1998). Validation of a telephone zygosity questionnaire in twins of known zygosity. Behavior Genetics, 28(3), 159–161. [DOI] [PubMed] [Google Scholar]
- Plomin R, DeFries JC, & Loehlin JC (1977). Genotype-environment interaction and correlation in the analysis of human behavior. Psychological Bulletin, 84, 309–322. [PubMed] [Google Scholar]
- Plomin R, DeFries JC, McClearn GE, & McGruffin P (2008). Behavioral Genetics (Fifth ed.). New York: Worth Publishers. [Google Scholar]
- Purcell S (2002). Variance components model for gene-environment interaction in twin analysis. Twin Research, 5, 554–571. [DOI] [PubMed] [Google Scholar]
- Rhee S, & Waldman ID (2002). Genetic and environmental influences on antisocial behavior: A meta-analysis of twin and adoption studies. Psychological Bulletin, 128, 490–529. [PubMed] [Google Scholar]
- Scarr S, & McCartney K (1983). How people make their own environments: A theory of genotype-environment effects. Child Development, 54, 424–435. [DOI] [PubMed] [Google Scholar]
- Stranger C, Achenbach TA, & Verhulst FC (1997). Accelerated longitudinal comparisons of aggressive versus delinquent syndromes. Development and Psychopathology, 9, 43–58. [DOI] [PubMed] [Google Scholar]
- Tremblay RE (2003). Why socialization fails: The case of chronic physical aggression In Lahey B, Moffitt TE & Caspi A (Eds.), The causes of conduct disorder and serious juvenile delinquency. New York: Guilford. [Google Scholar]
- van Beijsterveldt CEM, Bartels M, Hudziak JJ, & Boomsma DI (2003). Causes of stability of aggression from early childhood to adolescence: A longitudinal genetic analysis in Dutch twins. Behavioral Genetics, 33, 591–605. [DOI] [PubMed] [Google Scholar]
- Zill N (1985). Behavior Problems Scale Developed for the 1981 Child Health Supplement to the National Health Interview Survey. Washington DC: Child Trends, Inc. [Google Scholar]