Abstract
Objectives:
The traditional approach of developing a new delivery system is an exhaustive task and requires a number of resources like manpower, money, material, and time. To overcome this problem Quality by Design (QbD) can be utilized to obtain pharmaceutical products of desired (best) quality with minimum use of the above resources as well as determination of the impact of one factor over the desired associated process. The present research is focused on establishing a design for formulating optimized gelatin microspheres using QbD.
Materials and Methods:
Repressible released embedded microspheres of L-arginine were prepared by performing cross linking of gelatin using glutaraldehyde. Characterization of the formulated embedded microspheres was done based on infrared spectroscopy, scanning electron microscopy, percentage yield, microsphere size, drug entrapment efficiency, and drug release. The impact of concentrations of gelatin and ethyl cellulose was determined over dependent response like percentage yield, microsphere size, and drug entrapment efficiency.
Results:
A response surface curve was obtained using a 32 central composite design and the optimized batch was obtained with percentage yield, microsphere size, and drug entrapment efficiency of 89.98, 333.32 mm, and 82.61%, respectively. Validation of the optimized batch was done by formulating four different batches with optimized values of independent response and a comparison of the observed responses with the predicted ones was set up and all these batches were found close to the predicted values and show the validity of the optimized data.
Conclusion:
The QbD approach is quite efficient to get optimized drug delivery systems of L-arginine without exhaustive study.
Keywords: L-arginine, gelatin, central composite design, microspheres, characterization of microspheres
INTRODUCTION
Quality by Design (QbD) is a helpful tool for systemic development of drug formulations based on sound scientific principles; it refers to the successful achievement of predictable quality with desired predetermined specification and without doing exhaustive conventional study.1 The QbD paradigm of drug regulation necessitates very good understanding of the product to overcome future product failures.2 Design of experiment and response surface method help in finding the individual as well as combined effects of variables on a product.3,4
Oral controlled release formulations are developed to lessen the problems associated with oral conventional dosage forms; for example, they can reduce side effects and improve therapeutic efficacy by delayed/prolonged drug release so that the frequency of drug administration can be reduced, thus assuring better patient compliance.5,6 Various techniques have been developed for controlled release formulations; they utilize the cross-linking ability of polyelectrolyte in the presence of counter ions to form a multiparticulate system. These delivery systems are spherical cross linked hydrophilic polymeric systems, which upon gelation and swelling in simulated biological fluids release the drug in a controlled manner. These developed microspheres can be loaded with high amounts of drug compared to the conventional delivery system.7,8
Arginine, an ergogenic (i.e., performance enhancing) supplement, most notably in the nitric oxide (NO) class of supplements, is a semi-essential amino acid involved in multiple areas of human physiology and metabolism. NO produced from it improves outcomes in various diseases.9 L-arginine is readily available over the counter and is popular as a nutritional supplement to increase muscle mass. Recently, L-arginine has been tested as a potential therapeutic in numerous acute and chronic disease states, including sickle cell chest crisis, pulmonary artery hypertension, coronary heart disease, pre-eclampsia, and myocardial infarction, because of its bronchodilator and vasodilator actions.10,11
MATERIALS AND METHODS
Materials
L-arginine was obtained from CDH Laboratory Chemicals and sodium alginate (low viscosity grade, 250 cp of 2% solution at 25°C) from Loba Chemie Pvt. Ltd (Mumbai). Gelatin, ethyl cellulose (EC), and Span 80 were purchased from Thermo Fisher Scientific India Pvt. Ltd. (Mumbai). Glutaraldehyde and light liquid paraffin were procured from Loba Chemie (Mumbai). All other chemicals used in the study were of analytical grade. high performance liquid chromatography (HPLC) grade water, methanol, and potassium dihydrogen orthophosphate were purchased from Qualigens Fine Chemicals (Gujrat).
Methods
Preparation of microspheres
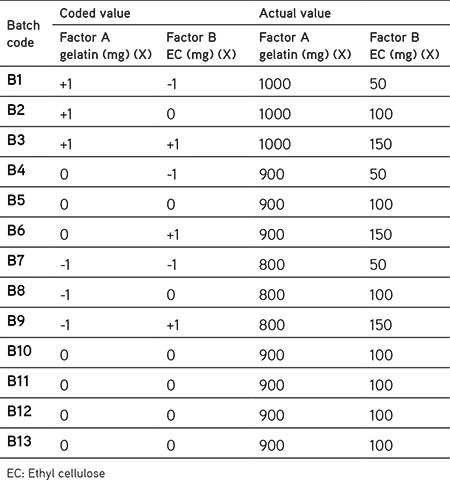
Controlled release microspheres of L-arginine were prepared by cross linking of gelatin using glutaraldehyde. The required amount of gelatin was placed in a beaker; to this 8 mL of distilled water was added and this mixture was heated at 40°C for 3-4 min to get a uniform polymer mixture. Different concentrations of EC were added as shown in Table 1. Then the specified amount of drug was dispersed thoroughly to the polymer solution. A mixture of light liquid paraffin (200 mL) and Span 80 (0.1 mL) was prepared. The mixture was maintained at 4°C with an ice bath and stirred at 200 rpm and to this mixture previously prepared polymeric drug solution was added through a syringe with a 22-gauge needle. After some time glutaraldehyde (2 mL) was added dropwise to it with continuous stirring for 2 h. The microspheres were filtered, washed with iso-propyl-alcohol to remove the liquid paraffin, and dried at room temperature. Then the dried microspheres were collected, weighed, and stored.12,13
Table 1. Formulation design and their coded value.
32 central composite design
A 32 central composite design (CCD) was adopted for the optimization study. The two independent variables investigated were functional excipients such as concentrations of gelatin (X) and EC (Y). The impact responses of these independent variables were investigated on the dependent responses such as percentage yield, microsphere size (MS), and drug entrapment efficiency (DEE). The experimental points used according to the design are shown in Table 1.
Polynomial equations were generated and used to express the function of independent variables. A common polynomial equation to observe the effect of an independent variable can be expressed as,
where Y1 is the dependent variable and b0 is the arithmetic mean response of 13 runs.
The main independent variables, that is, effects X1 and X2, represent the average result of changing one factor at a time from its lower values to its higher values. The 32 CCD is the most efficient tool for estimating the influence of individual variables (main effects) and their interactions using minimum experimentation. In the present research, the 32 CCD was considered to be best as the values of the response surfaces were not known from the previous findings. Thus, this design was selected for optimization of the formulated microspheres.
Evaluation of prepared microspheres
Characterization of microspheres
Fourier-transform infrared (FTIR) spectra was obtained using a Jasco FTIR 6100 type A spectrometer (Japan), the sample was prepared in KBr disks, and the spectra were recorded over the wavenumber 4000-400 cm-1. All three spectra were completely analyzed.14
Percentage yield
Microspheres dried at room temperature were weighed and the percentage yield of microspheres was calculated using the formula:14
Morphological analysis
A scanning electron microscope (Zeiss, Supra 40, India) was used to characterize the surface topography of the microspheres. The microspheres were fixed on a brass support using thin adhesive tape and the samples were coated with thin layer gold under vacuum to render them electrically conductive (approximately 3000 Å). The surface picture was taken at 15 kV and 20 kV for the drug-loaded microspheres.
Particle size determination of microspheres
Particle size was analyzed by sieving. Microspheres were separated out in different size fractions by passing them through a set of sieves over 5 min. This set of sieves included standard sieves having nominal mesh apertures of 1.0 mm, 0.71 mm, and 0.5 mm (sieve no. 16, 22, and 30, respectively). The particle size distributions of the beads were determined and mean particle sizes of beads were calculated using the following formula:
Swelling index
The gelatin microspheres were kept in double distilled water for swelling for 1 h to achieve maximum swelling. Volumetric measurements were made by determining the increase in volume in the swelling medium at specific time intervals. The swelling index was calculated as follows:15
Drug entrapment efficiency
Accurately weighed drug-loaded microspheres equivalent to 100 mg of L-arginine were added to 0.1 N HCl and shaken on a mechanical shaker for 24 h. Then the solution was filtered and the drug content was estimated spectrophotometrically using HPLC (Younglin, ACME-9000, China). The drug entrapment efficiency was determined using the following formula:16
In vitro drug release
In vitro release studies were carried out on L-arginine loaded microspheres using a USP XXIV dissolution test apparatus-I (Electrolab, TDT-06T, Maharashtra, India). Weighed quantities of microcarriers equivalent to 100 mg of L-arginine were introduced into a dissolution basket and the basket was placed in 900 mL of phosphate buffer solution (pH 7.4 for 8 h) at 37±0.5°C (Ph. US 24th edn) and 50 rpm.17 Aliquots of 5 mL of solution were withdrawn at specific time intervals and replaced with fresh dissolution medium. The withdrawn samples were analyzed for drug content by HPLC (Younglin, ACME-9000, China) using a ultraviolet detector. The samples were studied at 210 nm to obtain the retention time of 2.2-2.4 min and AUC.18 The results of the in vitro release data were fitted into various release equations and kinetic models.19,20,21
Optimization and data validation
Concentrations of gelatin were selected as 1000, 900, and 800 mg, whereas for EC they were 50, 100, and 150 mg. Thirteen formulations were developed by selecting nine possible combinations among which the center point was repeated four times and the mean value was taken for further study. The dependent responses were analyzed using Design Expert® 8.0.7.1 (trial version). The models were tested for significance and the optimized batch was selected with desired values of dependent responses. Four formulations (VCB1 to VCB4) along with the optimized batch were developed and validated by response surface methodology. The observed and predicted responses were critically compared. Linear correlation plots were constructed for the chosen check-point formulations. The residual graphs between predicted and observed responses were also constructed separately and the percent prediction error (% bias) was calculated with respect to the observed responses. The optimized batch was validated taking a total of four formulations selected as check-points.
RESULTS
The FTIR profile of the formulated microspheres was obtained to identify the drug–polymer interaction. Hence the formulated microspheres were subjected to IR analysis to evaluate the possible interaction between drug and polymer. The infrared curve of pure drug and formulated microspheres shows similar peaks (Table 2, Figure 1), which confirms that there is no interaction between drug and polymer.
Table 2. IR interpretation of optimized L-arginine microspheres.
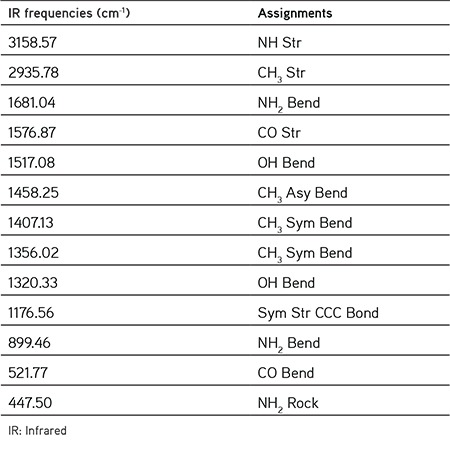
Figure 1.
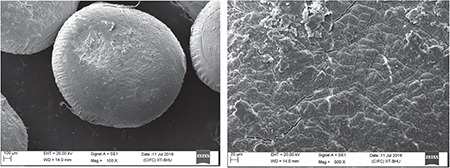
Scanning electron micrograph of microspheres, a) single bead, b) enlarged surface view
Surface topography
Scanning electron microscopy was used to investigate the surface topography of prepared microspheres and the result is shown in Figure 2.
Figure 2.
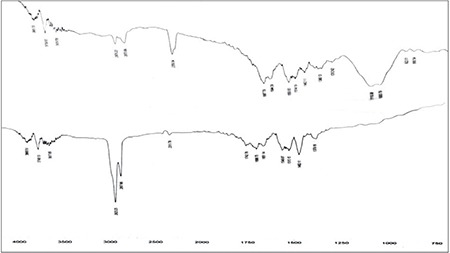
FTIR spectra of a) L-arginine and, b) formulated microspheres
FTIR: Fourier-transform infrared
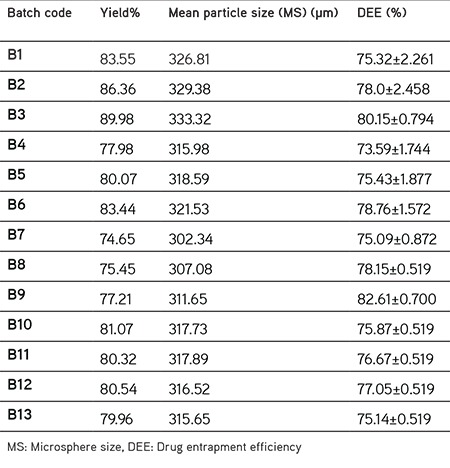
The percentage yield and mean particle size of the formulation are given in Table 3.
Table 3. Evaluation of formulated batches of microspheres.
Drug entrapment efficiency
DEE is an important variable used to assess the drug loading capacity of microspheres and their drug release profile. DEE depends upon various parameters such as the process used for preparation, physicochemical properties of the drug, and various formulation variables (Table 3).
In vitro release behavior of drug
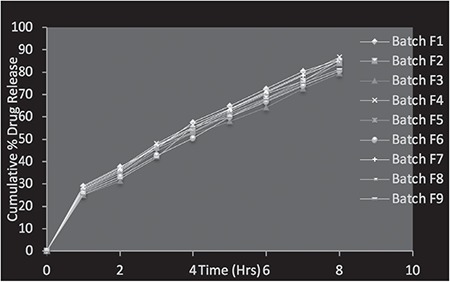
The in vitro drug release behavior of the formulated glutaraldehyde cross-linked gelatin microspheres is shown in Figure 3. All batches were studied for their drug release profile for up to 8 hits and it was observed that in all formulated systems the rate of release varied due to the use of different concentrations of dependent variables. It is clear that as the amount of EC increases from 50 to 150 mg the rate of drug release decreases, which indicates the hydrophobic nature of EC in the formulation; hence increasing amounts of EC lead to retardation in drug release. The cross linking property of glutaraldehyde leads to the formation of a rigid hydro gel to restrict leaching, thereby decreasing drug dissolution (Table 4, Figure 3).
Figure 3.
In vitro evaluation of L-arginine loaded gelatin microspheres
Table 4. Drug release kinetics study.
Data analysis and optimization
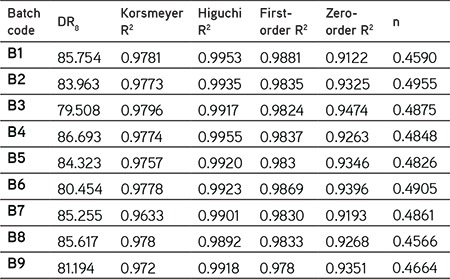
The drug release mechanism was investigated by fitting to models representing zero-order, first-order, Higuchi’s square root of time, and Korsmeyer–Peppas models. Results of ANOVA for the response surface quadratic model for various dependent parameters were as follows:
where A indicates the concentration of gelatin and B represents the concentration of EC.
Figure 4 shows response surface and contour plots for % yield, MS and DEE.
Figure 4.
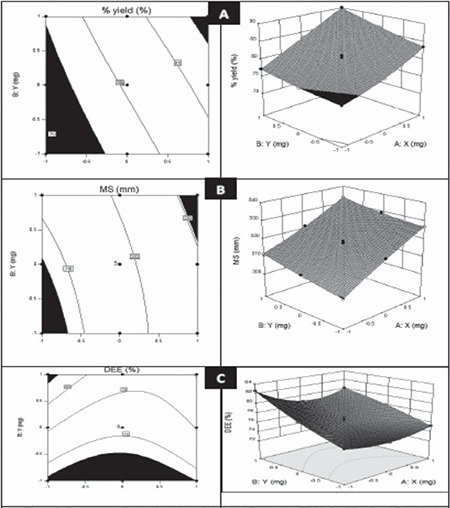
Response surface methodology and contour plots for a) percentage yield, b) microsphere size, c) drug entrapment efficiency
Validation of the statistical model
Validation of the optimized batch was done by formulating four different batches using an overlay plot (Figure 5) by utilizing the optimum value as found by statistical analysis, i.e., by considering the optimum value found (Table 5) and a comparative study was done between predicted values and observed values to determine the prediction error (Figure 6).
Figure 5.
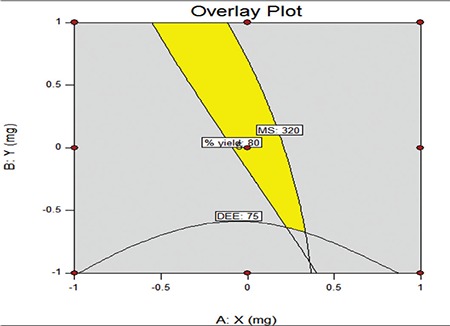
Overlay plot showing area for optimized product
Table 5. Validation checkpoint formulations and their results.
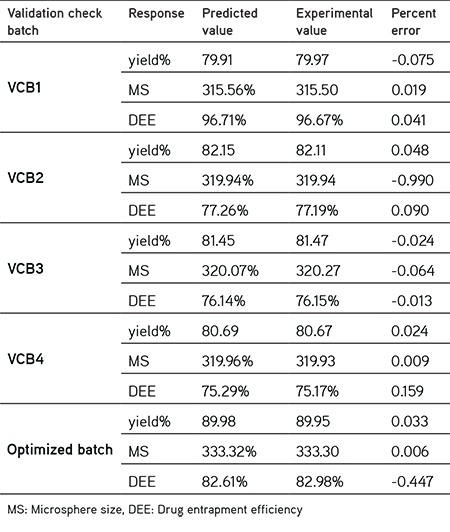
Figure 6.
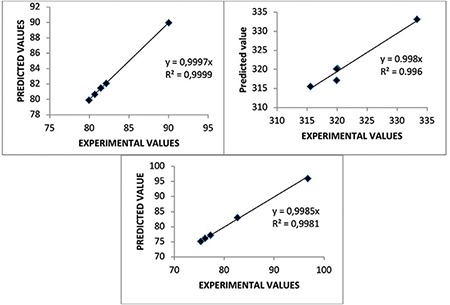
Regression coefficient between predicted and experimental response: a) % yield, b) microsphere size, c) drug entrapment efficiency
DISCUSSION
FTIR spectra (Figure 1) of pure L-arginine and formulated microspheres of L-arginine shows the identical peaks as that of standard L-arginine which proves that excipients incorporated in formulated microspheres do not interact with L-arginine and all ingredients of beads are compatible with each other.
Scanning electron microscopy of microspheres of L-arginine shows well-rounded spheres with rough surface because of sudden cross linking of gelatin with glutaraldehyde. The particle size of the formulations was found to be between 320-351.11 µm. It was observed that the mean particle size of formulated microspheres were decreased with respect to the increased the amount of ethyl cellulose in the formulation (Figure 2).
Results for drug entrapment efficiency indicates that as the concentration of EC increases the DEE increase which is due practically insoluble nature of hydrophobic polymer i.e. EC. DEE was increased as the amount of EC was increased in the formulation because of practically insoluble nature of EC in water.
In vitro drug release study of microspheres of L-arginine was carried out in 900 mL of phosphate buffer solution (pH= 7.4 for 8 h) at 37±0.5°C. In the fasted state gel micro carriers exhibited a biphasic release profile as an initial rapid drug release phase due to burst which are loosely into or just beneath the surface of microspheres followed by a slower, gradually decreasing drug release phase after 1 hour extending up to 8 hours (Table 4, Figure 3).
Drug release mechanism was investigated for number of models i.e. zero-order, first order, Higuchi’s square root of time model and Korsmeyer-Peppas model. Zero-order, first order, Higuchi’s square root of time and Korsmeyer-Peppas model gave R2 value 0.9101 to 0.9473, 0.9832-0.9889, 0.9901-0.9992 and 0.963-0.991 respectively, showing Fickian diffusion involving a combination of swelling, diffusion and/or erosion of matrices. Various response surface plots were also drawn to analyse impact of independent variables on dependent variables as discussed earlier.
Optimizations of formulated microspheres were done by using 32 CCD. The outcomes for response parameters, that is, % yield, MS and DEE were subjected to regression analysis and statistical models were found to be significant. Observed dependent responses i.e. % yield, MS and DEE shows fair relation between the dependent and independent variables. Percentage yield for formulated batches were found in the range of 74.65-86.36% while particle size was found in range of 302.34-333.32 mm. Drug entrapment efficiency of all the formulation was found to be between 73.59±1.744 to 82.61±0.700.
Figure 4a shows that values of % yield, increases with increase in concentration of gelatin and also increases with increasing EC concentration. Maximum % yield is observed at the highest levels of Gelatin and EC.
Figure 4b shows a nearly linear ascending pattern for MS, as the content of gelatin increased, this MS increase slowly with increasing gelatin. Value of MS achieves to its maximum value at the highest levels of gelatin and EC. Nonlinear pattern of contour lines indicates significant impact on gelatin and EC.
Figure 4c shows that the DEE increases almost linearly with increase in concentration of gelatin whereas it decreases very slowly and then increases with increase in EC concentration. Maximum value of DEE was observed at the highest gelatin and EC concentration.
Validation of optimized batch was done by setting up a comparison of the observed responses with the predicted ones (Table 5), the prediction error varied between -0.024 to 0.048, -0.990 to 0.090 and -0.013 to 0.159 for % yield, MS and DEE respectively. Validation of these data was also confirmed by overlay plot (Figure 5) obtained by design expert software (Dx8 trial version) The linear correlation plots drawn between the predicted and observed responses, forcing the line through the origin, demonstrated high values of R (0.996 to 0.999, Figure 6), indicating excellent goodness of fit (p<0.005). The corresponding residual plots show nearly uniform and random scatter around the mean values of response variables.
CONCLUSIONS
Spherical amino acid loaded gelatin microspheres were prepared to achieve repressible release by cross-linking technique. An L-arginine stacked repressible release matrix delivery system was successfully established and escalation was achieved by using QbD applying a 32 central composite design. Hence it can be concluded that QbD is a powerful tool for the present research that helps in developing a desired formulation without wastage of time as well as manpower, money, and material.
Footnotes
Conflict of Interest: No conflict of interest was declared by the authors.
References
- 1.Verma S, Lan Y, Gokhale R, Burgess DJ. Quality by Design approach to understand the process of nano susspension preparation. Int J Pharm. 2009;377:185–198. doi: 10.1016/j.ijpharm.2009.05.006. [DOI] [PubMed] [Google Scholar]
- 2.Lionberger RA, Lee SL, Lee L, Raw A, Yu LX. Quality by Design: Concepts for ANDAs. AAPS J. 2008;10:268–276. doi: 10.1208/s12248-008-9026-7. [DOI] [PMC free article] [PubMed] [Google Scholar]
- 3.Singh B, Pahuja S, Kapil R, Ahuja N. Formulation development of oral controlled release tablets of hydralazine: optimization of drug release and bioadhesive characteristics. Acta Pharm. 2009;59:1–13. doi: 10.2478/v10007-009-0005-z. [DOI] [PubMed] [Google Scholar]
- 4.Singh L, Nanda A, Sharma S, Sharma V. Performance Optimization of Buoyant Beads of Anti-Diabetic Drug Using Quality by Design (QbD) Lat Am J Pharm. 2014;33:14–23. [Google Scholar]
- 5.Desai S, Bolton S. A floating controlled-release drug delivery system: in vitro-in vivo evaluation. Pharm Res. 1993;110:1321–1325. doi: 10.1023/a:1018921830385. [DOI] [PubMed] [Google Scholar]
- 6.Panos I, ACOSTA N, Heras A. New Drug delivery systems based on Chitosan. Curr Drug Discov Techol. 2008;5:333–341. doi: 10.2174/157016308786733528. [DOI] [PubMed] [Google Scholar]
- 7.Patil JS, Kamalapur MV, Marapur SC, Kadam DV. Ionotropic gelation and polyelectrolyte complexation: the novel techniques to design hydrogel particulate sustained, modulated drug delivery system: a review. Digest Journal of Nanomaterials and Biostructures. 2010;5:241–248. [Google Scholar]
- 8.Suganeswari M, Senthil Kumar V, Anto SM. Formulation and evaluation of metoclopramide hydrochloride microbeads by ionotropic gelation method. Int J Pharm Bio Arch. 2011;2(Suppl 3):921–925. [Google Scholar]
- 9.Morris CR, Poljakovic M, Lavrisha L, Machado L, Kuypers FA, Morris SM Jr. Decreased arginine bioavailability and increased serum arginase activity in asthma. Am J Respir Crit Care Med. 2004;170:148–153. doi: 10.1164/rccm.200309-1304OC. [DOI] [PubMed] [Google Scholar]
- 10.Appleton J. Arginine: Clinical potential of a semi-essential amino acid. Alt Med Rev. 2002;7:512–522. [PubMed] [Google Scholar]
- 11.Sharma V, Singh L, Verma N, Kalra G. The nutraceutical amino acidsnature’s fortification for robust health. Br J Pharm Res. 2016;11:1–20. [Google Scholar]
- 12.Esposito E, Cortesi R, Nastruzzi C. Gelatin microspheres: influence of preparation parameters and thermal treatment on chemico-physical and biopharmaceutical properties. Biomaterials. 1996;17:2009–2020. doi: 10.1016/0142-9612(95)00325-8. [DOI] [PubMed] [Google Scholar]
- 13.Vandelli MA, Rivasi F, Guerra P, Forni F, Arletti R. Gelatin microspheres crosslinked with D,L-glyceraldehyde as a potential drug delivery system: Preparation, characterization, in vitro and in vivo studies. Int J Pharm. 2001;215:175–184. doi: 10.1016/s0378-5173(00)00681-5. [DOI] [PubMed] [Google Scholar]
- 14.Mishra B, Sahoo S, Biswal PK, Sahu SK, Behera BC, Jana GK. Formulation and Evaluation of Torsemide intragastric buoyant sustained release microspheres. 2010;3:742–746. [Google Scholar]
- 15.Wagner JG. Interpretation of percent dissolved-time plots derived from in vitro testing of conventional tablets and capsules. J Pharm. Sci.1969;58:1253–1257. doi: 10.1002/jps.2600581021. [DOI] [PubMed] [Google Scholar]
- 16.Sato Y, Kawaafaima Y, Takenchi H, Yamamoto H. In vitro and in vivo evaluation of riboflavin containing microoballoons for floating controlled delivery system in healthy humans. Int J Pharma. 2004;275:75–82. [Google Scholar]
- 17.No authors listed. USP. (24th ed) (Rockville: United States Pharmacopeial Convention Inc. 2000:1941–1943. [Google Scholar]
- 18.Obreshkova D, Ivanov K. Quality Control of Aminoacids in Organic Foods and Food Supplements. Int J Pharmacy Pharmaceutical Sciences. 2012;4:404–409. [Google Scholar]
- 19.Ritger PL, Peppas NA. A simple equation for description of solute release II. Fickian and anomalous release from swellable devices. J Controlled Release. 1987;5:37–42. [PubMed] [Google Scholar]
- 20.Korsmeyer RW, Gurny R, Doelker E, Buri P, Peppas NA. Mechanisms of solute release from porous hydrophilic polymers. Int J Pharmaceutics. 1983;15:25–35. [Google Scholar]
- 21.Higuchi T. Mechanism of sustained-action medication: Theoretical analysis of rate of release of solid drugs dispersed in solid matrices. J Pharm Sci. 1963;52:1145–1149. doi: 10.1002/jps.2600521210. [DOI] [PubMed] [Google Scholar]


