

Abstract
The role of clinical laboratory data in the differential diagnosis of the severe forms of COVID‐19 has not been definitely established. The aim of this study was to look for the warning index in severe COVID‐19 patients. We investigated 43 adult patients with COVID‐19. The patients were classified into mild group (28 patients) and severe group (15 patients). A comparison of the hematological parameters between the mild and severe groups showed significant differences in interleukin‐6 (IL‐6), d‐dimer (d‐D), glucose, thrombin time, fibrinogen, and C‐reactive protein (P < .05). The optimal threshold and area under the receiver operator characteristic curve (ROC) of IL‐6 were 24.3 and 0.795 µg/L, respectively, while those of d‐D were 0.28 and 0.750 µg/L, respectively. The area under the ROC curve of IL‐6 combined with d‐D was 0.840. The specificity of predicting the severity of COVID‐19 during IL‐6 and d‐D tandem testing was up to 93.3%, while the sensitivity of IL‐6 and d‐D by parallel test in the severe COVID‐19 was 96.4%. IL‐6 and d‐D were closely related to the occurrence of severe COVID‐19 in the adult patients, and their combined detection had the highest specificity and sensitivity for early prediction of the severity of COVID‐19 patients, which has important clinical value.
Keywords: d‐dimer, diagnostic utility, IL‐6, the severe COVID‐19
1. INTRODUCTION
Since December 8, 2019, several cases of pneumonia of unknown etiology have been reported in Wuhan, a city within the Hubei province of China. The disease and the virus that causes it have been named as COVID‐19 and SARS‐COV‐2, respectively. In January 2020, the outbreak spread to multiple cities in China, with cases now confirmed in multiple countries. 1 , 2 , 3 Human to human transmission is strongly associated with COVID‐9 and SARS‐COV‐2. Respiratory droplets and human to human contacts are the main routes of transmission of the virus. 4 In the early stages of this disease, symptoms of severe acute respiratory infection occur, with some patients rapidly developing acute respiratory distress syndrome (ARDS) and other serious complications, which are eventually followed by multiple organ failure. 5 Therefore, early diagnosis and timely treatment of critical cases is very crucial. At present, the occurrence, development, mechanism of prognosis and immune status of patients with COVID‐19 are still unclear. In this study, we have assessed the hematological characteristics of the patients. Also, we have determined the correlation between clinical laboratory data and the severity of COVID‐19 in adult patients. Moreover, we have determined the predictive value of clinical laboratory data for the severity of COVID‐19.
2. MATERIALS AND METHODS
2.1. Study subjects
We conducted a retrospective study on COVID‐9 patients from January 23, 2020 to February 2, 2020 in the Fuyang Second People's Hospital. The patients were diagnosed according to the World Health Organization interim guidance for COVID‐19. The fluorescent reverse transcription‐polymerase chain reaction was used to confirm each diagnosis made. Forty‐three patients, aged 19 to 70 years (43.74 ± 12.12 years), were recruited for the study. They comprised 17 females and 26 males. Blood samples were collected from each participant and then used for hematological investigations. The patients were then put into two groups in terms of the severity of the disease. Hence, there was a mild group (consisting of 28 patients) and the severe group (consisting of 15 patients). Permission to conduct the study was approved by the Ethics Committee of Fuyang Second People's Hospital; and informed written consent was obtained from each patient.
2.2. Clinical laboratory data
Routine blood tests (white blood cell [WBC] count, lymphocyte count [LYM], mononuclear count [MONO], neutrophils count [NEU]) were performed on the blood samples. Blood biochemistry parameters (aspartate aminotransferase [AST], alanine aminotransferase [ALT], glucose [GLU], urea, creatinine [Cr], cystatin [Cys‐c], uric acid [UA], and C‐reactive protein [CRP]) were measured using HITACHI 7600‐020 automated biochemistry analyzer. The reagents used were provided by Shanghai Shenneng‐DiaSys Diagnostic Technology Company. Coagulation functions (the d‐dimer [d‐D], thrombin time [TT], prothrombin time [PT], fibrinogen [FIB], activated partial thromboplastin time [APTT]) were determined using Sysmax CS‐5100 hemagglutinin analyzer. Procalcitonin (PCT) was detected by Biomerieux Mini VIDAS automatic fluorescence immunoanalyzer. Interleukin‐6 (IL‐6) was detected by Roche Cobas E601 on the fully automated electrochemical luminescence immunodetector, using the corresponding reagent. Mild patients used data from their first laboratory test on admission, while severe patients had their most recent laboratory test before their clinical diagnosis. All the operations were done by specially‐assigned personnel and in strict accordance with the instructions regarding the use of the reagents.
2.3. Statistical analysis
Data on AST, urea, Cr, Cys‐c, UA, CRP, WBC, LYM, MONO, NEU, TT, FIB, APTT, PT levels were expressed as means ± standard deviation (SD). Differences in the levels of these parameters between the mild and severe patients of the disease were determined with the Student t test, as the data were normally distributed. sex was compared using the χ 2 test, and ages were shown as means ± SD. Since the data regarding ALT, GLU, PCT, IL‐6, and d‐D levels were not normally distributed, they were compared between the two groups using Mann‐Whitney U tests. The results were presented in terms of the median (interquartile range [IQR]). The area under the curve (AUC) and the 95% confidence interval (CI) of the receiver operator characteristic (ROC) curve and logistic regression analysis was computed using the predicted probability of the severe COVID‐19. The optimal cut‐off points to predict the severity of COVID‐19 were determined by Youden's index. A two‐sided P value less than .05 was considered significant. The results of the analysis were obtained using SPSS for windows.
3. RESULTS
3.1. Baseline data
The study involved 43 patients. The mean age of the 15 patients (9 males and 6 females) who presented with the severe form of the disease was 45.2 years (SD, 7.68 years). The mean age of the 28 patients (17 males and 11 females) who presented with the mild form of the disease was 42.96 years. P values of gender in the severe group and the mild group were 0.194 and 0.503. There were no significant differences between the severe group and the mild group in gender and age. Baseline characteristics of patients with COVID‐19 were shown Table 1. The difference between the two groups was significant in diabetes and chronic obstructive pulmonary disease.
Table 1.
Baseline characteristics of patients with COVID‐19
| No. (%) | P value | |||
|---|---|---|---|---|
| Total (N = 43) | Severe group (15) | Mild group (28) | ||
| Age | 45.20 ± 7.68 | 42.96 ± 14.00 | .503 | |
| Sex | .194 | |||
| Female | 6 | 11 | ||
| Male | 9 | 17 | ||
| Comorbidities | ||||
| Diabetes | 7 (16.28) | 6(40.00) | 1 (3.57) | .005 |
| Hypertension | 13 (30.23) | 6(40.00) | 7 (25.00) | .501 |
| Cardiovascular disease | 3 (69.77) | 1(6.67) | 2 (8.00) | .725 |
| COPD | 8 (18.60) | 3(20.00) | 0 | .037 |
| Obesity | 4 (9.30) | 3(20.00) | 1 (3.57) | .114 |
Note: Data are mean ± SD. P values indicate differences between severe group and mild group patients. P < .05 was considered statistically significant.
Abbreviations: COPD, chronic obstructive pulmonary disease; SD, standard deviation.
3.2. Clinical laboratory data
The hematological characteristics of the patients are shown in Table 2. The levels of WBC, LYM, MONO, NEU, AST, ALT, UR, CR, Cys‐c, UA, APTT, PT, and PCT were not significantly different between the two groups. The level of GLU in the severe group (median: 7.73 mmol/L; IQR: 5.32 mmol/L, 9.91 mmol/L) was significantly higher than in the mild group (median: 6.00 mmol/L; IQR: 5.45 mmol/L, 7.07 mmol/L) (z = −2.293; P = .022). The level of CRP was significantly higher in the severe group (39.37 ± 27.68 mg/L) than in the mild group (18.76 ± 22.20 mg/L) (t = 2.660; P = .011). The level of IL‐6 was significantly higher in the severe group (median: 36.10 pg/mL; IQR: 23.00 pg/mL, 59.20 pg/mL) than in the mild group (median: 10.60 pg/mL; IQR: 5.13 pg/mL, 24.18 pg/mL) (z = −3.160; P = .002). TT level was significantly higher in the severe group (15.87 ± 2.11 seconds) than in the mild group (14.50 ± 1.71 seconds) (t = 2.319; P = .025). FIB level was significantly higher in the severe group (3.84 ± 1.00 g/L) than in the mild group (3.11 ± 0.83 g/L) (t = 2.553; P = .014). The d‐D level was significantly higher in the severe group (median: 0.49 µg/L; IQR: 0.29 µg/L, 0.91 µg/L) than in the mild group (median: 0.21 µg/L; IQR: 0.19 µg/L, 0.27 µg/L) (z = −2.693; P = .007).
Table 2.
Clinical laboratory data of 43 patients with COVID‐19
| Variable | Severe group (n = 15) | Mild group (n = 28) | t/z values | P value |
|---|---|---|---|---|
| AST, U/L | 27.80 ± 11.42 | 33.21 ± 18.24 | −1.042 | .300 |
| ALT, U/L | 27.00 (21.00, 41.00) | 24.50 (15.75, 37.75) | −0.446 | .655 |
| GLU, mmol/L | 7.73 (5.32, 9.91) | 6.00 (5.45, 7.07) | −2.293 | .022 a |
| Urea, mmol/L | 4.51 ± 1.76 | 4.09 ± 1.29 | 0.913 | .367 |
| Cr, µmol/L | 65.33 ± 15.55 | 66.96 ± 13.38 | −0.393 | .696 |
| Cys‐c, mg/L | 0.862 ± 0.21 | 0.820 ± 0.130 | 0.760 | .452 |
| UA, µmol/L | 201.60 ± 90.59 | 256.54 ± 85.86 | −1.963 | .056 |
| CRP, mg/L | 39.37 ± 27.68 | 18.76 ± 22.20 | 2.660 | .011 a |
| PCT, ng/mL | 0.04 (0.02,0.09) | 0.02 (0.01, 0.04) | −1.719 | .086 |
| IL‐6, pg/mL | 36.10 (23.00, 59.20) | 10.60 (5.13, 24.18) | −3.160 | .002 a |
| WBC, ×109/L | 4.26 ± 1.64 | 4.96 ± 1.85 | −1.229 | .220 |
| LYM, ×109/L | 1.20 ± 0.42 | 1.07 ± 0.40 | 1.031 | .309 |
| MONO, ×109/L | 0.37 ± 0.16 | 0.43 ± 0.19 | −1.104 | .276 |
| NEU, ×109/L | 2.65 ± 1.49 | 3.43 ± 1.63 | −1.556 | .127 |
| TT, s | 15.87 ± 2.11 | 14.50 ± 1.71 | 2.319 | .025 a |
| FIB, g/L | 3.84 ± 1.00 | 3.11 ± 0.83 | 2.553 | .014 a |
| APTT, s | 27.29 ± 6.09 | 30.41 ± 5.31 | −1.745 | .089 |
| PT, s | 11.26 ± 1.42 | 12.03 ± 1.21 | −1.872 | .068 |
| d‐D, µg/L | 0.49 (0.29, 0.91) | 0.21 (0.19, 0.27) | −2.693 | .007 a |
Note: Data are mean ± SD and median (IQR). P values for differences between the two groups were obtained by a Student t test or the Mann‐Whitney U test.
Abbreviations: ALT, alanine aminotransferase; APTT, activated partial thromboplastin time; AST, aspartate aminotransferase; Cr, creatinine; CRP, C‐reactive protein; Cys‐c, cystatin; d‐D, d‐dimer; FIB, fibrinogen; GLU, glucose; IL‐6, interleukin‐6; IQR, interquartile range; LYM, lymphocyte count; MONO, mononuclear count; NEU, neutrophils count; PCT, procalcitonin; PT, prothrombin time; TT, thrombin time; UA, uric acid; WBC, white blood cell.
Statistically significant (P < .05).
3.3. Analysis by ROC
The ROC curve was used to analyze the early‐warning efficiency and the optimal prediction threshold of COVID‐19 intensification. The AUC of IL‐6 which was used to predict the severity of COVID‐19 was 0.795 (P < .0001), which could better predict whether COVID‐19 was complicated by severe pneumonia. The optimum critical point of IL‐6 in the group was 24.3 pg/mL, which was the upper limit of no severe pneumonia. Similarly, the AUC used by d‐D to predict the severity of pneumonia was 0.750 (P = .0053). The optimum critical point was 0.28 ng/L, which was the upper limit of no severe pneumonia. When IL‐6 and d‐D were used for combined detection, the AUC for predicting the severity was 0.840 (P < .0001), while the AUC of other indicators (GLU, TT, FIB, CRP) were lower than 0.750 indicating that the combined detection increases sensitivity and specificity. The prediction efficiency is shown in Figure 1 and Table 3.
Figure 1.
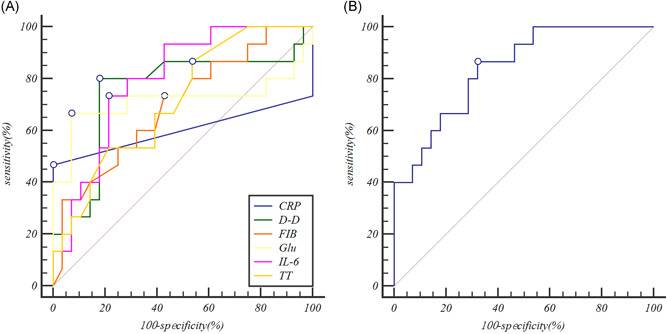
Receiver operator characteristic curves comparing the potential of different variables to predict the severe COVID‐19. A, The prediction of the severe COVID‐19 variables for Individual indicators. B, The prediction of the severe COVID‐19 variables for interleukin‐6 (IL‐6) combine with d‐dimer (d‐D). CRP, C‐reactive protein; FIB, fibrinogen; Glu, glucose; TT, thrombin time
Table 3.
ROC curve analysis of clinical laboratory data
| Variables | AUC | 95% CI | P value |
|---|---|---|---|
| IL‐6, pg/mL | 0.795 | 0.645‐0.903 | <.0001 |
| d‐D, µg/L | 0.750 | 0.595‐0.869 | .0053 |
| Glu, mmol/L | 0.714 | 0.556‐0.841 | .0464 |
| TT, s | 0.711 | 0.552‐0.826 | .0092 |
| FIB, s | 0.695 | 0.536‐0.789 | .0229 |
| CRP, mg/L | 0.600 | 0.440‐0.746 | .3688 |
| d‐D‐IL‐6 | 0.840 | 0.697‐0.934 | <.0001 |
Abbreviations: AUC, area under the curve; CI, confidence interval; CRP, C‐reactive protein; d‐D, d‐dimer; FIB, fibrinogen; Glu, glucose; IL‐6, interleukin‐6; ROC, receiver operator characteristic; TT, thrombin time.
3.4. Effects of IL‐6 and d‐D on the occurrence of the severe COVID‐19
The severe COVID‐19 was as the dependent variable (yes = 1, no = 0), and IL‐6 (>24.3 pg/mL = 1, ≤ 24.3 pg/mL = 0), d‐D (>0.28 µg/L = 1, ≤ 0.28 µg/L = 0) were as independent variables for logistic regression analysis. IL‐6 (odds ratio [OR] = 17.304 [95% CI: 2.416, 123.933]; P = .005), d‐D (OR = 12.319 [95% CI: 1.716, 85.862]; P = .012) were independent risk factors for the severity of COVID‐19. The regression equation used was: Logit (P) = −3.106 + 2.851 (IL‐6) + 2.496 (d‐D), which was statistically significant (χ 2 = 27.387; P = .000), and the prediction accuracy was 86.0%, as shown in Table 4.
Table 4.
Analysis of the occurrence of severe COVID‐19 in IL‐6 and d‐dimer
| B | SE | Wald | P value | OR (95% CI) | |
|---|---|---|---|---|---|
| IL‐6 | 2.851 | 1.005 | 8.055 | .005 | 17.304 (2.416, 123.933) |
| d‐D | 2.496 | 0.998 | 6.255 | .012 | 12.139 (1.716, 85.862) |
| Constant | −3.106 | 0.903 | 11.830 | .001 |
Abbreviations: CI, confidence interval; d‐D, d‐dimer; IL‐6, interleukin‐6; OR, odds ratio.
3.5. Analysis of the effectiveness of individual and joint indicators (IL‐6 and d‐D) for predicting the occurrence of the severe COVID‐19
When IL‐6 was over 24.3 pg/mL, the severity of COVID‐19 could be predicted, with sensitivity and the specificity of 73.3% and 89.3%, respectively, The severity of COVID‐19 was predicted when d‐D was over 0.28 µg/L, with the sensitivity and the specificity of 86.7% and 82.1%, respectively. When IL‐6 was beyond 24.3 pg/mL or d‐D was beyond 0.28 µg/L, the sensitivity and the specificity were 93.3% and 75.0%, respectively. And the corresponding AUC was 0.872. When combined IL‐6 with d‐D by parallel testing, the sensitivity, and the specificity were 66.7% and 96.4%, respectively. The corresponding AUC was 0.815. The specificity reached the highest point at 96.4% when IL‐6 and d‐D were combined by tandem testing. The sensitivity was 93.3% when IL‐6 and d‐D were combined by parallel testing, as shown in Figure 2 and Table 5.
Figure 2.

Receiver operator characteristic curves of independent and joint detection were obtained when interleukin‐6 (IL‐6) and d‐dimer (d‐D) both took the best critical values. d‐Dimer or IL‐6 represented serial detection. d‐Dimer and IL‐6 represented parallel detection
Table 5.
Analysis of the effectiveness of individual and joint indicators (IL‐6 and d‐dimer) for predicting the occurrence of the severe COVID‐19
| Sensitivity (%) | Specificity (%) | AUC (95% CI) | |
|---|---|---|---|
| IL‐6 | 73.3 | 89.3 | 0.813 (0.665, 0.915) |
| d‐D | 86.7 | 82.1 | 0.844 (0.701, 0.936) |
| IL‐6 or d‐D | 93.3 | 75.0 | 0.872 (0.698, 0935) |
| IL‐6 and d‐D | 66.7 | 96.4 | 0.815 (0.668, 0.917) |
Abbreviations: AUC, area under the curve; CI, confidence interval; d‐D, d‐dimer; IL‐6, interleukin‐6.
4. DISCUSSION
We reported here a cohort of 43 patients with laboratory‐confirmed COVID‐19. Patients had serious pneumonia and were admitted to the designated hospital in Fuyang, China. All are imported cases. The clinical presentations are very similar to SARS‐CoV. Coronaviruses (CoVs), a large family of single‐stranded RNA viruses, can infect a wide variety of animals, including humans, causing respiratory, enteric, hepatic, and neurological diseases. 6 Human CoV is one of the main pathogens of respiratory infection. 5 Most patients have mild symptoms and a good prognosis. So far, a few patients with SARS‐CoV‐2 have developed severe pneumonia, pulmonary edema, ARDS, or multiple organ failure and have died. Patients with severe illness developed ARDS and required ICU admission and oxygen therapy. 7 So far, no specific treatment has been recommended for CoV infection except for meticulous supportive care. 8 Currently, the source of the infection has not yet been identified. The approach to this disease is the use of personal precautionary measures to reduce the risk of transmission, and early diagnosis of the disease.
This study reported the results of blood routine, blood biochemistry, coagulation function, and infection‐related biomarkers of the adult patients with COVID‐19. We found that WBC, LYM, NEU, MONO counts were not significantly different between the severe group and the mild group. However, Huang et al 7 found low lymphocytes and WBC counts in most patients. WBC (the severe group 4.26 ± 1.64 × 10⁹/L and the mild group 4.96 ± 1.85 × 10⁹/L) and LYM (the severe group 1.20 ± 0.42 × 10⁹/L and the mild group 1.07 ± 0.40 × 10⁹/L) were close to the bottom line of the normal range in many patients in our study results. This result suggests that SARS‐CoV‐2 might mainly act on lymphocytes, especially T lymphocytes, as does SARS‐CoV. Virus particles spread through the respiratory mucosa and infect other cells, induce a cytokine storm in the body, generate a series of immune responses, and cause changes in peripheral WBCs and immune cells such as lymphocytes. Some studies suggest that a substantial decrease in the total number of lymphocytes indicates that CoV consumes many immune cells and inhibits the body's cellular immune function. Damage to T lymphocytes might be an important factor leading to exacerbations of patients. 8 The blood biochemistry indices, except for Glu, were not different between the two groups. The median and IQR of Glu in severe COVID‐19 patients were 7.73 and 4.59 mmol/L in severe patients. Chen et al 5 reported the Glu was 7.4 (3.4) mmol/L (median and IQR). It might be because most severe patients have underlying diseases that caused a high Glu level. This study found that coagulation function was significantly different between the severe group (0.49 [0.29, 0.91] µg/L) and the mild group (0.21 [0.19, 0.27] µg/L). Wang et al 9 found a difference in laboratory findings between patients admitted to the ICU (414 [191, 1324] mg/L) and those not admitted to the ICU (166 [101, 285] mg/L), including higher levels of d‐D. 9 The results showed that patients with severe conditions would have abnormal coagulation. Coagulation activation could have been related to the sustained inflammatory response. Infection‐related biomarkers appeared to differ between the two groups (IL‐6). However, the proportion of IL‐6 above normal was (36.10 [23.00, 59.20] pg/mL) in the severe group, which was significantly higher than that in the mild group (10.60 [5.13, 24.18] pg/mL). This was in line with the concept of “Cytokine Storm,” which must be experienced by patients with mild illness to become severe, emphasized by Lanjuan Li, an academician of the Chinese Academy of Engineering. Among these risk factors, the ROC curve was used to analyze the specificity and sensitivity of different variables in severe COVID‐19 patients. The AUC of IL‐6 and d‐D were 0.795 and 0.750, respectively, while those of Glu, TT, CRP, and FIB were below 0.750, thus leading to poor predictive value. When IL‐6 and d‐D were jointly predicted, the ROC curve integral of severe COVID‐19 was 0.840 (P < .01) as good predictors of severe COVID‐19 under the ROC curve, and the combined detection effect was better. Combined detection was more efficient than independent detection. Logistic regression analysis showed that IL‐6 and d‐D could predict severe COVID‐19. The combined detection of IL‐6 and d‐D plays a complementary role. The combination of severe COVID‐19 can be greatly improved by selecting different combinations according to different situations. Early prediction plays an important role. When IL‐6 was over 24.3 pg/mL and d‐D was over 0.28 µg/L by series test and parallel test, the AUC of the COVID‐19 with or without the severe was over 0.750, which also confirmed the high prediction efficiency.
In conclusion, our findings suggest that IL‐6 and d‐D levels can be used to estimate the severity of COVID‐19. If necessary, the levels of IL‐6 and d‐D should be measured, as they can help diagnose the severity of adult COVID‐19 patients.
This study has several limitations. Firstly, the sample size was relatively small compared with Wuhan, where the disease originated, which may have some impact on the statistical results. Secondly, due to the large‐scale outbreak of the epidemic restricting the flow of people, data on healthy patients are lacking as blank controls. Since this study was a retrospective study, not all patients were continuously monitored for all indicators in the blood including IL‐6 and d‐dimer levels. In future studies, data will be collected from healthy patients as blank controls to further explore the predictive value of IL‐6 and d‐dimer for patients with SARS‐COV‐2 infection.
CONFLICT OF INTERESTS
The authors declare that there are no conflict of interests.
AUTHOR CONTRIBUTIONS
All authors participated in the research design. YG, XW, and LW performed the data management and statistical analyses after discussion with all authors. All authors participated in data interpretation and in writing the manuscript. All authors took responsibility for the decision to submit for publication.
ACKNOWLEDGMENTS
This study was supported by the National Science and Technology Major Project of the 13th 5‐year Plan (Project No:2018ZX10711001‐005‐002), Natural Science Foundation of Anhui Province (Project No:1708085MH193), and the Basic and Clinical Cooperative Research and Promotion Program of Anhui Medical University (2019xkjT024). Emergency science and technology projects for the prevention and control of pneumonia caused by novel coronavirus in Fuyang (FK20201001).
Gao Y, Li T, Han M, et al. Diagnostic utility of clinical laboratory data determinations for patients with the severe COVID‐19. J Med Virol. 2020;92:791–796. 10.1002/jmv.25770
Xiaowu Wang and Linding Wang contributed equally as the last authors.
Contributor Information
Xiaowu Wang, Email: wangxiaowu19880218@126.com.
Linding Wang, Email: wanglinding@ahmu.edu.cn.
REFERENCES
- 1. World Health Organization . Coronavirus disease 2019 (COVID‐19) Situation Report‐23. 2020.
- 2. Holshue ML, DeBolt C, Lindquist S, et al. First case of 2019 novel coronavirus in the United States. N Engl J Med. 2020;382:929‐936. [DOI] [PMC free article] [PubMed] [Google Scholar]
- 3. Lu H, Stratton CW, Tang YW. Outbreak of pneumonia of unknown etiology in Wuhan, China: the mystery and the miracle. J Med Virol. 2020;92(4):401‐402. [DOI] [PMC free article] [PubMed] [Google Scholar]
- 4. Wan SYQ, Fan S, Lv J, et al. Characteristics of lymphocyte subsets and cytokines in peripheral blood of 123 hospitalized patients with 2019 novel coronavirus pneumonia (NCP). medRxiv. 2020. [Google Scholar]
- 5. Chen N, Zhou M, Dong X, et al. Epidemiological and clinical characteristics of 99 cases of 2019 novel coronavirus pneumonia in Wuhan, China: a descriptive study. Lancet. 2020;395(10223):507‐513. [DOI] [PMC free article] [PubMed] [Google Scholar]
- 6. Yin Y, Wunderink RG. MERS, SARS and other coronaviruses as causes of pneumonia. Respirology. 2018;23(2):130‐137. [DOI] [PMC free article] [PubMed] [Google Scholar]
- 7. Huang C, Wang Y, Li X, et al. Clinical features of patients infected with 2019 novel coronavirus in Wuhan, China. Lancet. 2020;395(10223):497‐506. [DOI] [PMC free article] [PubMed] [Google Scholar]
- 8. de Wit E, van Doremalen N, Falzarano D, Munster VJ. SARS and MERS: recent insights into emerging coronaviruses. Nat Rev Microbiol. 2016;14(8):523‐534. [DOI] [PMC free article] [PubMed] [Google Scholar]
- 9. Wang D, Hu B, Hu C, et al. Clinical Characteristics of 138 Hospitalized Patients With 2019 Novel Coronavirus‐Infected Pneumonia in Wuhan, China. JAMA. 2020. [DOI] [PMC free article] [PubMed] [Google Scholar]