

Abstract
In December 2019, an outbreak of the severe acute respiratory syndrome coronavirus 2 (SARS‐Cov‐2) infection occurred in Wuhan, and rapidly spread to worldwide, which has attracted many people's concerns about the patients. However, studies on the infection status of medical personnel is still lacking. A total of 54 cases of SARS‐Cov‐2 infected medical staff from Tongji Hospital between 7 January and 11 February 2020 were analyzed in this retrospective study. Clinical and epidemiological characteristics were compared between different groups by statistical method. From 7 January to 11 February 2020, 54 medical staff of Tongji Hospital were hospitalized due to coronavirus disease 2019 (COVID‐19). Most of them were from other clinical departments (72.2%) rather than emergency department (3.7%) or medical technology departments (18.5%). Among the 54 patients with COVID‐19, the distribution of age had a significant difference between non‐severe type and severe/critical cases (median age: 47 years vs 38 years; P = .0015). However, there was no statistical difference in terms of gender distribution and the first symptoms between theses two groups. Furthermore, we observed that the lesion regions in SARS‐Cov‐2 infected lungs with severe‐/critical‐type of medical staff were more likely to exhibit lesions in the right upper lobe (31.7% vs 0%; P = .028) and right lung (61% vs 18.2%; P = .012). Based on our findings with medical staff infection data, we suggest training for all hospital staff to prevent infection and preparation of sufficient protection and disinfection materials.
Keywords: COVID‐19 patients, medical staff, nucleic acid‐negative, nucleic acid‐positive, SARS‐Cov‐2
1. INTRODUCTION
Coronavirus disease 2019 (COVID‐19), full name is Coronavirus Disease 2019, is an infectious disease caused by a coronavirus called "SARS‐CoV‐2" (previously known as "2019‐nCoV"), and first appeared in Wuhan, Hubei, and rapidly spread to worldwide before the eve of 2020 Chinese Spring Festival in China. 1 Up to 13 March 2020, 81 003 cases have been confirmed in China, and 49 991 of which were in Wuhan. The cumulative number of confirmed cases in Europe is 30 307, of which 1206 have died. A total of 21 194 cases have been confirmed in Asia (excluding China), with 545 deaths. The clinical manifestations of COVID‐19 are similar to the severe acute respiratory syndrome (SARS) broken out in 2003, which has longer latency and stronger infectivity. This has led to severe shortages of medical resources and infections of health care workers. Peng et al reported 138 patients were admitted to Zhongnan Hospital in Wuhan, including 40 medical staff (29%). 2 Another retrospective analysis of 1099 confirmed patients with COVID‐19 (the diagnosis date is up to January 29) in 552 hospitals from 31 provinces found that the proportion of health professionals was 2.09%. 3 Various indications have shown that medical staff infections are at an unavoidable risk of infection. Besides, little is known on the infection status of the medical staff currently hospitalized, and their basic demographic characteristics, disease severity distribution, computed tomography (CT) image characteristics, and treatment status.
2. METHODS
2.1. Patients
In this retrospective study, the medical staff, who work at Tongji Hospital, were diagnosed as COVID‐19 and admitted to the hospital in Wuhan, China, from 7 January to 11 February 2020. The hospitalized COVID‐19 medical staff were classified as first‐line departments (including emergency department, fever clinic, fever ward, respiratory and critical care department, and infection department), nonemergency Clinics/wards (other clinical department), medical technology departments (examination and testing departments), and others (administrative logistics departments) according to their work sections. Two of the 54 medical staff (from the medical technology department and other departments respectively) have a history of close contact with the staff outside the hospital, and the remaining 52 staff have no history of contact with the staff outside the hospital. We all know that new coronary pneumonia is highly contagious, and medical staff have more opportunities to closely contact patients diagnosed with COVID‐19. Therefore, medical staff at Tongji Hospital have been arranged to live in designated hotels and have no chance to be with other staff.
A retrospective single center case series of 54 inpatients were recruited from Tongji Hospital, Wuhan, China. All patients with COVID‐19 enrolled in this study were diagnosed according to World Health Organization interim guidance. 3 The confirmed patients were clinically classified according to the "Pneumonia Diagnosis and Treatment Protocol for novel coronavirus (SARS coronavirus 2 [SARS‐Cov‐2]) infected pneumonia (trial version 5)." 4
Epidemiological, clinical, and management data are obtained from each inpatient between 7 January and 11 February 2020. This study was approved by the Ethics Committee of Tongji Hospital, Tongji Medical College, Huazhong University of Science and Technology. If some of the data were missed from the records or clarification was needed, we obtained data by direct communication with the attending doctors and healthcare providers.
2.2. Patient and public involvement
Patients or the public were not involved in the development or implementation of this study.
2.3. Procedures
Laboratory confirmation of SARS‐Cov‐2 infection was done in Tongji Hospital. Throatswab specimens from the upper respiratory tract were collected from inpatients. The throat swab was placed into a collection tube with virus preservation solution, and total RNA was extracted using two different respiratory sample RNA isolation kits approved by the Food and Drug Administration of China (Huirui and Bojie, Shanghai, China). Two target genes, including the open reading frame 1ab (ORF1ab) and the nucleocapsid protein (N), were simultaneously amplified by real‐time reverse transcription‐polymerase chain reaction (RT‐PCR). The reaction mixture consisted of 7.5 μL reaction buffer, 1.5 μL enzyme solution, 5 μL ORF1ab/N gene reaction solution, 5 to 11 μL RNA template, and 25 μL RNase free pure water. The RT‐PCR reactions were subjected to 50°C for 15 minutes, incubation at 95°C for 5 minutes, denaturation at 95°C for 45 cycles for 10 seconds, and fluorescence signal acquisition at 55°C for 45 seconds. Target gene test was that ORF1ab gene was detected by FAM channel, and N gene was detected by HEX/VIC channel. Negative: C t > 38 or not detected; positive: the amplification curve was s‐shaped, and the C t value was ≤35; suspicious: the amplification curve was s‐shaped, and 35 < C t ≤ 38, requiring reexamination; If the reexamination results are consistent, the determination results are positive for the nucleic acid test of the gene. In addition, SARS‐CoV‐2 nucleic acid test positive interpretation criteria are divided into two aspects, first, in the same specimen, ORF1ab and N genes tested positive at the same time; second, the ORF1ab or N gene was positive in two different samples of the same patient. These diagnostic criteria are based on the recommendations of the National Institute for Viral Disease Control and Prevention (China).
2.4. Data collection
Basic data were collected, including age, gender, department, first symptoms, date of onset, CT scan and treatment plan. Specifically, it was the medical workers confirmed with COVID‐19 in Tongji hospital from 7 January to 11 February 2020, which included a total of 54 medical inpatients. According to nucleic acid test results and CT imaging, they were distinguished between nucleic acid‐positive COVID‐19 and clinical diagnosis of patients with COVID‐19. And patients will be divided into common‐type, severe type and critical‐type by the latest guidelines of COVID‐19. 4
2.5. Statistical analysis
In this study, we divided the samples into common‐type, severe type/critical‐type according to the patient's condition, and divided the samples into nucleic acid‐positive COVID‐19 and clinical diagnosis of COVID‐19 according to the results of viral nucleic acid test and CT test. So that comparing different groups in demographic characteristics, clinical characteristics, CT manifestations, and treatment differences. Categorical variables were described as count (%), and continuous measurements were described using median and Range. Comparisons for the proportions of categorical variables were conducted using the χ 2 test or the Fisher exact test. The Wilcoxon rank sum test was used for the comparative analysis of continuous variables. All statistical tests were two‐sided, and P < .05 was considered as statistically significant. The Stata (version 15.1 SE) was employed for all statistical analyses.
2.6. Role of the funding source
The funders of the study had no role in the study design, data collection, data analysis, data interpretation, or writing of the report. The corresponding authors had full access to all the data in the study and had final responsibility for the decision to submit for publication.
3. RESULTS
Among all 54 hospitalized medical staff from Tongji Hospital diagnosed with COVID‐19 from 7 January to 11 February of 2020, 2 cases were from emergency department (3.7%); 39 cases were from other clinical departments (72.2%); 10 cases were from medical technology departments (18.5%); and 3 cases were from others (5.6%) (Figure 1). Much higher incidence of SRAS‐Cov‐2 infection was noted for those medical staff from clinical departments than that from others. The earliest onset date of COVID‐19 (7 January 2020) was noted in those medical staff from the emergency department, while the remaining onset dates were mostly clustered between 22 January and 3 February 2020 in medical staff from all other departments.
Figure 1.
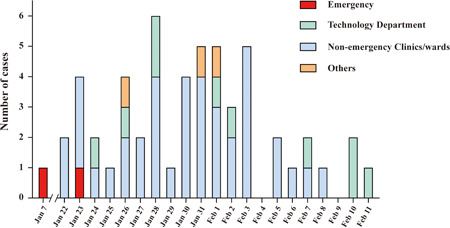
Date if illness onset and departments distribution of medical staff with confirmed COVID‐19 infection. Presented the stack bar graph of COVID‐19 infected cases in different departments of medical staff. The vertical axis indicated the number of COVID‐19 infected cases, and the horizontal axis indicated the illness onset date. The red presented the emergency department, the blue presented the nonemergency clinics, the green presented the technology department, and the orange presented other departments from hospital. COVID‐19, coronavirus disease 2019
Eleven out of 54 patients with COVID‐19 were categorized as common‐type, while 40 as severe‐type, and 3 as critical‐type. Unexpectedly, the median age for the common‐type patients was significantly elder than that of severe‐/critical‐type patients (47 years vs 38 years; P = .015). Among 11 common‐type patients, 5 cases (45.5%) were females and 6 cases (54.5%) were males. However, more male patients (30/43, 69.8%) were found with severe‐/critical‐type as compared with females (13/43, 30.2%). Fever was the main first symptoms of SARS‐Cov‐2 infection both in common‐type (81.8%) and severe‐/critical‐type patients (62.8%), followed by cough (27.3% vs 32.6%). Similarly, comparison of additional symptoms between common‐type and severe‐/critical‐type patients also failed to detect a significant difference, such as diarrhea (0% vs 7.0%), chill (0% vs 4.7%), sore throat (0% vs 2.3%), chest tightness (9.1% vs 7.0%), rhinorrhea (0% vs 2.3%), inappetence (0% vs 7.0%), expectoration (0% vs 7.0%), nervous (0% vs 2.3%), nausea (0% vs 2.3%), muscle ache (9.1% vs 4.7%), and globus sensation (0% vs 2.3%). However, higher proportion of common‐type patients displayed fatigue (36.4% vs 11.6%), and dyspnea (27.3% vs 4.7%) as compared with that of severe‐/critical‐type patients (Table 1).
Table 1.
Demographics and baseline characteristics of patients
| Disease severity | Infection status | ||||||
|---|---|---|---|---|---|---|---|
| Total | Common | Severe | Positive | Negative | |||
| (n = 54) (%) | (n = 11) (%) | (n = 43) (%) | P value a | (n = 38) (%) | (n = 16) (%) | P value a | |
| Characteristics | |||||||
| Age, median (range), y | 39 (26‐73) | 47 (36‐73) | 38 (26‐66) | .015 b | 39 (26‐66) | 46 (34‐73) | .094 b |
| Sex | |||||||
| Female | 18 (33.3) | 5 (45.5) | 13 (30.2) | ·475 | 14 (36.8) | 4 (25.0) | .598 |
| Male | 36 (66.7) | 6 (54.5) | 30 (69.8) | 24 (63.2) | 12 (75.0) | ||
| Occupation | |||||||
| Emergency | 2 (3.7) | 0 (0.0) | 2 (4.7) | .736 | 2 (5.3) | 0 (0.0) | .824 |
| Nonemergency clinics/wards | 39 (72.2) | 9 (81.8) | 30 (69.8) | 28 (73.7) | 11 (68.8) | ||
| Technology department | 10 (18.5) | 1 (9.1) | 9 (20.9) | 6 (15.8) | 4 (25.0) | ||
| Others | 3 (5.6) | 1 (9.1) | 2 (4.7) | 2 (5.3) | 1 (6.3) | ||
| Signs and symptoms | |||||||
| Fever | 36 (66.7) | 9 (81.8) | 27 (62.8) | .301 | 25 (65.8) | 11 (68.8) | ⋯ c |
| Cough | 17 (31.5) | 3 (27.3) | 14 (32.6) | ⋯ | 12 (31.6) | 5 (31.3) | ⋯ c |
| Diarrhea | 3 (5.6) | 0 (0.0) | 3 (7.0) | ⋯ | 2 (5.3) | 1 (6.3) | ⋯ |
| Chill | 2 (3.7) | 0 (0.0) | 2 (4.7) | ⋯ | 2 (5.3) | 0 (0.0) | ⋯ |
| Sore throat | 1 (1.9) | 0 (0.0) | 1 (2.3) | ⋯ | 1 (2.6) | 0 (0.0) | ⋯ |
| Chest tightness | 4 (7.4) | 1 (9.1) | 3 (7.0) | ⋯ | 2 (5.3) | 2 (12.5) | .573 |
| Dyspnea | 5 (9.3) | 3 (27.3) | 2 (4.7) | .052 | 3 (7.9) | 2 (12.5) | .627 |
| Rhinorrhea | 1 (1.9) | 0 (0.0) | 1 (2.3) | ⋯ | 1 (2.6) | 0 (0.0) | ⋯ |
| Fatigue | 9 (16.7) | 4 (36.4) | 5 (11.6) | .072 | 7 (18.4) | 2 (12.5) | .709 |
| Inappetence | 3 (5.6) | 0 (0.0) | 3 (7.0) | ⋯ | 2 (5.3) | 1 (6.3) | ⋯ |
| Expectoration | 3 (5.6) | 0 (0.0) | 3 (7.0) | ⋯ | 2 (5.3) | 1 (6.3) | ⋯ |
| Nervous | 1 (1.9) | 0 (0.0) | 1 (2.3) | ⋯ | 0 (0.0) | 1 (6.3) | .296 |
| Nausea | 1 (1.9) | 0 (0.0) | 1 (2.3) | ⋯ | 1 (2.6) | 0 (0.0) | ⋯ |
| Muscle ache | 3 (5.6) | 1 (9.1) | 2 (4.7) | .502 | 2 (5.3) | 1 (6.3) | ⋯ |
| Globus sensation | 1 (1.9) | 0 (0.0) | 1 (2.3) | ⋯ | 1 (2.6) | 0 (0.0) | ⋯ |
Note: As of 11 February, seven patients with common‐type illness and four severe patients had recovered and discharged. Data are n (%) unless specified otherwise.
P values were calculated from Fisher's exact test between two different groups.
P values were calculated by the Wilcoxon rank sum test.
P values were calculated by χ 2 indicates that the P values were approximately 1.
All 54 patients conducted SARS‐Cov‐2 nucleic acid tests, but only 38 were positive for the tests, and the 16 patients negative for SARS‐Cov‐2 tests showed manifested pathological changes in CT‐scans were also diagnosed as COVID‐19. The median age of patients positive for SARS‐Cov‐2 tests (39 years) was comparable to that of patients negative for the tests (46 years). In patients positive for SARS‐Cov‐2 tests, 14 were females (36.8%) and 24 were males (63.2%). However, higher proportion of male patients (12/16, 75%) was found in those negative SARS‐Cov‐2 tests (4/16, 25%). Fever was the main initial symptoms both in SARS‐Cov‐2 tests positive (65.8%) or negative (68.8%) patients. Similarly, comparisons of additional symptoms between positive and negative patients for SARS‐Cov‐2 tests, such as cough (31.6% vs 31.3%), diarrhea (5.3% vs 6.3%), chill (5.3% vs 0%), sore throat (2.6% vs 0%), chest tightness (5.3% vs 12.5%), dyspnea (7.9% vs 12.5%), rhinorrhea (2.6% vs 0%, fatigue (18.4% vs 12.5%), inappetence (5.3% vs 6.3%), expectoration (5.3% vs 6.3%), nervous (0% vs 6.3%), nausea (2.6% vs 0%), muscle ache (5.3% vs 6.3%), and globus sensation (2.6% vs 0%) also failed to detect a perceptible difference (Table 1).
All the medical staff performed chest CT‐scans at the time of admission. Remarkably, chest CT images were missing in two nucleic acid‐positive patients, and were suggested virus‐infected pneumonia in 52 out of 54 inpatients. Among those 52 patients, 11 were manifested as common‐type, while the rest 41 cases were characterized as severe‐/critical‐type patients. It was noted that the typical CT images derived either from common‐type or severe‐/critical‐type patients with COVID‐19 were characterized by the ground glass‐like shadows (63.6% vs 78.1%), fibrous stripes (54.6% vs 51.2%), patchy shadow (36.4% vs 43.9%), and pleural thickening (18.2% vs 29.3%). Other imaging features included nodules (18.2% vs 24.4%), consolidation (18.2% vs 9.8%), and pleural effusion (9.1% vs 9.8%). Of note, severe‐/critical‐type patients were featured by the higher severity of lymphadenia (29.3% vs 9.1%) and interstitial thickening (7.3% vs 0%) but with no significant difference. Furthermore, significantly higher proportion of patients positive for SARS‐Cov‐2 tests displayed patchy shadow (19/36, 52.8%) in the CT‐cans than that of patients negative for the tests (3/16, 18.8%, P = .022). Analysis of the lesion sites in CT‐scans revealed that those severe‐/critical‐type of patients were more likely to exhibit lesions in the right lung (61% vs 18.2%; P = ·012) of upper lobe or right lung (31.7% vs 0%; P = ·028) (Table 2).
Table 2.
The chest CT image characteristics and treatments of patients
| Disease severity | Infection status | ||||||
|---|---|---|---|---|---|---|---|
| Total | Common | Severe | P value a | Positive | Negative | P value a | |
| Chest CT images | (n = 52) (%) | (n = 11) (%) | (n = 41) (%) | (n = 36) (%) | (n = 16) (%) | ||
| Image characteristics | |||||||
| Ground‐glass opacity | 39 (75.0) | 7 (63.6) | 32 (78.1) | .270 | 29 (80.6) | 10 (62.5) | .149 |
| Fibrous stripes | 27 (51.9) | 6 (54.6) | 21 (51.2) | .845 b | 19 (52.8) | 8 (50.0) | .853 b |
| Patchy shadows | 22 (42.3) | 4 (36.4) | 18 (43.9) | .462 | 19 (52.8) | 3 (18.8) | .022 b |
| Pleural thickening | 14 (26.9) | 2 (18.2) | 12 (29.3) | .375 | 8 (22.2) | 6 (37.5) | .208 |
| Lymphadenia | 13 (25.0) | 1 (9.1) | 12 (29.3) | .165 | 10 (27.8) | 3 (18.8) | .373 |
| Nodules | 12 (23.1) | 2 (18.2) | 10 (24.4) | .505 | 8 (22.2) | 4 (25.0) | .544 |
| Consolidation | 6 (11.5) | 2 (18.2) | 4 (9.8) | .374 | 4 (11.1) | 2 (12.5) | .608 |
| Pleural effusion | 5 (9.6) | 1 (9.1) | 4 (9.8) | .717 | 3 (8.3) | 2 (12.5) | .492 |
| Interstitial thickening | 3 (5.8) | 0 (0.0) | 3 (7.3) | .482 | 1 (2.8) | 2 (12.5) | .221 |
| Lesion region | |||||||
| Bilateral pulmonary | 46 (88.5) | 11 (100.0) | 35 (85.4) | .221 | 31 (86.1) | 15 (93.8) | .392 |
| Right lung | 27 (51.9) | 2 (18.2) | 25 (61.0) | .012 b | 20 (55.6) | 7 (43.8) | .432 b |
| Left lung | 25 (48.1) | 3 (27.3) | 22 (53.7) | .120 b | 18 (50.0) | 7 (43.8) | .677 b |
| Lower lobe of left lung | 14 (26.9) | 1 (9.1) | 13 (31.7) | .129 | 12 (33.3) | 2 (12.5) | .108 |
| Upper lobe of left lung | 11 (21.2) | 2 (18.2) | 9 (22.0) | .575 | 7 (19.4) | 4 (25.0) | .455 |
| Lower lobe of right lung | 9 (17.3) | 0 (0.0) | 9 (22.0) | .095 | 7 (19.4) | 2 (12.5) | .429 |
| Upper lobe of right lung | 13 (25.0) | 0 (0.0) | 13 (31.7) | .028 | 8 (22.2) | 5 (31.3) | .357 |
| Middle lobe of right lung | 12 (23.1) | 2 (18.2) | 10 (24.4) | .505 | 9 (25.0) | 3 (18.8) | .456 |
| Bilateral pleura | 13 (25.0) | 2 (18.2) | 11 (26.8) | .438 | 7 (19.4) | 6 (37.5) | .149 |
| Subpleural | 7 (13.5) | 0 (0.0) | 7 (17.1) | .168 | 5 (13.9) | 2 (12.5) | .633 |
| Total | Common | Severe | P value | Positive | Negative | ||
|---|---|---|---|---|---|---|---|
| Treatments | (n = 54) (%) | (n = 11) (%) | (n = 43) (%) | (n = 38) (%) | (n = 16) (%) | P value | |
| Antiviral therapy | 54 (100.0) | 11 (100.0) | 43 (100.0) | ⋯ | 38 (100.0) | 16 (100.0) | ⋯ |
| Antimicrobial agents | 31 (57.4) | 8 (72.7) | 23 (53.5) | .211 | 22 (57.9) | 9 (56.3) | .911 b |
| Low dose of corticosteroid | 19 (35.2) | 6 (54.6) | 13 (30.2) | .125 | 15 (39.5) | 4 (25.0) | .309 b |
| Big dose of corticosteroid | 2 (3.7) | 1 (9.1) | 1 (2.3) | .369 | 2 (5.3) | 0 (0.0) | .491 |
| Use of immunoglobin | 18 (33.3) | 5 (45.5) | 13 (30.2) | .271 | 12 (31.6) | 6 (37.5) | .673 b |
| Use of interferon | 18 (33.3) | 7 (63.6) | 11 (25.6) | .023 | 14 (36.8) | 4 (25.0) | .399 b |
| Use of thymosin | 4 (7.4) | 1 (9.1) | 3 (7.0) | .610 | 4 (10.5) | 0 (0.0) | .233 |
Note: Data are n (%) unless specified otherwise.
Abbreviation: CT, computed tomography.
P values were calculated from Fisher's exact test between two different groups.
P values were calculated by χ 2 test indicates that the P values were approximately 1.
All patients were administered with empirical antiviral treatment; 57.4% (31/54) patients were used antimicrobial agents, and 38.9% (21/54) patients were given systematic corticosteroids. Immunoglobin, interferon, and thymosin were initiated in 33.3%, 33.3%, and 7.4% of patients, respectively. Significantly higher proportion of common‐type patients received interferon therapy as compared with that of severe‐/critical patients (63.6% vs 25.6%; P = .023) (Table 2). One critical‐type of patients died of day 9 of admission, while ECOM was adopted to other two critical‐type patients. Seven common‐type patients have already been discharged, and the rests are going to be discharged. Similarly, four severe‐type patients were discharged from hospitalization, and the rests are under recovery (Table 2).
4. DISCUSSION
At the press conference on “joint prevention and control of COVID‐19” by the State Council of China, Ceng Yixin, deputy director of the National Health Commission, declared that as of 24:00 on 11 February, 1716 cases of COVID‐19 had been confirmed in medical staff across the country, accounting for 3.8% of all confirmed cases, among them, six had died, accounting for 0.4% of national deaths. Among the 1716 cases, 1502 cases were in Hubei Province, and 1102 cases in Wuhan City. Wuhan Tongji Hospital in Hubei is the largest Grade‐A Tertiary Hospital, which provided the most beds during the battle against the epidemic. This study analyzed the 54 medical staff infections in Tongji Hospital from 7 January to 11 February 2020, including 2 cases (3.7%) from first‐line departments, 39 cases (72.2%) from non‐first‐line departments, 10 (18.5%) from medical medical technology departments, and 3 (5.6%) from administrative and logistics departments. Such pattern of distribution was similar to that reported by Wang et al 2 on 7 February 2020, which indicated that among the 40 medical staff infections, 31 (77.5%) worked in general wards, 7 (17.5%) in emergency room, and 2 (5%) in intensive care unit. Analysis of onset time suggested that earliest infections occurred in the emergency department, which began to show symptoms on 7 January 2020, and the other cases showed symptoms mostly from 22 January to 3 February 2020, then from 4 February on, number of new cases gradually decreased. The causes of such pattern of medical staff infection may include: firstly, the COVID‐19 has many atypical clinical manifestations, so the patients may go to different departments for treatment. As the disease may be contagious during the incubation period, 5 , 6 many medical staff are not adequately protected and become infected via unwitting contact with the patients. Second, it is important to note there were not sufficient reserves of protective equipment in the hospital for a pandemic of such severity. The protective equipment, such as protective clothing, N95 masks, and goggles are prioritized to first‐line medical staff in fever clinics and fever wards, while other staff often have only surgical masks at best, which explains the lower infection rates in medical staff directly facing the infected than medical staff who are less exposed. Third, according to the article by Wang et al 2 on 7 February 2020, among the 138 cases admitted by Wuhan Zhongnan Hospital, 17 cases (12.3%) were hospitalized for reasons other than pneumonia, such as conditions that requires surgery and tumors, including 7 cases in the surgery department, 5 cases in the internal medicine department, and 5 cases in the oncology department. These cases may even have been infected during hospitalization. As patients in hospital frequently contact inpatient caregivers and visitors that frequently go in and out of hospital and are at high risk of getting infected, which exacerbates infections of medical staff not in direct contact with the known infected patients. Fourth, the infected medical staff may be asymptomatic but infectious, which may lead to clustered infection in a department. 7
Another notable feature of the medical staff infections by COVID‐19 in Tongji Hospital, was the high rate of severe and critical cases. The 54 cases included 40 severe cases and 3 critical cases (79% in total), a ratio much higher than what's reported on the N Engl J MED by Wuhan Jinyintan Hospital, 8 in which only 32% of the 41 hospitalized patients were severe or critical cases. Another unusual feature of the 54 cases was that the 11 common cases were 47 years old on average, while the 43 severe and critical cases were 38 years old on average—the common‐type cases were significantly elder than the severe or critical cases, which was contrary to what's reported by Huang et al and Wang et al 1 Such contradiction may be explained by (a) the lower ratio of elder people among the medical staff; (b) the longer work time and higher work intensity of the medical staff aged 38 years or so, as they are the mainstay of a hospital. However, the latter is currently only based on empirical assumption and not supported by quantitative analysis.
CT revealed that compared with the common cases, the severe and critical cases showed more involvement of the right lung (61% vs 18.2%; P = .012), especially right upper lung (31.7% vs 0%; P = .028). Similarly, Goh et al 9 reported that severe consolidation in SARS occurred in the upper right lobe of patients. Wong et al 10 reported 108 cases of SARS patients, in which right lung involvement (82/108, 75.9%) was more common, these results are exactly the same as our statistical results. It is worthwhile to further explore the mechanism of this phenomenon, which ca make us identify the severe and critical cases in medical staff. In Hubei, the epicenter, many patients had positive CT images but showed negative results in the nucleic acid test. 11 To better address such patients, on 13 February 2020, the General Office of the National Health Commission and the State Administration of Traditional Chinese Medicine issued the guideline “Clinical Diagnosis of COVID‐19 (Fifth Edition on trial),” 4 which added “clinical diagnosed” to the classification of the new coronavirus‐infected pneumonia. The “clinical diagnosed” classification refers to cases that had characteristic clinical manifestations of infection but were negative in the nucleic acid test. We compared the nucleic acid‐positive and ‐negative cases, and found that the two groups showed no significant differences in age, gender, or symptoms, but the former had a higher ratio of patchy shadows on CT images than the latter (19/36, 52.8% vs 3/16, 18.8%). As most of the patients are still hospitalized at the time of submission, we can hardly evaluate the significance of nucleic acid test results in prognosis, which require further observation of the natural history of the disease.
Basing on these analyses, we suggest training for all hospital staff to prevent infection, especially those in departments not so alert about virus infection as those directly facing patients in fever; and preparation of sufficient protection and disinfection materials. For patients who are currently hospitalized due to other diseases, chest CT and/or nucleic acid tests should be performed as soon as possible in case of fever or respiratory symptoms, and if the diagnosis is positive in either CT or nucleic acid test, the patient must be transferred to designated hospitals immediately for further treatment. Medical staff of 38 years old or so shall receive extra care and protection due to their susceptibility to severe infection, and when a medical personal is infected, changes in right lung and upper right lobe should be noticed for earlier detection of severe cases.
CONFLICT OF INTERESTS
The authors of this article declare no relationships with any companies whose products or services may be related to the subject matter of the article.
AUTHOR CONTRIBUTION
We are indebted to the direction of Prof. Shu Zhang, Prof. Congyi Wang, Prof. Xiaoping Miao, Prof. Jianping Zhao, Prof. Wenhua Liu, Prof. Juan Li, Prof.Huilan Zhang. Special thanks are given to Drs. Jiaojiao Chu, Yanqiu Wei, Huihui Yue, Fengqin Zhang, for their contribution to the writing and revision of the manuscript, and the statistical team members Nan Yang, Li He, Gaohong Sheng, Peng Chen, Gang Li, Sisi Wu, Bo Zhang. Sincere thanks one more.
ETHICS STATEMENT
This study was approved by the Ethics Committee of Tongji Hospital, Tongji Medical College, Huazhong University of Science and Technology (IRB ID:TJ‐IRB20200203).
ACKNOWLEDGMENT
This study was supported by the Clinical Research Physician Program of Tongji Medical College; the Huazhong University of Science and Technology [Grant 5001540075].
Chu J, Yang N, Wei Y, et al. Clinical characteristics of 54 medical staff with COVID‐19: A retrospective study in a single center in Wuhan, China. J Med Virol. 2020;92:807–813. 10.1002/jmv.25793
Shu Zhang, Congyi Wang, Xiaoping Miao, Juan Li, Wenhua Liu, and Huilan Zhang contributed equally to this study.
Contributor Information
Shu Zhang, Email: szhang@tjh.tjmu.edu.cn.
Congyi Wang, Email: wangcy@tjh.tjmu.edu.cn.
Xiaoping Miao, Email: miaoxp@hust.edu.cn.
Juan Li, Email: lijuan@tjh.tjmu.edu.cn.
Wenhua Liu, Email: liuwh_2013@126.com.
Huilan Zhang, Email: huilanz_76@163.com.
REFERENCES
- 1. Huang C, Wang Y, Li X, et al. Clinical features of patients infected with 2019 novel coronavirus in Wuhan, China. Lancet. 2020;395:497‐506. [DOI] [PMC free article] [PubMed] [Google Scholar]
- 2. Wang D, Hu B, Hu C, et al. Clinical characteristics of 138 hospitalized patients with 2019 novel coronavirus‐infected pneumonia in Wuhan, China. JAMA. 2020;323:1061. [DOI] [PMC free article] [PubMed] [Google Scholar]
- 3. Zhong N‐S, Guan W‐J, Ni Z‐Y, et al. Clinical characteristics of 2019 novel coronavirus infection in China. medRxiv. 06 February 2020.
- 4.Diagnosis and Treatment of NCIP(Trial version 5) Network launch time: 2020‐02‐08 17:40:47 Network first address: http://kns.cnki.net/kcms/detail/11.2787.R.20200208.1034.002.html
- 5. Kampf G, Todt D, Pfaender S, Steinmann E. Persistence of coronaviruses on inanimate surfaces and their inactivation with biocidal agents. J Hosp Infect. 2020;104:246‐251. S0195‐6701(20)30046‐3 [DOI] [PMC free article] [PubMed] [Google Scholar]
- 6. Yang Y, Lu Q, Liu M, et al. Epidemiological and clinical features of the 2019 novel coronavirus outbreak in China. medRxiv. 11 February 2020.
- 7. Chan JFW, Yuan S, Kok KH, et al. A familial cluster of pneumonia associated with the 2019 novel coronavirus indicating person‐to‐person transmission: a study of a family cluster. Lancet. 2020;395(10223):514‐523. [DOI] [PMC free article] [PubMed] [Google Scholar]
- 8. Li Q, Guan X, Wu P, et al. Early transmission dynamics in Wuhan, China, of novel coronavirus‐infected pneumonia. N Engl J Med. 2020;382:1199‐1207. 10.1056/NEJMoa2001316 [DOI] [PMC free article] [PubMed] [Google Scholar]
- 9. Goh JS, Tsou IY, Kaw GJ. Severe acute respiratory syndrome (SARS): imaging findings during the acute and recovery phases of disease. J Thorac Imaging. 2003;18:195‐199. [DOI] [PubMed] [Google Scholar]
- 10. Wong KT, Antonio GE, Hui DSC, et al. Severe acute respiratory syndrome: radiographic appearances and pattern of progression in 138 patients. Radiology. 2003;228:401‐406. [DOI] [PubMed] [Google Scholar]
- 11. Xie X, Zhong Z, Zhao W, Zheng C, Wang F, Liu J. Chest CT for typical 2019‐nCoV pneumonia: relationship to negative RT‐PCR testing. Radiology. 2020:200343. [DOI] [PMC free article] [PubMed] [Google Scholar]