Abstract
Orleans Parish in Louisiana is in the midst of an exponentially increasing number of patient admissions with COVID‐19 and respiratory symptoms. Patients have been described having CT findings most consistent with an early‐stage (<7 days from symptoms onset) or an advanced stage (8‐14 days from symptoms onset). We describe and illustrate those early and advanced stage CT findings from patients with documented COVID‐19 who have been admitted to University Medical Center in New Orleans, Louisiana.
Keywords: COVID‐19, CT
1. INTRODUCTION
An acute coronavirus disease affecting mostly the respiratory tract, named severe acute respiratory syndrome coronavirus 2 (SARS‐CoV‐2) or COVID‐19, has quickly become a pandemic. 1 , 2 Within the state of Louisiana, Orleans Parish is presently experiencing an exponential acceleration of cases, with a large number of patients having severe lung involvement.
Chest X‐ray has been of little benefit during early stages of COVID‐19, but chest computed tomography (CT) has been noted to have abnormal findings, even prior to the onset of respiratory symptoms. 3 , 4 , 5 These findings are not specific by themselves and should not be used as criteria to diagnose COVID‐19 infection. However, they are helpful in the appropriate clinical setting. Findings by CT may be categorized into two main categories by time from onset of symptoms: Early (<7 days from symptoms onset) or advanced (8‐14 days from symptoms onset). The advanced stage may then progress to either “healing” or that of deterioration with cytokine storm and adult respiratory distress syndrome (ARDS). 1
2. CT FINDINGS of COVID‐19
CT abnormalities with COVID‐19 have been reported to vary. Lymphadenopathy, lung cavitation, and pleural effusions are usually not associated with COVID‐19. 6 , 7 , 8
Early category CT findings are generally associated with ground glass opacities (GGOs). They are typically multifocal, peripheral, bilateral at different levels, and mostly bibasilar (Figures 1 and 2). As this early category progresses to the advanced category, GGOs will demonstrate a reticular pattern with a decreased GGO prominence (Figures 3, 4, 5, 6). The GGOs will continue to progress to consolidation bilaterally (Figures 7, 8, 9). As mentioned previously, although a pleural effusion is not usually described as associated with COVID‐19, one may be noted on occasion (Figure 10).
Figure 1.
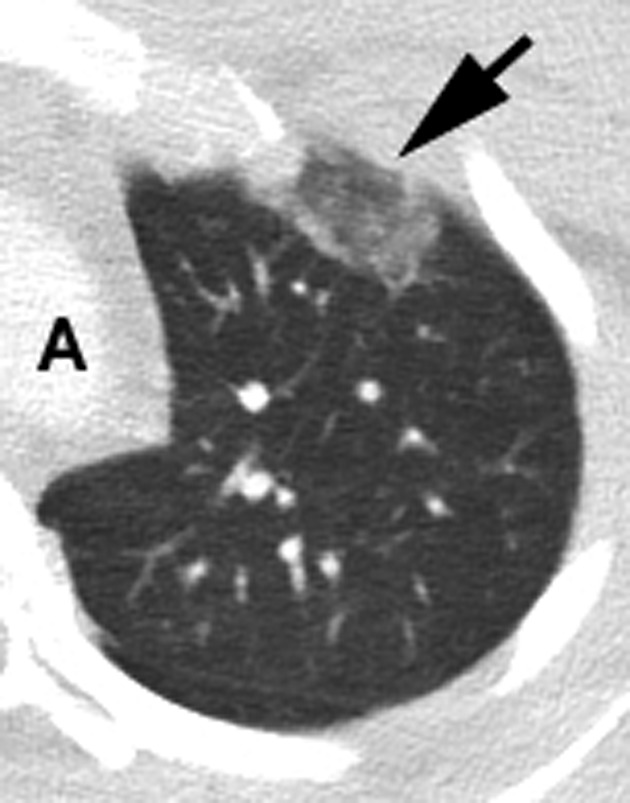
All images are contrast CT images of the chest in the standard axial plane. For optimal imaging of the lungs, lung windowing was used. All images are from patients admitted during the mid‐weeks of March 2020 to University Medical Center, New Orleans, Louisiana. All patients had documented COVID‐19 by PCR, and respiratory symptoms. Left lung image. A typical GGO is noted (arrow) as a round opacity at the level of the aortic arch, peripherally involving the anterior segment of the left upper lobe. Typically, GGOs are more often found in the basilar location. A = aortic arch
Figure 2.
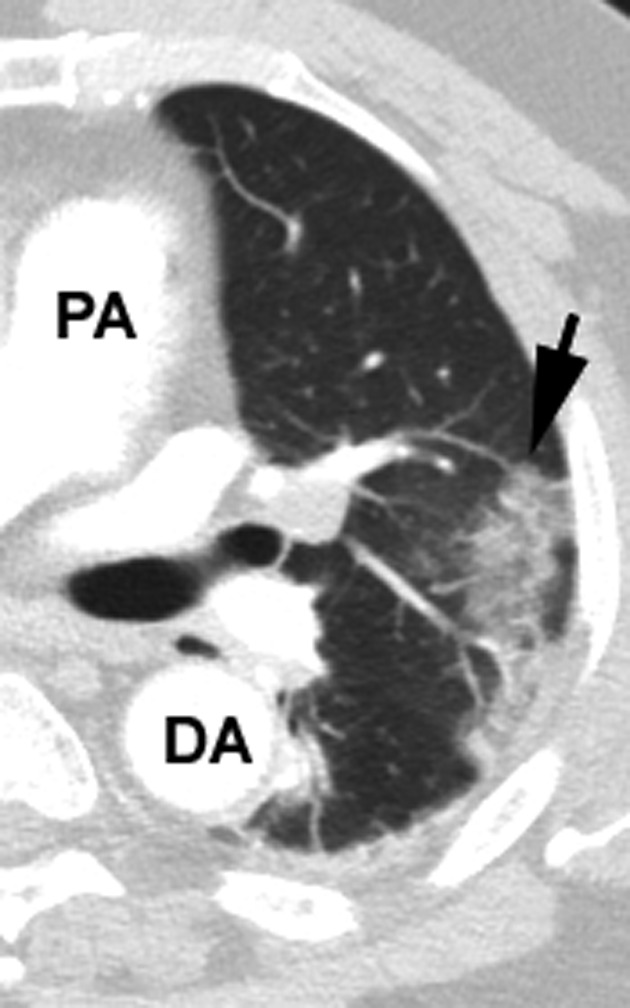
Left lung image. A peripheral GGO (arrow) with reticulation. Reticulation is noted with development of thickening of interlobular septa, appearing as linear opacities. DA = descending aorta; PA = main pulmonary artery
Figure 3.
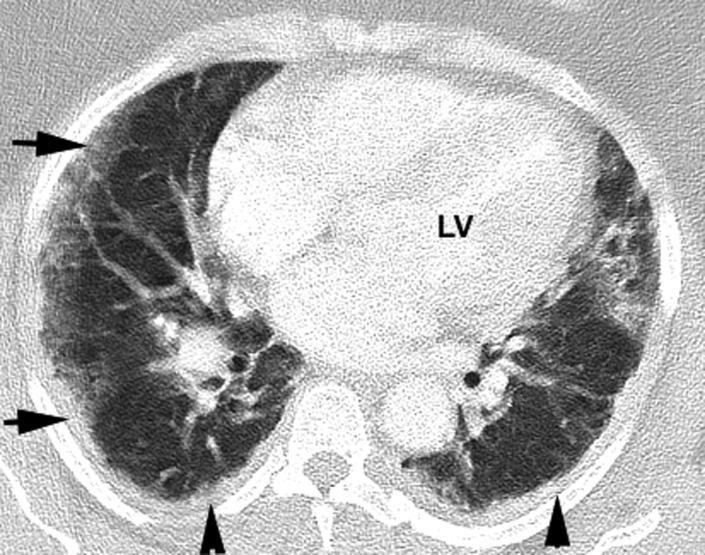
Level of the heart. Right lung demonstrates an atypical presentation of a peripheral GGO with reticulation, which is not rounded but more band‐like (horizontal arrows). Also, bilateral diffuse band‐like subpleural consolidations are noted (vertical arrows). These band‐like consolidations have been observed in several patients. LV = left ventricle
Figure 4.
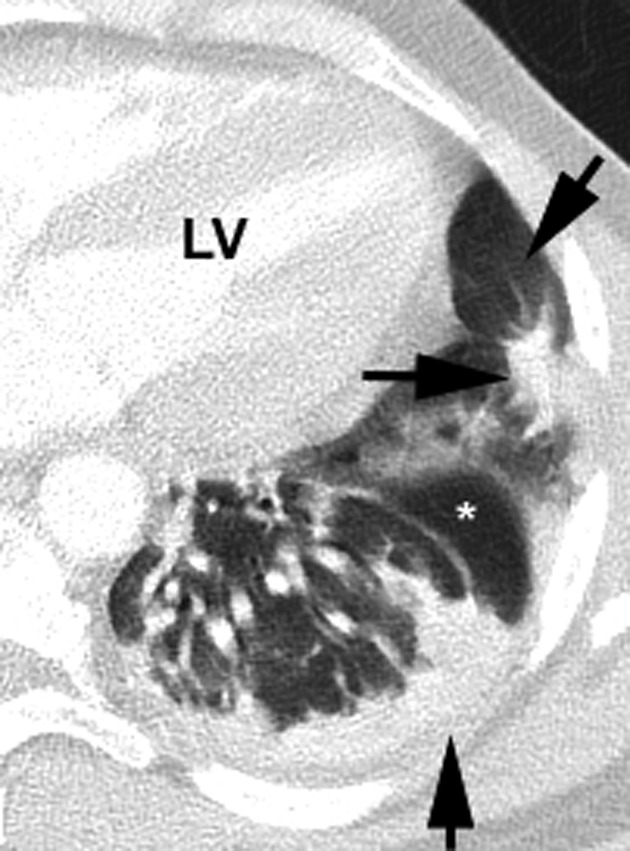
Left lung image. A zone of GGO (oblique arrow) surrounding an area of consolidation (horizontal arrow). This is termed a halo sign, in which a circular area of GGO is noted around an opacity. An area of normal lung (*) is also noted. As in the prior CT image, a band‐like consolidation is noted (vertical arrow). This is a GGO coalesced into a consolidation with a thick band‐like appearance. LV = left ventricle
Figure 5.
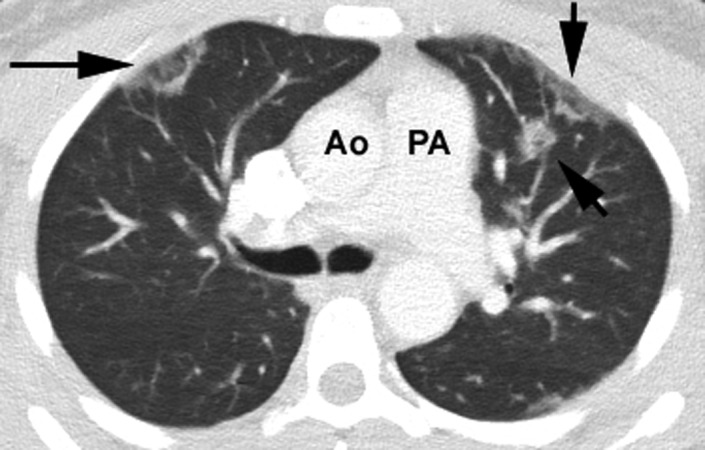
The reversed halo sign or atoll sign (horizontal arrow) is defined as a focal area of GGO surrounded by a crescent or ring of consolidation. A typical GGO (vertical arrow) and area of consolidation (oblique arrow) is also noted in the left lung. Ao = ascending aorta; PA = main pulmonary artery
Figure 6.
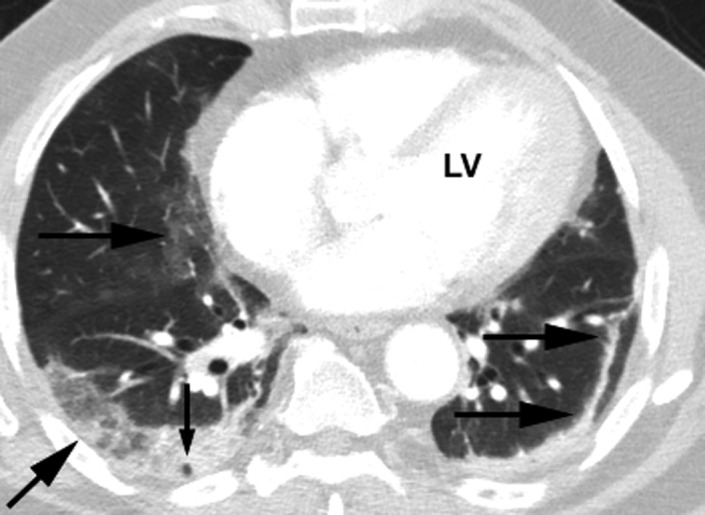
Right lung ‐ Area of GGO noted more centrally than usually found (horizontal arrow). A peripheral GGO with reticulation (oblique arrow) and the vacuole sign (small vertical arrow). The vacuole sign is a translucent, low‐density shadow within an opacity. Left lung – A parenchymal band (horizontal arrows) is noted. This is defined as a linear opacity, usually up to 3 mm in width and up to 5 cm in length. It may extend to the visceral pleura, which may be retracted where the band attaches. LV = left ventricle
Figure 7.
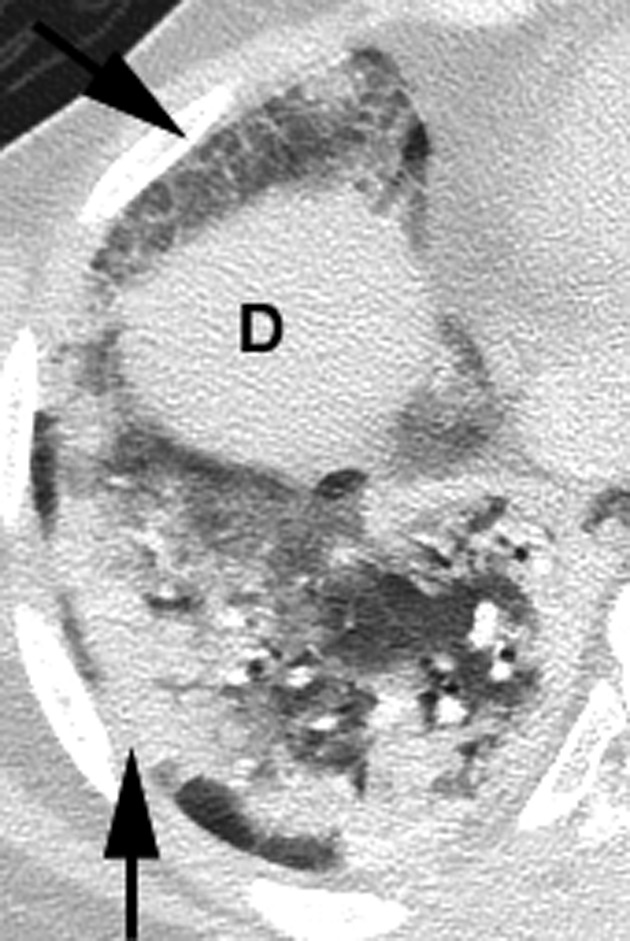
Right lung image. Basilar level image demonstrates a GGO with reticulation (oblique arrow). Also, a peripheral area of consolidation (vertical arrow) is noted. D = diaphragm
Figure 8.
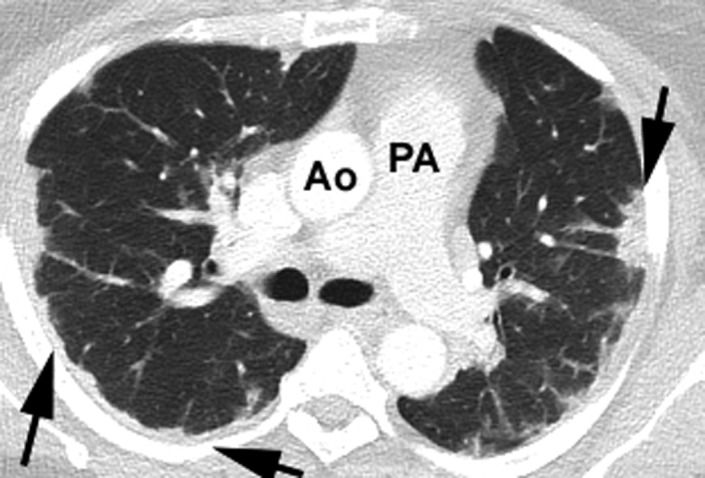
Right lung – Linear subpleural consolidations (arrows). Left lung ‐ Rounded consolidation (arrow). Ao = ascending aorta; PA = main pulmonary artery
Figure 9.
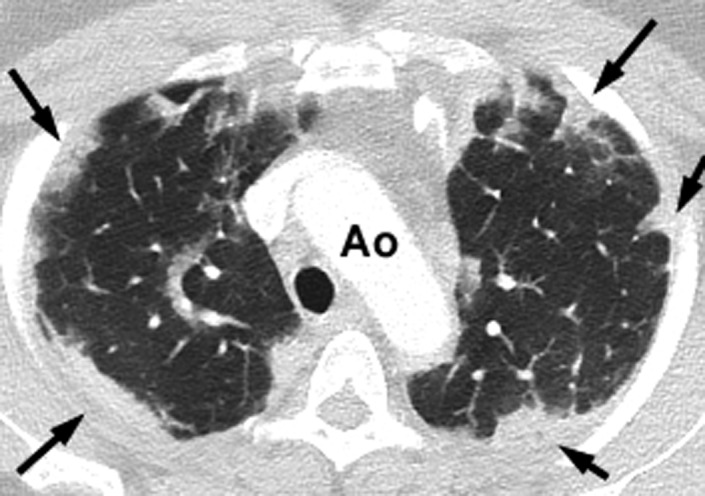
Multiple peripheral consolidations are noted in both lung fields (arrows) in this advanced category patient. Ao = transverse aorta
Figure 10.
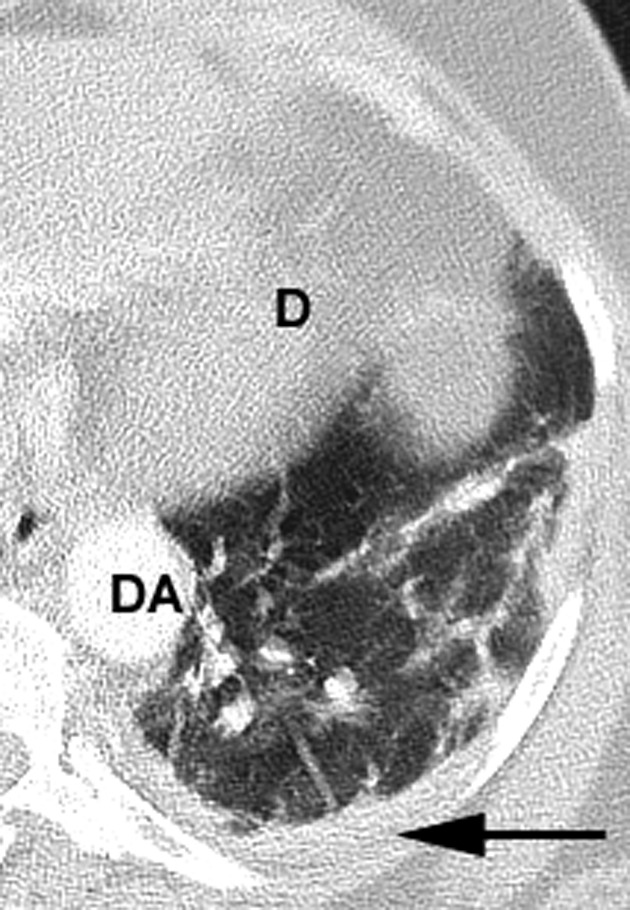
Left lung image. Although not usually associated with COVID‐19, this patient has a tiny left pleural effusion at the posterior base of the left lung (horizontal arrow). D = diaphragm, DA = descending aorta
3. CONCLUSION
Orleans Parish in Louisiana is in the midst of an exponentially increasing number of patient admissions with COVID‐19 and respiratory symptoms. Patients have been described having CT findings most consistent with an early stage (<7 days from symptoms onset) or an advanced stage (8‐14 days from symptoms onset).
We describe and illustrate early and advanced stage CT findings from patients with documented COVID‐19 who have been admitted to University Medical Center in New Orleans, Louisiana.
Danrad R, Smith DL, Kerut EK. Radiologic chest CT findings from COVID‐19 in Orleans Parish, Louisiana. Echocardiography. 2020;37:628–631. 10.1111/echo.14662
REFERENCES
- 1. Zhou S, Wang Y, Zhu T, Xia L. CT Features of coronavirus disease 2019 (COVID‐19) pneumonia in 62 patients in Wuhan, China. AJR. 2020;215:1–8. [DOI] [PubMed] [Google Scholar]
- 2. Zhao W, Zhong Z, Xie X, Yu Q, Liu J. Relation between chest CT findings and clinical conditions of coronavirus disease (COVID‐19) pneumonia: a multicenter study. AJR. 2020;215:1–6. [DOI] [PubMed] [Google Scholar]
- 3. Salehi S, Abedi A, Balakrishnan S, Gholamrezanezhad A. Coronavirus disease 2019 (COVID‐19): a systematic review of imaging findings in 919 patients. Am J Roentgenol. 2020;25:1–7. [DOI] [PubMed] [Google Scholar]
- 4. Kim JY, Choe PG, Oh Y, et al. The first case of 2019 novel coronavirus pneumonia imported into Korea from Wuhan, China: implication for infection prevention and control measures. J Korean Med Sci. 2020;35:e61. [DOI] [PMC free article] [PubMed] [Google Scholar]
- 5. Pan Y, Guan H, Zhou S, et al. Initial CT findings and temporal changes in patients with the novel coronavirus pneumonia (2019‐nCoV): a study of 63 patients in Wuhan, China. Eur Radiol. 2020. (Epub ahead of Print]. [DOI] [PMC free article] [PubMed] [Google Scholar]
- 6. Hosseiny M, Kooraki S, Gholamrezanezhad A, Reddy S, Myers L. Radiology perspective of coronavirus disease 2019 (COVID‐19): lessons from severe acute respiratory syndrome and Middle East Respiratory Syndrome. AJR. 2020;215:1–5. [DOI] [PubMed] [Google Scholar]
- 7. Cheng Z, Lu Y, Cao Q, et al. Clinical Features and chest CT manifestations of coronavirus disease 2019 (COVID‐19) in a single‐center study in Shanghai, China. AJR. 2020;215:1–6. [DOI] [PubMed] [Google Scholar]
- 8. Li Y, Xia L. Coronavirus disease 2019 (COVID‐19): role of chest CT in diagnosis and management. AJR. 2020;215:1–7. [DOI] [PubMed] [Google Scholar]


