

Abstract
To reconstruct the evolutionary dynamics of the 2019 novel‐coronavirus recently causing an outbreak in Wuhan, China, 52 SARS‐CoV‐2 genomes available on 4 February 2020 at Global Initiative on Sharing All Influenza Data were analyzed. The two models used to estimate the reproduction number (coalescent‐based exponential growth and a birth‐death skyline method) indicated an estimated mean evolutionary rate of 7.8 × 10⁻⁴ subs/site/year (range, 1.1 × 10⁻⁴‐15 × 10−4) and a mean tMRCA of the tree root of 73 days. The estimated R value was 2.6 (range, 2.1‐5.1), and increased from 0.8 to 2.4 in December 2019. The estimated mean doubling time of the epidemic was between 3.6 and 4.1 days. This study proves the usefulness of phylogeny in supporting the surveillance of emerging new infections even as the epidemic is growing.
Keywords: evolutionary dynamics, reproductive number, SARS‐CoV‐2
Highlights
The aim of this study was to investigate the temporal origin, rate of viral evolution and population dynamics of SARS‐CoV‐2.
The Bayesian approach used indicated a most probable origin of the epidemic between October and November 2019.
The estimated effective reproductive number increased from 0.8 to 2.4 in December 2019 when the mean doubling time was about 4 days.
This study proves the usefulness of phylogeny in supporting the surveillance of emerging new infections.
1. INTRODUCTION
On 30 January 2020, the World Health Organization declared that the outbreak of an infection due to a novel‐coronavirus (SARS‐CoV‐2) was a “Public Health Emergency of International Concern” (https://www.who.int/news‐room/detail/30‐01‐2020‐statement‐on‐the‐second‐meeting‐of‐the‐international‐health‐regulations‐(2005)‐emergency‐committee‐regarding‐the‐outbreak‐of‐novel‐coronavirus‐(2019‐nCoV)). Emerging as a human pathogen in the Chinese city of Wuhan, SARS‐CoV‐2 (https://www.who.int/docs/default‐source/coronaviruse/situation‐reports/20200121‐sitrep‐1‐2019‐ncov.pdf?sfvrsn=20a99c10_4) has caused a widespread outbreak of febrile respiratory illness and, as of 13 February 2020, there were 60 349 confirmed cases (including 527 outside mainland China) and a total of 1360 fatalities (https://gisanddata.maps.arcgis.com/apps/opsdashboard/index.html#/bda7594740fd40299423467b48e9ecf6).
Belonging to the β‐coronavirus genus of the Coronaviridae family, SARS‐CoV‐2 is closely related to SARS‐CoV as there is more than 70% nucleotide similarity in their approximately 30 kb long genomes. 1 A recent study has supported the view that, like other β‐coronaviruses causing human infections such as SARS‐CoV and MERS‐CoV, SARS‐CoV‐2 originated from bats, and reported 96% genomic identity with a previously detected SARS‐like bat coronavirus. 2 , 3 However, it remains unclear whether the spillover also involved a different intermediary animal host.
In the case of such an epidemic, it is important to make as reliable as possible an estimate of the basic reproductive number (R0, the number of cases generated from a single infected person) and the dynamics of transmission. The aim of this study was to investigate the temporal origin, rate of viral evolution and population dynamics of SARS‐CoV‐2 using 52 full genomes of viral strains sampled in different countries on known sampling dates available at the moment when the study was performed.
2. MATERIALS AND METHODS
2.1. Sequence dataset
The analysis was based on 52 SARS‐CoV‐2 sequences publicly available at Global Initiative on Sharing All Influenza Data (GISAID) on 4 February 2020 (https://www.gisaid.org/). The accession IDs, sampling dates and locations are summarized in Table S1.
The sequences were aligned using the ClustalW Multiple Alignment programs included in the accessory application of Bioedit software, manually controlled, and cropped to a final length of 29 774 bp using BioEdit v.7.2.6.1 (http://www.mbio.ncsu.edu/bioedit/bioedit.html.
2.2. Phylodynamic analysis
The simplest evolutionary model best fitting the sequence data were selected using software JmodelTest v.2.1.7 software, 4 and proved to be the Hasegawa‐Kishino‐Yano (HKY) model.
The virus' phylogeny, evolutionary rates, times of the most recent common ancestor (tMRCA) and demographic growth were coestimated in a Bayesian framework using a Markov chain Monte Carlo (MCMC) method implemented in v.1.8.4 of the BEAST package. 5
Different coalescent priors and molecular clock models (constant population size, exponential growth, and a Bayesian skyline plot [BSP]) were tested using strict and relaxed molecular clock models. Given the large credibility interval (CI) and high level of uncertainty due to very close sampling dates, all the estimates were made using days as the unit of time and a normal prior with substitution rates obtained from our preliminary estimates (mean rate 2.2 × 10⁻⁶ subs/site/day, with a standard deviation of 1.1 × 10⁻⁶).
The MCMC analysis was run until convergence with sampling every 100 000 generations. Convergence was assessed by estimating the effective sampling size (ESS) after 10% burn‐in using Tracer v.1.7 software (http://tree.bio.ed.ac.uk/software/tracer/), and accepting ESS values of 300 or more. The uncertainty of the estimates is indicated by 95% highest marginal likelihoods estimated 6 by path sampling (PS)/stepping stone (SS) methods. 7
The final trees were summarized by selecting the tree with the maximum product of posterior probabilities (pp) (maximum clade credibility) after a 10% burn‐in using Tree Annotator v.1.8.4 (included in the BEAST package) and were visualized using FigTree v.1.4.2 (http://tree.bio.ed.ac.uk/software/figtree/).
The basic reproductive number (R 0) was calculated on the basis of the exponential growth rate (r) using the equation R 0 = rD + 1, where D is the average duration of infectiousness estimated as described below. 8 The doubling time of the epidemic was directly estimated setting the tree before the coalescent exponential growth analysis with doubling time parameterization.
2.3. Birth‐death skyline estimates of the effective reproductive number (R e)
The birth‐death skyline model implemented in Beast 2.48 was used to infer changes in the effective reproductive number (R e), and other epidemiological parameters such as the death/recovery rate (δ), the transmission rate (λ), the origin of the epidemic, and the sampling proportion (ρ). 9 Given that the samples were collected during a short period of time, a “birth‐death contemporary” model was used.
The analyses were based on the previously selected HKY substitution model and the evolutionary rate was set to the value of 8.0 × 10⁻⁴ subs/site/year, which corresponds to the mean substitution rate estimated using a relaxed clock under the exponential coalescent model as transformed into units per year.
For the birth‐death analysis, one and two intervals and a lognormal prior to R e, with a mean (M) of 0.0 and a variance (S) of 1.0 were chosen, which allows the R e values to change between less than 1 (0.193) and more than 5. A normal prior with M = 48.7 and S = 15 (corresponding to a 95% interval from 24.0 to 73.4) was used for the rate of becoming uninfectious. These values are expressed as units per year and reflect the inverse of the time of infectiousness (5.3‐19 days; mean, 7.5) according to the serial interval estimated by Li et al. 10 Sampling probability (ρ) was estimated assuming a prior β (α = 1.0 and β = 999), corresponding to a minority of the sampled cases (between 10−5 and 10−3). The origin of the epidemic was estimated using a normal prior with M = 0.1 and S = 0.05 in units per year.
The MCMC analyses were run for 30 million generations and sampled every 3000 steps.
Convergence was assessed on the basis of ESS values (ESS > 200). Uncertainty in the estimates was indicated by 95% highest posterior density (HPD) intervals.
The mean growth rate was calculated on the basis of the birth and recovery rates (r = λ − δ), and the doubling time was estimated by the equation: doubling time = ln(2)/r. 11
3. RESULTS
The sequence analyses under a relaxed (uncorrelated lognormal) or strict molecular clock showed that the former performed better as assessed by using BF with PS and SS (strict vs relaxed molecular clock BF(PS) = −8.66 and BF(SS) = −10.7 for relaxed clock). Comparison of the different demographic models showed that the BSP model best fitted the data (BSP vs exponential growth BF(PS) = 7.3 and BF(SS) = 8.78 for BSP; BSP vs constant population size BF(PS)= 8.3; and BF(SS) = 10.7 for BSP).
The estimated mean evolutionary rate was 2.15 × 10⁻⁶ subs/site/day (95% HPD, 3.22 × 10⁻⁷‐4.18 × 10⁻⁶), corresponding to 7.8 × 10⁻⁴ subs/site/year (95% HPD, 1.1 × 10⁻⁴‐15 × 10−4).
The estimated mean tMRCA corresponding to the root of the tree dated 73 days before the end of January 2020 (95% HPD, 32.5‐142.3), corresponding to 18 November 2019 (95% HPD, 10 September 2019‐28 December 2019).
The Bayesian tree showed three main significant clades. The largest clade (pp = .84) encompassed 10 sequences and consisted of two significant subclades (pp = .9 and pp = 1). Overall, this cluster included fewer recent isolates than the other two clusters, and dated back to 47.5 days ago (95% HPD, 25.5‐76.6), corresponding to 13 December 2019. The second (pp = .99) and third significant clusters (pp = .95) dated back to 29.2 (95% HPD, 0.7‐47.45) and 21.9 (95% HPD 3.6‐54.7) days ago, corresponding to 1 to 8 January 2020.
The BSP showed a rapid increase in the number of infections in a period between approximately 45 and 30 days before the end of January 2020 (Figure 1A).
Figure 1.
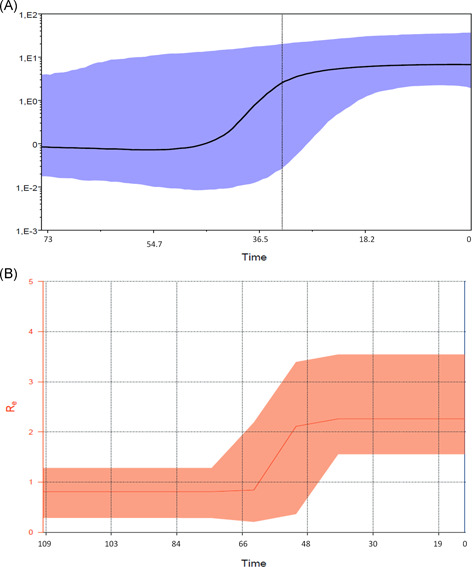
A, Bayesian skyline plot of the SARS‐CoV‐2 outbreak. The y‐axis indicates Ne and x‐axis shows the time in year units (0 = 30 January; 18.2 days; 36.5 days; 54.7 days; and 73 days before). The thick solid line represents the median value of the estimates, and the gray area the 95% HPD. B, Birth‐death skyline plot of the SARS‐CoV‐2 outbreak allowing two R e intervals. The curve and the orange area show the mean R e values and their 95% confidence intervals. The y and x‐axes, respectively, represent R values and time in days. HPD, highest posterior density
The IDs and available data of the sequences involved in the clades are shown in Table S1.
The estimated growth rate under the exponential growth model was 0.218 days−1, corresponding to an R 0 estimation of 2.6 (CI, 2.1‐5.1). The direct estimation of the doubling time of the epidemic gave a mean of 3.6 days (varying from 1.0 to 7.7). Figure 1B shows the Bayesian birth‐death skyline plot of the R e estimates with 95% HPD and indicates that R e increased from less than 1 (mean, 0.8; 95% HPD, 0.3‐1.3) to a mean value of 2.4 (95% HPD, 1.5‐3.5) in December 2019, and has since remained at this value. The estimation allowing a single R e gave a mean value of 1.85 (95% HPD, 1.37‐2.4).
Table 1 shows the parameters estimated using the birth‐death skyline plot. The epidemic originated an estimated mean of 3.7 months (CI, 3‐4) before the present (BP), corresponding to October to November 2019, before the root tree (3.6 months BP). The estimated recovery rate (the time to becoming noninfectious) was 7.3 days (CI, 4.7‐16.5 days), whereas the transmission rate (λ) increased from 40.5 to 112.4 in units per year in December 2019. On the basis of these values, the growth rate in the second period is r = 0.17 (0.16‐0.19), corresponding to a mean doubling time of 4.1 days (range, 3.9‐4.3).
Table 1.
Epidemiological parameters estimated by birth‐death skyline analysis
| Parameter | Mean estimate | 95% HPD low | 95% HPD up |
|---|---|---|---|
| R e1 | 0.8 | 0.29 | 1.3 |
| R e2 | 2.4 | 1.5 | 3.5 |
| Origin | 0.304 | 0.24 | 0.36 |
| Become uninfectious a | 49.8 | 22.1 | 78.3 |
| Birth1 b | 40.46 | 7.9 | 73.8 |
| Birth2 | 112.4 | 82.3 | 142.9 |
| ρ | 0.0044 | 0.00087 | 0.0086 |
| Tree root tMRCA | 0.296 | 0.24 | 0.35 |
Abbreviations: HPD, high posterior density; R e, recovery rate; ρ, sampling probability.
Transmission rate.
Effective reproductive number.
4. DISCUSSION
The SARS‐CoV‐2 epidemic is unique in the history of human infectious diseases not only because it is caused by a novel virus, but also because of the immediate availability of epidemiological and genomic data (the first entire genome was published on 24 December 2019). The prompt availability of research data on internet platforms such as the GISAID has allowed us and other research groups to make a phylogenetic reconstruction of the origin of SARS‐CoV‐2 and to share these findings with other scientists.
The temporal reconstruction of the SARS‐CoV‐2 phylogeny obtained in the present study is in line with previous estimates and suggests that the epidemic originated between October and November 2019, several weeks before the first cases were described. This was confirmed by means of coalescent analysis and the birth‐death method of estimating the origin of the epidemic. The estimated evolutionary rate is also in line with that of SARS and MERS viruses, 12 , 13 and the recent estimates concerning SARS‐CoV‐2 (http://virological.org/t/phylodynamic‐analysis‐67‐genomes‐08‐feb‐2020/356).
One of the most important epidemiological parameters when monitoring an epidemic is R 0 (ie, the number of secondary cases induced by a single infected individual in a totally susceptible population) because it is fundamental to assess the potential spread of a microorganism. Its value changes during an epidemic being called the effective reproduction number (R e). R 0 is usually estimated on the basis of the growth rate of the number of cases. The available epidemiological estimates of SARS‐CoV‐2 R 0 range from 2.2 to 2.9, although they changed from 1.4 to more than 7 during the first phases of the epidemic. 10 , 14
Recently developed evolutionary models have made it possible to estimate epidemiological parameters on the basis of phylogenesis, 9 , 15 and a coalescent and birth‐death methods were used to estimate R 0 and the changes in the R e of the SARS‐CoV‐2 epidemic during a short period of time. This has allowed us to make a preliminary estimate that mean R 0 from the beginning of the epidemic to the first days of February 2020 was 2.2 (range, 3.6‐5.8), and the birth‐death skyline analysis showed an increase in R e from less than 1 to 2.4 (CI, 1.5‐3.5) during December 2019. This agrees with the BSP analysis showing an increase in the number of infections in the same period of time. Commonly, the R e decreases during an epidemic because the decrease in the number of susceptible individuals. However, an increase in R e could be due to an increase in the transmissibility of the virus or in the contact rates within the population. 16 It is, therefore, possible to hypothesize, on the basis of our data, that the first passage of the virus from animal to human occurred through rather inefficient and still unknown transmission modes causing relatively few cases in the early times (before December). In December, the virus acquired a more efficient mode of human‐to‐human transmission (ie, through droplets), causing exponential growth also detected by the skyline.
On the same basis, the estimated epidemic doubling time was 3.6 days with a CI between 1 and 7 days. We also tried to calculate it on the basis of the transmission (λ) and recovery rate (δ) estimated using the birth‐death model, which lead to an estimated mean doubling time of 4.1 days, with the most probable values falling between 3.9 and 4.3 days. Previous studies have suggested that the doubling time during the early phases of the epidemic was approximately 7.4 days. 10 The difference in the estimate here obtained, may be due to the increased epidemic growth rate observed during the last days of January, or the initial delay in recognizing and reporting new cases.
This preliminary study has some limitations. The R values and doubling times were estimated phylogenetically using all of the whole genomes available in a public database at the time the study was carried out (https://www.gisaid.org/). Given the small number of sequences and the relatively short sampling period, the CIs are wide and limit the precision of the estimates. Moreover, the analysis included isolates collected outside mainland China as it is assumed that they all belong to the same epidemic originating in Wuhan.
Serial intervals were used to estimate the duration of infectiousness, although we do not yet have any information concerning the possible existence and duration of a latent (preinfectious) period that would contribute to the serial interval.
More detailed and accurate analyses can be made when a larger number of genomes and more precise data on the infectious period become available. However, although the R 0 calculated on the basis of the direct observation of the number of infected individuals may be affected by omissions or delayed notifications of cases, 17 a phylogenetic estimate of the same parameter may be more reliable.
This became particularly evident recently (on 12 February 2020) when the change in diagnosis classification led to a sudden increase in the reported cases by Hubei, China (https://myemail.constantcontact.com/COVID‐19‐Updates‐‐‐Feb‐12.html?soid=1107826135286&aid=Kdg8a0rBTAk).
In conclusion, these results allowed us to make a phylogenetic estimate of the R 0 of SARS‐CoV‐2 infection that is similar to that obtained using conventional epidemiological methods 18 (https://www.who.int/news‐room/detail/23‐01‐2020‐statement‐on‐the‐meeting‐of‐the‐international‐health‐regulations‐(2005)‐emergency‐committee‐regarding‐the‐outbreak‐of‐novel‐coronavirus‐(SARS‐CoV‐2), and a possibly shorter estimated doubling time of the number of subjects involved at least during the early phases of the epidemic. They also support the usefulness of phylodynamic as an important complement to classic approaches to the surveillance and monitoring of an emerging infection, even during the course of an epidemic.
CONFLICT OF INTERESTS
The authors declare that there are no conflict of interests.
AUTHOR CONTRIBUTIONS
AL, GZ, and MG conceived and designed the study. AB, CA, and AL collected data and prepared the datasets. GZ, AL, and AB participated to phylogenetic analyses. AL, GZ, AB, and MG wrote the first draft of the manuscript. All authors contributed to manuscript revision, read, and approved the submitted version.
Supporting information
Supplementary information
Supplementary information
ACKNOWLEDGMENT
We acknowledge the authors, originating and submitting laboratories of the sequences from GISAID.
Lai A, Bergna A, Acciarri C, Galli M, Zehender G. Early phylogenetic estimate of the effective reproduction number of SARS‐CoV‐2. J Med Virol. 2020;92:675–679. 10.1002/jmv.25723
In memory of Li Wenliang, Carlo Urbani, and of all the doctors and health workers who endangered their lives in the fight against epidemics.
REFERENCES
- 1. Lu R, Zhao X, Li J, et al. Genomic characterisation and epidemiology of 2019 novel coronavirus: implications for virus origins and receptor binding. Lancet. 2020;395:565‐574. [DOI] [PMC free article] [PubMed] [Google Scholar]
- 2. Paraskevis D, Kostaki EG, Magiorkinis G, Panayiotakopoulos G, Sourvinos G, Tsiodras S. Full‐genome evolutionary analysis of the novel corona virus (2019‐nCoV) rejects the hypothesis of emergence as a result of a recent recombination event. Infect Genet Evol. 2020;79:104212. [DOI] [PMC free article] [PubMed] [Google Scholar]
- 3. Zhou P, Yang X‐L, Wang X‐G, et al. A pneumonia outbreak associated with a new coronavirus of probable bat origin. Nature. 2020. 10.1038/s41586-020-2012-7 [DOI] [PMC free article] [PubMed] [Google Scholar]
- 4. Posada D. jModelTest: phylogenetic model averaging. Mol Biol Evol. 2008;25(7):1253‐1256. [DOI] [PubMed] [Google Scholar]
- 5. Drummond AJ, Suchard MA, Xie D, Rambaut A. Bayesian phylogenetics with BEAUti and the BEAST 1.7. Mol Biol Evol. 2012;29(8):1969‐1973. [DOI] [PMC free article] [PubMed] [Google Scholar]
- 6. Suchard MA, Weiss RE, Sinsheimer JS. Bayesian selection of continuous‐time Markov chain evolutionary models. Mol Biol Evol. 2001;18(6):1001‐1013. [DOI] [PubMed] [Google Scholar]
- 7. Baele G, Lemey P, Bedford T, Rambaut A, Suchard MA, Alekseyenko AV. Improving the accuracy of demographic and molecular clock model comparison while accommodating phylogenetic uncertainty. Mol Biol Evol. 2012;29(9):2157‐2167. [DOI] [PMC free article] [PubMed] [Google Scholar]
- 8. Pybus OG, Charleston MA, Gupta S, Rambaut A, Holmes EC, Harvey PH. The epidemic behavior of the hepatitis C virus. Science. 2001;292(5525):2323‐2325. [DOI] [PubMed] [Google Scholar]
- 9. Stadler T, Kuhnert D, Bonhoeffer S, Drummond AJ. Birth‐death skyline plot reveals temporal changes of epidemic spread in HIV and hepatitis C virus (HCV). Proc Natl Acad Sci U S A. 2013;110(1):228‐233. [DOI] [PMC free article] [PubMed] [Google Scholar]
- 10. Li Q, Guan X, Wu P, et al. Early transmission dynamics in Wuhan, China, of novel coronavirus‐infected pneumonia. N Engl J Med. 2020. [DOI] [PMC free article] [PubMed] [Google Scholar]
- 11. Walker PR, Pybus OG, Rambaut A, Holmes EC. Comparative population dynamics of HIV‐1 subtypes B and C: subtype‐specific differences in patterns of epidemic growth. Infect Genet Evol. 2005;5(3):199‐208. [DOI] [PubMed] [Google Scholar]
- 12. Lipsitch M. Transmission dynamics and control of severe acute respiratory syndrome. Science. 2003;300(5627):1966‐1970. [DOI] [PMC free article] [PubMed] [Google Scholar]
- 13. Assiri A, McGeer A, Perl TM, et al. Hospital outbreak of Middle East respiratory syndrome coronavirus. N Engl J Med. 2013;369(5):407‐416. [DOI] [PMC free article] [PubMed] [Google Scholar]
- 14. Liu T, Hu J, Kang M, et al. Transmission dynamics of 2019 novel coronavirus (2019‐nCoV). bioRxiv. 2020;2020(2001):2025. [Google Scholar]
- 15. Veo C, Della Ventura C, Moreno A, et al. Evolutionary dynamics of the lineage 2 West Nile virus that caused the largest European epidemic: Italy 2011‐2018. Viruses. 2019;11(9):814. [DOI] [PMC free article] [PubMed] [Google Scholar]
- 16. Towers S, Patterson‐Lomba O, Castillo‐Chavez C. Temporal variations in the effective reproduction number of the 2014 west Africa ebola outbreak. PLoS Currents. 2014;6, 10.1371/currents.outbreaks.9e4c4294ec8ce1adad283172b16bc908 [DOI] [PMC free article] [PubMed] [Google Scholar]
- 17. Zhao S, Musa SS, Lin Q, et al. Estimating the unreported number of novel coronavirus (2019‐nCoV) cases in China in the first half of January 2020: a data‐driven modelling analysis of the early outbreak. J Clin Med. 2020;9(2):388. [DOI] [PMC free article] [PubMed] [Google Scholar]
- 18. Zhao S, Lin Q, Ran J, et al. Preliminary estimation of the basic reproduction number of novel coronavirus (2019‐nCoV) in China, from 2019 to 2020: a data‐driven analysis in the early phase of the outbreak. Int J Infect Dis. 2020;92:214‐217. [DOI] [PMC free article] [PubMed] [Google Scholar]
Associated Data
This section collects any data citations, data availability statements, or supplementary materials included in this article.
Supplementary Materials
Supplementary information
Supplementary information