

Abstract
Background
Brain death (BD)-related lipid peroxidation, measured as serum malondialdehyde (MDA) levels, correlates with delayed graft function in renal transplant recipients. How BD affects lipid peroxidation is not known. The extent of BD-induced organ damage is influenced by the speed at which intracranial pressure increases. To determine possible underlying causes of lipid peroxidation, we investigated the renal redox balance by assessing oxidative and antioxidative processes in kidneys of brain-dead rats after fast and slow BD induction.
Methods
Brain death was induced in 64 ventilated male Fisher rats by inflating a 4.0F Fogarty catheter in the epidural space. Fast and slow inductions were achieved by an inflation speed of 0.45 and 0.015 mL/min, respectively, until BD confirmation. Healthy non–brain-dead rats served as reference values. Brain-dead rats were monitored for 0.5, 1, 2, or 4 hours, after which organs and blood were collected.
Results
Increased MDA levels became evident at 2 hours of slow BD induction at which increased superoxide levels, decreased glutathione peroxidase (GPx) activity, decreased glutathione levels, increased inducible nitric oxide synthase and heme-oxygenase 1 expression, and increased plasma creatinine levels were evident. At 4 hours after slow BD induction, superoxide, MDA, and plasma creatinine levels increased further, whereas GPx activity remained decreased. Increased MDA and plasma creatinine levels also became evident after 4 hours fast BD induction.
Conclusion
Brain death leads to increased superoxide production, decreased GPx activity, decreased glutathione levels, increased inducible nitric oxide synthase and heme-oxygenase 1 expression, and increased MDA and plasma creatinine levels. These effects were more pronounced after slow BD induction. Modulation of these processes could lead to decreased incidence of delayed graft function.
Delayed graft function (DGF) is a serious complication in 20% to 35% of the renal transplant recipients.1–3 Kidney grafts from brain-dead donors, the most frequently transplanted grafts, lead to DGF in 15% to 30% of the cases.4,5 These findings cannot be solely attributed to HLA mismatches, older donor age, or longer cold ischemia times.6 Instead, the systemic effects of brain death (BD), which comprise ischemic, inflammatory, and metabolic changes, also affect donor kidney quality and thereby the performance of the future allograft.7–9
Several studies show that BD is associated with oxidative damage of cellular lipid membranes.8,10 Lipid peroxidation leads to membrane permeabilization and impairment of enzymatic processes and ion pumps which results in membrane dysfunction and cell toxicity.11–13 Brain death-related lipid peroxidation is correlated with DGF in renal transplant recipients. Levels of malondialdehyde (MDA), a product of lipid peroxidation, in the preservation solution of kidneys retrieved from brain-dead donors correlate well with DGF.10 Moreover, donor serum MDA levels correlate with acute rejection and immediate and long-term renal allograft function. In expanded criteria donors, MDA levels in machine perfusion solution also correlate with DGF.14
Increased lipid peroxidation can result from increased oxidant production and/or decreased antioxidative defenses. Hemodynamic, inflammatory, and metabolic changes can all independently lead to increased oxidant production15–17 through enzymes, such as xanthine oxidase, nicotinamide adenine dinucleotide phosphate (NAPDH) oxidase, nitric oxide synthase, and mitochondrial electron transport complexes.18 High levels of oxidants or the reaction of oxidants with proteins can lead to the impairment of antioxidant defense systems, such as glutathione peroxidase (GPx), catalase (CAT), and superoxide dismutase (SOD).19
Brain death-related processes, such as the catecholamine storm and inflammatory processes, are influenced by the speed at which intracranial pressure (ICP) increases.20,21 Clinically, traumatic brain insults usually lead to faster increases in ICP and therefore progress to BD more quickly than cerebrovascular causes.22,23 Because BD-related processes are influenced by the speed at which ICP increases, it is likely that oxidative and antioxidative processes differ between these BD donor types.
Previous reports on oxidative processes in brain-dead donors solely mention the formation of lipid peroxidation products (MDA) in plasma.7,8 We hypothesize that the renal redox balance and possible underlying oxidative and antioxidative processes are cardinal in the process of lipid peroxidation and that these processes are affected by the speed at which ICP increases. Studying these processes in renal tissue of different BD donor types could provide valuable information for the development of targeted antioxidative therapy and thereby improve transplantation outcomes. To assess possible underlying causes of lipid peroxidation, we investigated the renal redox balance by assessing oxidative and antioxidative processes in kidneys and plasma of brain-dead rats after fast and slow BD induction.
MATERIALS AND METHODS
Animal BD Model
The amount of animals per group was calculated using the method of Lenth.24 With a meaningful difference of 50%, a variability (Σ) of 0.3 and a power of 0.9, 8 rats were required per group. Sixty-four male adult Fisher F344 rats (250-300 g) were randomly assigned to either fast or slow BD induction with a BD duration of 0.5, 1, 2, or 4 hours. These time points were chosen as dynamic effects are observed at these time points which resemble longer clinical brain-dead periods.7,8 Furthermore, maintaining rats stable for longer periods poses difficulties as cardiac and pulmonary failure become evident. Healthy non–brain-dead rats served as reference values. All animals received care in compliance with the guidelines of the local animal ethics committee according to Experiments on Animals Act (1996) issued by the Ministry of Public Health, Welfare and Sports of the Netherlands.
BD Induction
Animals were anesthetized using isoflurane with 100% O2. Animals were intubated via a tracheostomy and ventilated (tidal volume: 6.5 mL/body weight (kg) per stroke, positve end expiratory pressure of 3 cm of H20, initial respiratory rate of 120 and corrected based on ETCO2) throughout the experiment. Two cannulas were inserted in the femoral artery and vein for continuous mean arterial pressure (MAP) monitoring and volume replacement. Through a frontolateral hole drilled in the skull, a no. 4 Fogarty catheter (Edwards Lifesciences Co, Irvine, CA) was placed in the epidural space and inflated with saline using a syringe pump (Terumo, Tokyo, Japan). Fast and slow induction of BD was achieved by inflating the catheter at a speed of 0.015 or 0.45 mL/min, respectively. These speeds were chosen based on consistent results from previous studies.8,25 In the slow induction model, inflation of the balloon was halted once a rise in the MAP above 80 mm Hg was noted, reflecting the catecholamine storm at the onset of BD. In the fast induction model, the catheter was inflated for 1 minute. Brain death was confirmed in both groups by the absence of corneal reflexes.
BD Period
After confirmation of BD, ventilation was continued and anesthesia was terminated. Mean arterial pressure was considered normal if 80 mm Hg or higher. If MAP decreased below normal levels, colloid infusion with polyhydroxyethyl starch 10% (Fresenius Kabi AG, Bad Homburg, Germany) was administered (at a maximum rate of 1 mL/h) to maintain MAP of 80 mm Hg or greater. If necessary, intravenous noradrenaline (NA) (1 mg/mL) was administered. A homeothermic blanket control system was used throughout the experiment. After the experimental time, blood and urine were collected, after which organs were flushed with cold saline. After the flush out, organs were harvested and tissue samples were snap-frozen in liquid nitrogen and stored at −80°C or fixed in 4% paraformaldehyde. Plasma samples were also snap-frozen and stored.
Determination of Superoxide Production With Dihydroethidium Staining
Four-μm cryosections were mounted on slides and washed with Dulbecco phosphate-buffered saline (DPBS). Sections were incubated with 10 μM dihydroethidium (Sigma, St. Louis, MO) dissolved in DPBS at 37°C in the dark for 30 minutes. Sections were washed twice with DPBS and immediately scanned for superoxide with a Leica inverted fluorescence microscope equipped with rhodamine filter settings. Images were acquired at 40× magnification and analyzed using NCBI ImageJ.
Antioxidative Activity Assessment of Glutathione Peroxidase, SOD, and CAT
To measure antioxidative enzymatic responses to oxidative processes, we measured the activities of glutathione peroxidase, SOD, and CAT. Commercially available kits were purchased from Cayman Chemical to perform the assays. The assays were performed according to manufacturer’s protocol and results were expressed as nmol/min per mg protein or as Units/mg protein.
Antioxidative Activity Assessment of Glutathione Reductase
Glutathione reductase (GR) activity measurement was adapted from a method by Griffith.26 Tissue was lysed in cell lysis buffer composed of 253 M HEPES, 5 mM MgCl2, 5 mM ethyhelenediaminetetraacetic (EDTA), 2 mM phenylmethylsulfonyl fluoride (PMSF) and 10 ng/μL pepstatine and leupeptine (Sigma). The buffer was adjusted to a final pH of 7.5. Cell suspensions were centrifuged, and the supernatant was analyzed. Reduced glutathione (GSH) and oxidized glutathione (GSSG) were quantified as follows. Briefly, 20 to 50 μl of the supernatant was added to buffer A (125 mM NaH2PO4.H2O and 6.3 mM NaEDTA adjusted to pH 7.5 with NaOH) to a total volume of 100 μL in a transparent flat bottom 96-well plate. Next, 20 μL of 6 mM 5-5′-dithiobis-2-nitrobenate (Sigma), 42 μL of 0.3 mM NADPH (Roche Diagnostics, Germany), and 10 μL of 1 mM GSH solution, all dissolved in buffer A, were added to each well. The final volume of the mixture was increased to 200 μL by adding buffer A. The absorbance was measured at 430 nm for 15 minutes at 30°C. The linear part of the kinetic curve was used for the rate estimation and compared with a standard curve of GR. Samples were corrected for total amount of protein and expressed as units/mg protein.
Intracellular Redox Status Assessment by GSH and GSSG Measurements
The GSH and GSSG were measured according to the method of Griffith.26 Tissue was lysed in cell lysis buffer composed of 253 M HEPES, 5 mM MgCl2, 5 mM EDTA, 2 mM PMSF, and 10 ng/μL pepstatin, and leupeptin (Sigma). The buffer was adjusted to a final pH of 7.5. Cell suspensions were centrifuged, and the supernatant was analyzed. To measure total glutathione, 20 μL of the supernatant or plasma was added to buffer A (125 mM NaH2PO4.H20 and 6.3 mM NaEDTA adjusted to pH 7.5 with NaOH) to a total volume of 100 μL in a transparent flat bottom 96-well plate. Next, 20 μl of 6 mM 5-5′-dithiobis-2-nitrobenate (Sigma), 42 μL of 0.3 mM NADPH (Roche Diagnostics, Germany), all dissolved in buffer A, were added to the wells. Finally, 38 μL of GR (Roche Diagnostics) dissolved to an enzyme activity of 5 units/mL in buffer A was added to the wells. The absorbance was measured at 430 nm for 15 minutes at 30°C. The linear part of the kinetic curve was used for the rate estimation and compared with a standard curve of GSSG. Samples were corrected for total amount of protein and expressed μmol/g protein. To measure GSSG, 1-methyl-2-vinyl pyridinium triflate (Sigma) was added at a concentration of 3 mM to the supernatant to block GSH. Reduced glutathione content was calculated by subtracting GSSG from the total glutathione values while correcting for the molecular weight of the molecules.
RNA Isolation and quantitive polymerase chain reaction (qPCR)
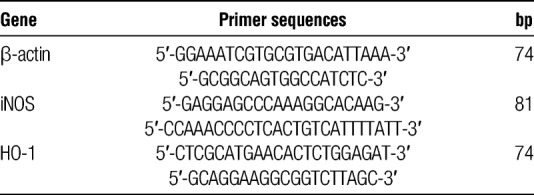
RNA isolation and qPCR were performed as described before8 In brief, the spin or vacuum total RNA isolation (Promega, Leiden, the Netherlands) kit was used to isolate total RNA from rat kidneys. Genomic DNA contamination was verified by RT-PCR reactions by omitting reverse transcriptase with the use of β-actin primers. T11VN oligos and M-MLV (Invitrogen, Breda, the Netherlands) were used for cDNA synthesis from 1 μg total RNA. The ABI Prism 7900-HT Sequence Detection System (Applied Biosystems, Waltham, MA) was used to perform amplification and detection with the use of emission of SYBR green (Applied Biosystems). Assays were performed in triplo. A dissociation curve and gel electrophoresis were used to test for the specificity of qPCR products. Normalization of gene expression was achieved by standardizing to the mean of β-actin mRNA content. Results were expressed as 2^(−[INCREMENT][INCREMENT]ct) (CT threshold cycle). Primer Express software (Applied Biosystems) was used to design amplification primers (Table 1).
TABLE 1.
qPCR primer sequences of the genes β-actin, iNOS, and HO-1
Determination of Oxidative Damage Through Lipid Peroxidation Quantification
Malondialdehyde was measured fluorescently after binding to thiobarbituric acid. Twenty microliters of kidney tissue homogenates were mixed with 2% sodium dodecyl sulfate and 5 mM butylated hydroxytoluene followed by 400 μL 0.1 N HCL, 50 μL 10% phosphotungstic acid, and 200 μL 0.7% thiobarbituric acid. The mixture was incubated for 1 hour at 97 °C. 800 μL 1-butanol was added to the samples and centrifuged at 960g. 200 μL of the 1-butanol supernatant was fluorescently measured at 480-nm excitation and 590-nm emission wavelengths. Samples were corrected for amount of protein and expressed as μmol/g protein.
Statistical Analyses
Data were analyzed using GraphPad Prism 5.04 (GraphPad, San Diego, CA). Fast and slow induction groups were compared to reference groups using the Kruskal-Wallis test with Dunn post hoc correction. Fast and slow induction groups were compared with each other per time point using the Mann-Whitney U test with Bonferroni correction. P less than 0.05 was considered statistically significant. All data are expressed as the mean ± SD.
RESULTS
BD Induction
One animal from the slow induction 2 hours group, 2 from the fast induction 2 hours group, and 1 from the fast induction 4 hours group were discarded due to unknown amounts of NA administration. One animal was discarded in the fast induction 4 hours group due to a prolonged apnea test because of uncertainty of BD.
Hemodynamic Support
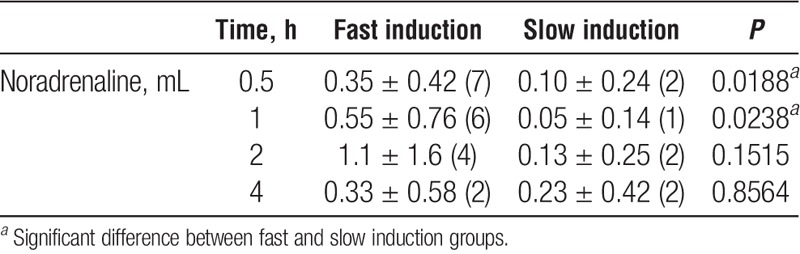
More NA administration was required after fast BD induction compared with slow BD induction at 0.5 and 1 hours (Table 2) which was not observed at other time points. No differences in polyhydroxyethyl starch administration were observed between fast and slow BD induction at the different time points.
TABLE 2.
Total noradrenaline (1 mg/mL) infusion requirements and number of rats which required noradrenaline
Plasma Creatinine Values
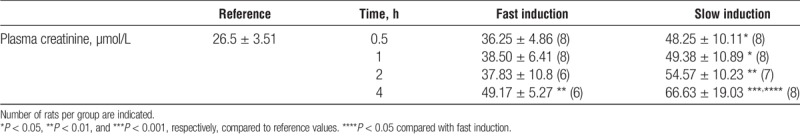
Plasma creatinine values were significantly increased after 4 hours by fast induction compared with reference values (P < 0.01). After slow induction, creatinine values were significantly increased at 0.5, 1, 2, and 4 hours compared with reference values (P < 0.05, 0.05, 0.01 and 0.001 respectively; Table 3). Plasma creatinine values were significantly increased by slow compared with fast induction BD at 4 hours (P < 0.05).
TABLE 3.
Plasma creatinine levels in reference and fast and slow induction groups
Superoxide Production With Dihydroethidium Staining
Superoxide was increased at 0.5 hours of BD by both fast- and slow BD induction compared with reference values (P < 0.001 and P < 0.05, respectively, Figure 1). Marked increases in superoxide production were also observed at 2 and 4 hours after slow induction compared with reference values (P < 0.01 and P < 0.001). Superoxide was significantly increased after slow BD induction at 4 hours compared with fast induction (P < 0.05).
FIGURE 1.
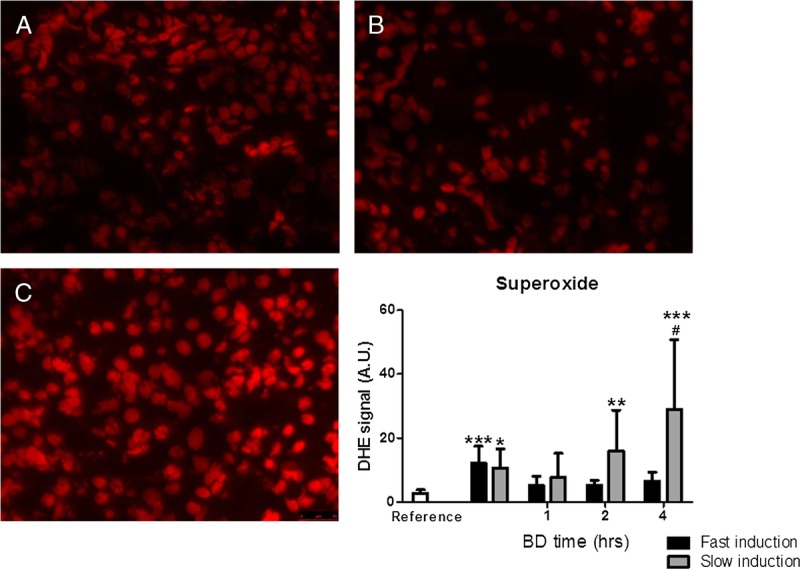
Renal superoxide generation measured by DHE fluorescence in panel A. Healthy non–brain-dead rats (reference values). B, Fast-induction brain-dead rats. C, Slow-induction brain-dead rats after 4 hours of BD. *P < 0.05, **P < 0.01, and ***P < 0.001, respectively, compared with reference values. #P < 0.05 compared with fast induction. 40× magnification. DHE, dihydroethidium.
Glutathione Peroxidase Activity
Glutathione peroxidase activity was significantly decreased after slow induction of BD at 0.5, 1, and 2 hours compared with reference values (P < 0.05, 0.01, and 0.05, respectively, Figure 2) but increased at 4 hours. After slow induction of BD, GPx activity decreased significantly at 1 hour and remained decreased at 2 and 4 hours compared with reference values (P < 0.05, 0.05, and 0.01, respectively, Figure 2).
FIGURE 2.
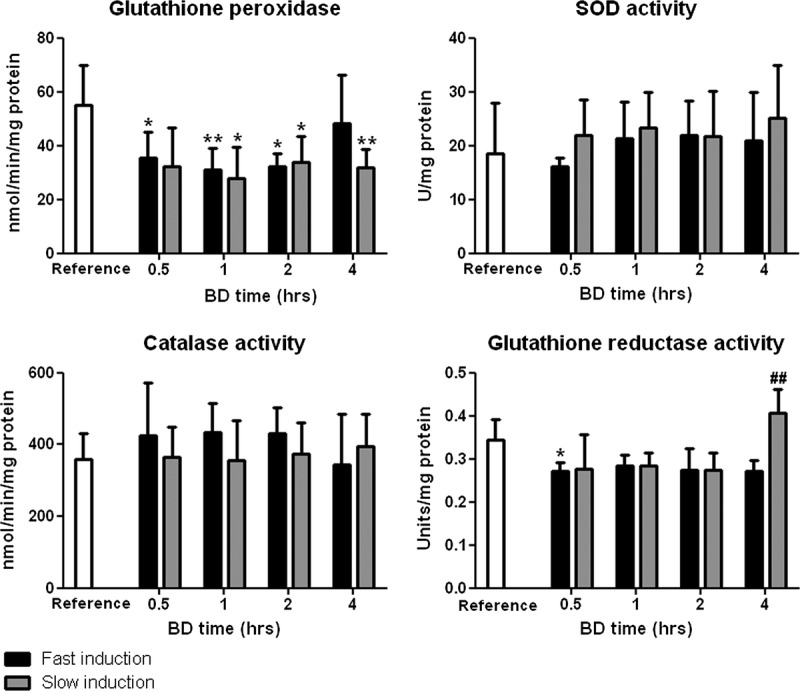
Renal enzymatic activities of glutathione peroxidase, SOD, catalase, and glutathione reductase after 0.5, 1, 2, and 4 hours of BD. Healthy non-brain dead rats served as reference values. *P < 0.05 and **P < 0.01 compared to reference values. ##P < 0.01 compared with fast induction.
SOD Activity
Superoxide dismutase activity remained stable at different BD time points. No differences were observed between groups at different time points (Figure 2).
CAT Activity
Catalase activity was not affected by either fast or slow induction compared with reference values. No differences were observed between groups at different time points (Figure 2).
GR Activity
Glutathione reductase activity decreased significantly after fast BD induction at 0.5 hours compared to reference values (P < 0.05, Figure 2). Furthermore, the activity was significantly increased after slow BD induction at 4 hours compared with fast induction (P < 0.01, Figure 2).
GSH, GSSG, GSH + GSSG (Total Glutathione) Levels and GSSG/GSH Ratio
Reduced glutathione levels decreased after both fast and slow BD inductions but only reached significance after slow induction at 2 hours compared with reference values (P < 0.05, Figure 3). The GSSG levels were significantly increased after slow induction of BD compared with reference values (P < 0.01, Figure 3). Furthermore, GSSG levels were significantly increased after slow BD induction at 4 hours compared with fast induction (P < 0.05). Total glutathione levels were unchanged after both fast and slow BD inductions. The GSSG/GSH ratio did not change significantly between groups at different time points.
FIGURE 3.
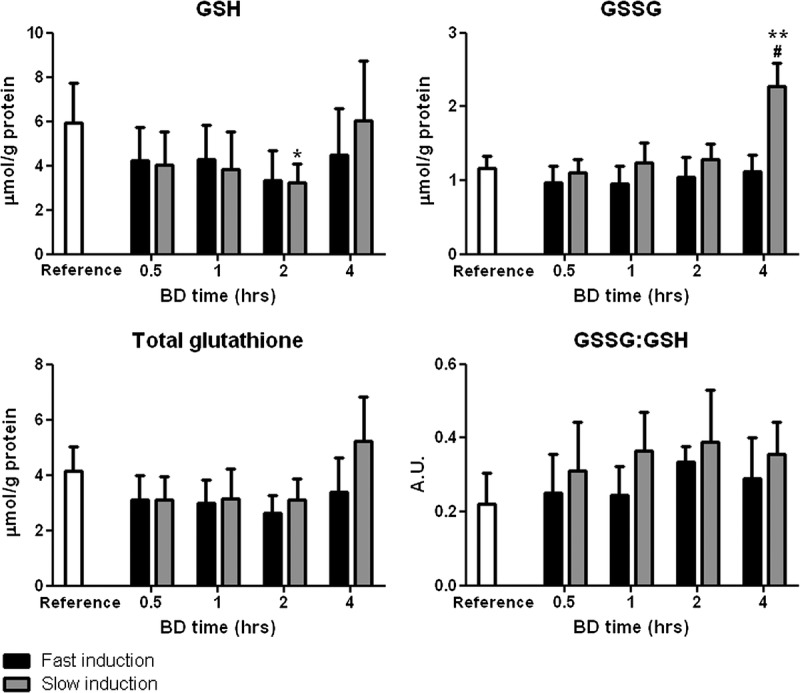
Renal levels of GSH, GSSG, total glutathione (GSH + GSSG), and the ratio of oxidized to reduced glutathione (GSSG/GSH) after 0.5, 1, 2, and 4 hours of BD. Healthy non–brain-dead rats served as reference values. *P < 0.05 and **P < 0.01, respectively, compared with reference values. #P < 0.05 compared with 4 hours fast induction.
Renal Gene Expression Levels
Heme-oxygenase 1 (HO-1) and inducible nitric oxide synthase (iNOS) gene expressions were increased at all BD time points after both fast and slow BD induction. Fast induction resulted in significantly increased iNOS gene expression compared with reference values after 2 and 4 hours of BD (P < 0.01 and 0.001, respectively, Figure 4). Slow induction resulted in earlier increases, namely, after 1, 2, and 4 hours of BD (P < 0.01, 0.01, and 0.001, respectively, Figure 4). Heme-oxygenase 1 gene expression showed a similar pattern in that slow induction of BD led to an earlier increase. Heme-oxygenase 1 gene expression was significantly increased after fast induction of BD at 2 and 4 hours compared with reference values (P < 0.05 and 0.001, respectively, Figure 4) while after slow induction of BD, significantly increased HO-1 gene expression was observed at 1, 2, and 4 hours compared with reference values (P < 0.05, 0.01, and 0.001, respectively, Figure 4). Finally, HO-1 gene expression was significantly higher after slow BD induction at 4 hours compared with fast induction (P < 0.05).
FIGURE 4.
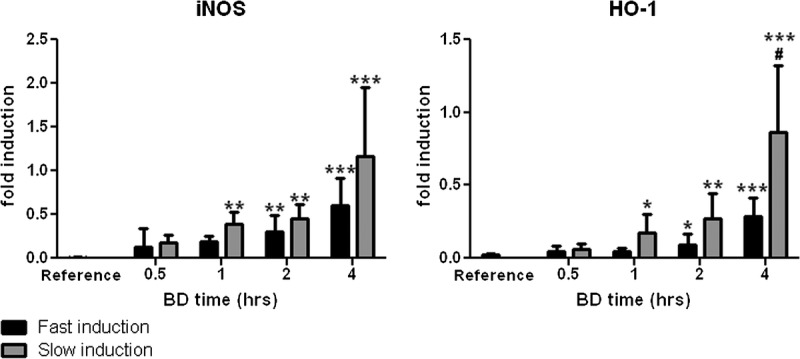
Renal mRNA expression levels of iNOS and HO-1 after 0.5, 1, 2, and 4 hours of BD. Non–brain-dead rats served as reference values. *P < 0.05, **P < 0.01, and ***P < 0.001, respectively, compared to reference values. #P < 0.05 compared with fast induction.
Lipid Peroxidation Levels
The MDA levels were increased significantly at 4 hours of BD by both fast and slow BD inductions compared with reference values (P < 0.05 and P < 0.01, Figure 5). The MDA levels were significantly increased after slow BD induction at 2 and 4 hours compared with fast induction (P < 0.001 and P < 0.01).
FIGURE 5.
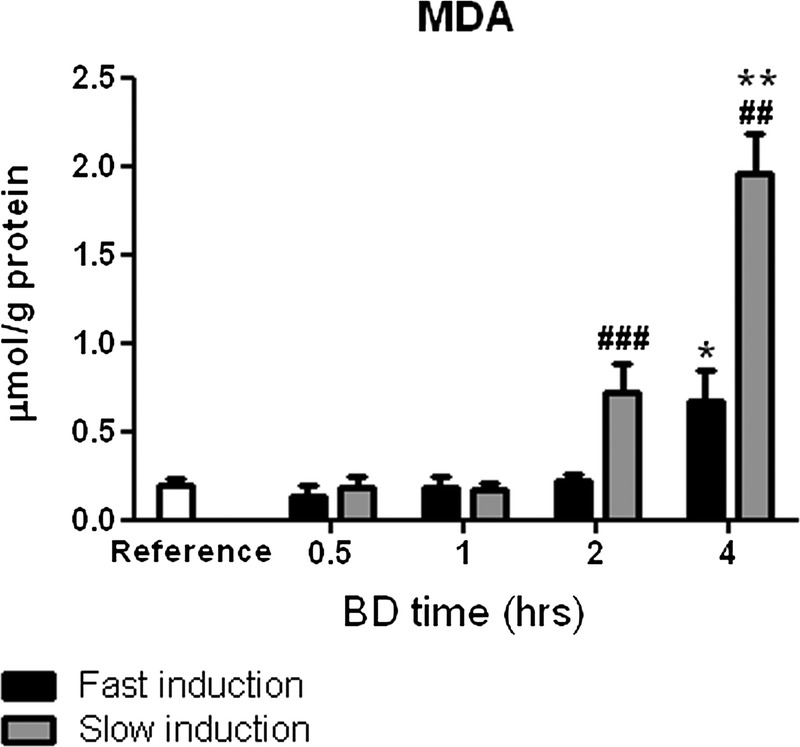
Renal lipid peroxidation as measured by MDA levels after 0.5, 1, 2, and 4 hours of BD. Healthy non–brain-dead rats served as reference values. *P < 0.05 and **P < 0.01, respectively, compared to reference values. ##P < 0.01 and ###P < 0.001 compared with fast induction.
Total plasma glutathione (GSH + GSSG) levels
Total glutathione levels in the plasma were unchanged at early BD time points but were significantly increased after slow induction of BD at 4 hours compared with reference values (P < 0.05, Figure 6).
FIGURE 6.
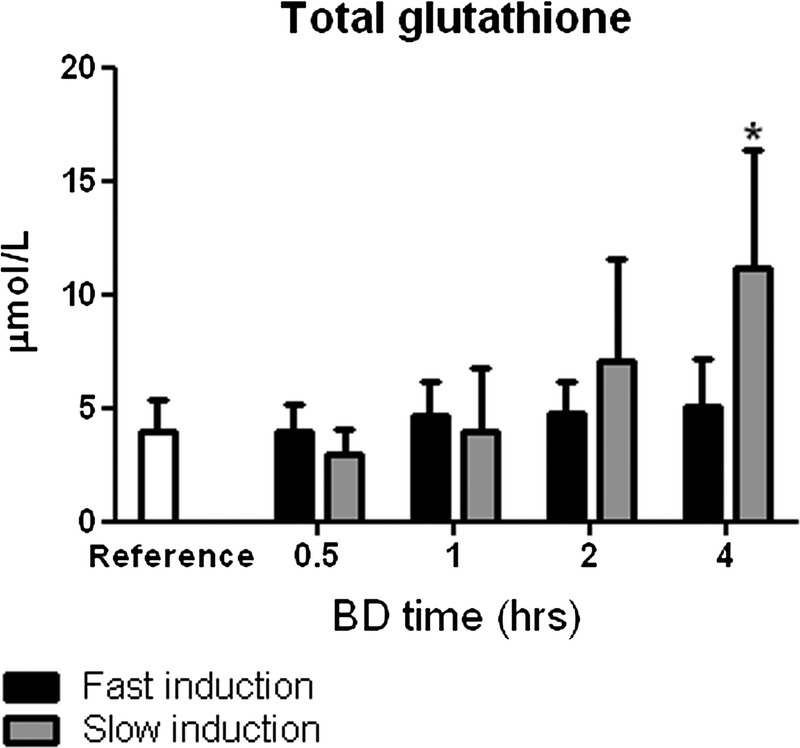
Plasma levels of total glutathione (GSH + GSSG) after 0.5, 1, 2, and 4 hours of BD. Healthy non–brain-dead rats served as reference values. *P < 0.05 compared with reference values.
DISCUSSION
The main finding of this study is that BD leads to increased renal superoxide production, decreased GPx activity, decreased GSH levels, increased iNOS and HO-1 expression, increased MDA levels, and increased plasma creatinine levels. The effects we observed were more pronounced when BD was induced slowly which might explain differences in performance of donor kidneys derived from different donor types.27
The fact that graft quality is affected by the speed at which ICP increases has been shown previously. A faster increase in ICP leads to increased myocardial damage and decreased function which is likely related to higher levels of hypertension due to increased catecholamine release.20 Traumatic brain injury, which usually leads to a quick rise in ICP, is a risk factor for mortality in heart recipients.28 In contrast, our study shows that a slower increase in ICP leads to increased lipid peroxidation. Rather than hypertension, this could be related to hypotension and the resulting ischemia, which is observed in patients with cerebrovascular brain insults.29 These patients tend to progress to BD less quickly than patients who suffer traumatic brain injury. Cerebrovascular causes of death in the donor are indeed a risk factor for renal graft dysfunction in transplant recipients.27 However, this increased risk is attributed to donor-specific characteristics, such as age, hypertension, and cardiovascular disease, while we show here that the speed at which ICP increases could be of influence as well. Regardless of the nature of brain insults, the speeds at which brain injuries lead to BD vary greatly between patients. In a series of patients with middle cerebral artery infarction, BD occurred anywhere between 24 hours and 1 week.22 A similar time range was evident in patients with subarachnoid hemorrhage.23 Therefore, antioxidative therapy could be especially beneficial in donors who progress to BD slowly after cerebral insults, regardless of the nature of the insult.
Brain death leads to phases of renal ischemia as a result of the catecholamine storm, volume depletion, and neurogenic shock.30,31 In classic models of renal ischemia-reperfusion injury, increased superoxide production, decreased GPx, SOD, and CAT activity, decreased GSH levels, and increased MDA and plasma creatinine levels are observed.32–34 Similar effects were observed in our BD model. In many models, increased superoxide production takes a central role in decreasing GPx activity, GSH levels, MDA levels, and increasing plasma creatinine levels.35–37 Considering the time points at which superoxide production is increased in our model, it is likely that superoxide also fulfills a central role in initiating the effects observed in our model, including lipid peroxidation, and therefore increases the risk of DGF in transplant recipients (Figure 7). Thus, the administration of superoxide scavengers to brain-dead donors, especially those progressing to BD slowly, could lead to improved renal transplantation outcomes. Furthermore, considering the decreased GPx activity at almost all time points and its specific role in protecting lipid membranes, the administration of GPx mimetics could exert beneficial effects as well.38
FIGURE 7.
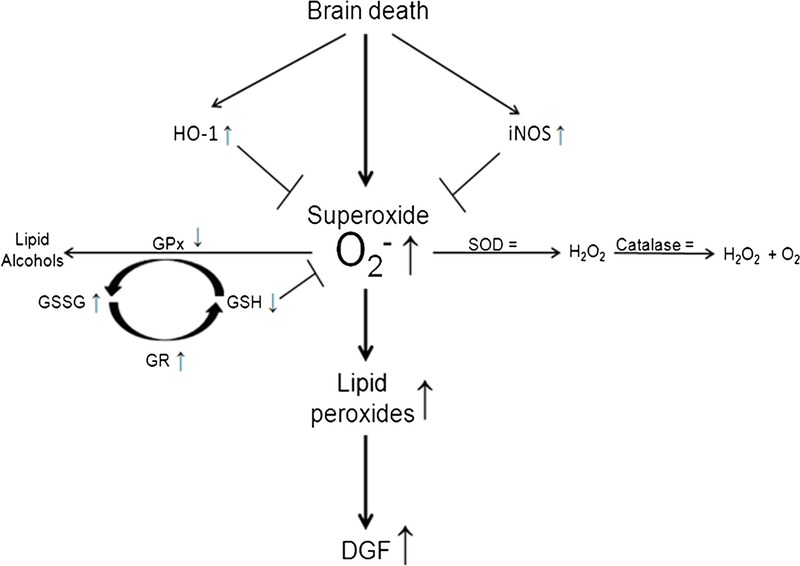
Proposed mechanism of lipid peroxidation in kidneys of brain-dead rats and subsequent risk of DGF in renal transplant recipients. Increased superoxide levels are not sufficiently counteracted by SOD which leads to the initiation of lipid peroxidation. Subsequent propagation of lipid peroxidation proceeds as GPx is impaired which results in less conversion of lipid peroxides to lipid alcohols. Excess superoxide is scavenged by GSH molecules resulting in increased GSSG levels and increased activity of GR. However, glutathione and other rescue mechanisms like HO-1 and iNOS cannot fully compensate the surge in superoxide levels which leads to increased lipid peroxidation and thereby increased risk of DGF in renal transplant recipients.
The early effects we observed at 0.5 hours are likely the result of major hemodynamic changes, such as the catecholamine storm, which is specific for the onset of BD.31 The effects observed at later stages are likely8 not related to major hemodynamic disturbances because rats are kept hemodynamically stable. Therefore, changes in the local renal circulation probably affect oxidative processes and renal function at later time points. In acute kidney injury models, local renal circulatory changes become apparent hours after renal ischemia.39,40 In BD, early hemodynamic changes could represent the first ischemic hit after which local renal circulatory changes take place at later time points. Because the onset of BD cannot be anticipated precisely, counteracting early hemodynamic changes could be difficult. However, the later oxidative processes, which probably do not involve hemodynamic derailments, could however effectively be counteracted with antioxidative regimens as explained above.
In our BD model, the GSSG/GSH ratio was unaltered at all time points which indicates that glutathione homeostasis is not affected overall. Augmenting glutathione levels in brain-dead donors is therefore most likely futile. In a recent randomized controlled trial, n-acetylcysteine, a glutathione precursor, was administered to deceased donors but no effect was found on renal graft function or survival in recipients.41 Like in ischemia-reperfusion models, glutathione levels decreased in our model but were unaltered at 4 hours despite the prooxidative state at this time point. This finding is probably not solely explained by increased GR activity because GSSG levels are significantly increased at this time point. Renal glutathione synthesis is totally dependent on renal uptake of glutathione conjugates from the circulation.42,43 We observed increased total glutathione plasma levels after slow induction of BD which could be the result of BD-related hepatic apoptosis which is significantly higher after slow compared with fast BD induction.21
Besides detrimental effects, BD also led to the compensatory upregulation of cytoprotective genes.31 We observed marked increases in renal iNOS and HO-1 expressions. Inducible nitric oxide synthase can exert a protective effect through suppression of inflammatory reactions and increasing blood flow to ischemic regions.44,45 However, higher levels of iNOS expression after slow induction did not coincide with decreased lipid peroxidation levels. Furthermore, increased NO production in an oxidative environment probably exerts a negative effect because NO will quickly react with oxidants, such as superoxide, resulting in the production of peroxynitrite, a highly reactive oxidant.46 Therefore, increasing NO production in brain-dead donors will probably not exert beneficial effects. Heme-oxygenase 1 is among the most critical cytoprotective enzymes that are activated upon cellular stress.47 The increased renal expression of HO-1 in BD is therefore believed to form part of a recuperative mechanism.48 However, in our model, increased HO-1 gene expression did not coincide with decreased lipid peroxidation after slow induction of BD. Probably, the induction of HO-1 by BD is either insufficient or occurs too late to prevent lipid peroxidation. The induction of HO-1 before BD has however proven beneficial in allograft survival in a rat transplantation model.49,50 Therefore, inducing HO-1 in brain-dead donors could pose clinical difficulties because HO-1 might already need to be induced before BD to exert beneficial effects.
In conclusion, this study shows oxidative and antioxidative effects elicited by fast and slow BD inductions. The observed effects could form an explanation for the increased lipid peroxidation observed in brain-dead donors. Because BD-related lipid peroxidation correlates with DGF in renal transplant recipients, antioxidative therapy in brain-dead donors could decrease lipid peroxidation and thereby improve transplantation outcomes.
ACKNOWLEDGMENTS
The authors would like to express their gratitude toward Petra J. Ottens, Suzanne J. Veldhuis, and Jacco J. Zwaagstra for their excellent technical assistance.
Footnotes
The authors declare no funding or conflicts of interest.
D.H., R.A.R., C.M.V.H., and H.G.D.L. designed the experiment. D.H., R.A.R., and Y.S.B. performed the experiment. D.H. and J.J.W,-B. analyzed data. D.H. wrote the article. H.v.G. and H.G.D.L. finalized the article.
Correspondence: Henri G.D. Leuvenink, University Medical Center Groningen, University of Groningen, Department of Surgery, CMC V, Y2144, Hanzeplein 1, 9713 GZ Groningen, the Netherlands. (h.g.d.leuvenink@umcg.nl).
The authors investigate the impact of brain death on graft function in a rat renal transplantation model and find that slow brain death induction may increase the incidence of delayed graft function after kidney transplantation.
REFERENCES
- 1.OPTN/SRTR 2011 Annual Data Report. http://srtr.transplant.hrsa.gov/annual_reports/2011/flash/01_kidney/index.html#/1/zoomed. Published 2011. Accessed 2016. [Google Scholar]
- 2.Siedlecki A, Irish W, Brennan DC. Delayed graft function in the kidney transplant Am J Transplant 2011. 112279–2296 [DOI] [PMC free article] [PubMed] [Google Scholar]
- 3.Peeters P, Vanholder R. Therapeutic interventions favorably influencing delayed and slow graft function in kidney transplantation: mission impossible? Transplantation 2008. 85S31–S37 [DOI] [PubMed] [Google Scholar]
- 4.Moers C, Kornmann NS, Leuvenink HG. The influence of deceased donor age and old-for-old allocation on kidney transplant outcome Transplantation 2009. 88542–552 [DOI] [PubMed] [Google Scholar]
- 5.Perico N, Cattaneo D, Sayegh MH. Delayed graft function in kidney transplantation Lancet 2004. 3641814–1827 [DOI] [PubMed] [Google Scholar]
- 6.Terasaki PI, Cecka JM, Gjertson DW, et al. High survival rates of kidney transplants from spousal and living unrelated donors. N Engl J Med. 1995;333:–. [DOI] [PubMed] [Google Scholar]
- 7.Morariu AM, Schuurs TA, Leuvenink HG. Early events in kidney donation: progression of endothelial activation, oxidative stress and tubular injury after brain death Am J Transplant 2008. 8933–941 [DOI] [PubMed] [Google Scholar]
- 8.Schuurs TA, Morariu AM, Ottens PJ. Time-dependent changes in donor brain death related processes Am J Transplant 2006. 62903–2911 [DOI] [PubMed] [Google Scholar]
- 9.Novitzky D, Cooper DK, Morrell D. Change from aerobic to anaerobic metabolism after brain death, and reversal following triiodothyronine therapy Transplantation 1988. 4532–36 [DOI] [PubMed] [Google Scholar]
- 10.Kosieradzki M, Kuczynska J, Piwowarska J. Prognostic significance of free radicals: mediated injury occurring in the kidney donor Transplantation 2003. 751221–1227 [DOI] [PubMed] [Google Scholar]
- 11.Jain SK, Shohet SB. Calcium potentiates the peroxidation of erythrocyte membrane lipids Biochim Biophys Acta 1981. 64246–54 [DOI] [PubMed] [Google Scholar]
- 12.Vladimirov YA, Olenev VI, Suslova TB. Lipid peroxidation in mitochondrial membrane Adv Lipid Res 1980. 17173–249 [DOI] [PubMed] [Google Scholar]
- 13.Tribble DL, Aw TY, Jones DP. The pathophysiological significance of lipid peroxidation in oxidative cell injury Hepatology 1987. 7377–386 [DOI] [PubMed] [Google Scholar]
- 14.Nagelschmidt M, Minor T, Gallinat A. Lipid peroxidation products in machine perfusion of older donor kidneys J Surg Res 2013. 180337–342 [DOI] [PubMed] [Google Scholar]
- 15.Futrakul N, Tosukhowong P, Valyapongpichit Y. Oxidative stress and hemodynamic maladjustment in chronic renal disease: a therapeutic implication Ren Fail 2002. 24433–445 [DOI] [PubMed] [Google Scholar]
- 16.Nakayama M, Nakayama K, Zhu WJ. Polymorphonuclear leukocyte injury by methylglyoxal and hydrogen peroxide: a possible pathological role for enhanced oxidative stress in chronic kidney disease Nephrol Dial Transplant 2008. 233096–3102 [DOI] [PubMed] [Google Scholar]
- 17.Himmelfarb J, McMonagle E, Freedman S. Oxidative stress is increased in critically ill patients with acute renal failure J Am Soc Nephrol 2004. 152449–2456 [DOI] [PubMed] [Google Scholar]
- 18.Valko M, Leibfritz D, Moncol J. Free radicals and antioxidants in normal physiological functions and human disease. Int J Biochem Cell Biol. 2007;39:44. doi: 10.1016/j.biocel.2006.07.001. [DOI] [PubMed] [Google Scholar]
- 19.Pigeolet E, Corbisier P, Houbion A. Glutathione peroxidase, superoxide dismutase, and catalase inactivation by peroxides and oxygen derived free radicals Mech Ageing Dev 1990. 51283–297 [DOI] [PubMed] [Google Scholar]
- 20.Shivalkar B, Van Loon J, Wieland W. Variable effects of explosive or gradual increase of intracranial pressure on myocardial structure and function Circulation 1993. 87230–239 [DOI] [PubMed] [Google Scholar]
- 21.Rebolledo RA, Hoeksma D, Hottenrott CM. Slow induction of brain death leads to decreased renal function and increased hepatic apoptosis in rats. J Transl Med. 2016;14:141. doi: 10.1186/s12967-016-0890-0. [DOI] [PMC free article] [PubMed] [Google Scholar]
- 22.Hacke W, Schwab S, Horn M. ’Malignant’ middle cerebral artery territory infarction: clinical course and prognostic signs Arch Neurol 1996. 53309–315 [DOI] [PubMed] [Google Scholar]
- 23.Lantigua H, Ortega-Gutierrez S, Schmidt JM. Subarachnoid hemorrhage: who dies, and why? Crit Care. 2015;19:309. doi: 10.1186/s13054-015-1036-0. [DOI] [PMC free article] [PubMed] [Google Scholar]
- 24.Lenth RV. Statistical power calculations. J Anim Sci. 2007;85:E24. doi: 10.2527/jas.2006-449. [DOI] [PubMed] [Google Scholar]
- 25.Fontana J, Yard B, Stamellou E. Dopamine treatment of brain-dead Fisher rats improves renal histology but not early renal function in Lewis recipients after prolonged static cold storage Transplant Proc 2014. 463319–3325 [DOI] [PubMed] [Google Scholar]
- 26.Griffith OW. Determination of glutathione and glutathione disulfide using glutathione reductase and 2-vinylpyridine Anal Biochem 1980. 106207–212 [DOI] [PubMed] [Google Scholar]
- 27.Pessione F, Cohen S, Durand D. Multivariate analysis of donor risk factors for graft survival in kidney transplantation Transplantation 2003. 75361–367 [DOI] [PubMed] [Google Scholar]
- 28.Cohen O, De La Zerda DJ, Beygui R. Donor brain death mechanisms and outcomes after heart transplantation Transplant Proc 2007. 392964–2969 [DOI] [PubMed] [Google Scholar]
- 29.Kataoka K, Taneda M. Reversible arterial hypotension after acute aneurysmal subarachnoid hemorrhage Surg Neurol 1985. 23157–161 [DOI] [PubMed] [Google Scholar]
- 30.Herijgers P, Leunens V, Tjandra-Maga TB. Changes in organ perfusion after brain death in the rat and its relation to circulating catecholamines Transplantation 1996. 62330–335 [DOI] [PubMed] [Google Scholar]
- 31.Bos EM, Leuvenink HG, van Goor H. Kidney grafts from brain dead donors: inferior quality or opportunity for improvement? Kidney Int 2007. 72797–805 [DOI] [PubMed] [Google Scholar]
- 32.Montagna G, Hofer CG, Torres AM. Impairment of cellular redox status and membrane protein activities in kidneys from rats with ischemic acute renal failure Biochim Biophys Acta 1998. 140799–108 [DOI] [PubMed] [Google Scholar]
- 33.Rahman NA, Mori K, Mizukami M. Role of peroxynitrite and recombinant human manganese superoxide dismutase in reducing ischemia-reperfusion renal tissue injury Transplant Proc 2009. 413603–3610 [DOI] [PubMed] [Google Scholar]
- 34.Knight SF, Kundu K, Joseph G. Folate receptor-targeted antioxidant therapy ameliorates renal ischemia-reperfusion injury J Am Soc Nephrol 2012. 23793–800 [DOI] [PMC free article] [PubMed] [Google Scholar]
- 35.Winterbourn CC, Metodiewa D. The reaction of superoxide with reduced glutathione Arch Biochem Biophys 1994. 314284–290 [DOI] [PubMed] [Google Scholar]
- 36.Blum J, Fridovich I. Inactivation of glutathione peroxidase by superoxide radical Arch Biochem Biophys 1985. 240500–508 [DOI] [PubMed] [Google Scholar]
- 37.Paller MS, Hoidal JR, Ferris TF. Oxygen free radicals in ischemic acute renal failure in the rat J Clin Invest 1984. 741156–1164 [DOI] [PMC free article] [PubMed] [Google Scholar]
- 38.Thomas JP, Maiorino M, Ursini F. Protective action of phospholipid hydroperoxide glutathione peroxidase against membrane-damaging lipid peroxidation. In situ reduction of phospholipid and cholesterol hydroperoxides J Biol Chem 1990. 265454–461 [PubMed] [Google Scholar]
- 39.Wang Z, Holthoff JH, Seely KA. Development of oxidative stress in the peritubular capillary microenvironment mediates sepsis-induced renal microcirculatory failure and acute kidney injury Am J Pathol 2012. 180505–516 [DOI] [PMC free article] [PubMed] [Google Scholar]
- 40.Seija M, Baccino C, Nin N. Role of peroxynitrite in sepsis-induced acute kidney injury in an experimental model of sepsis in rats Shock 2012. 38403–410 [DOI] [PubMed] [Google Scholar]
- 41.Orban JC, Quintard H, Cassuto E. Effect of N-acetylcysteine pretreatment of deceased organ donors on renal allograft function: a randomized controlled trial Transplantation 2015. 99746–753 [DOI] [PMC free article] [PubMed] [Google Scholar]
- 42.Ormstad K, Jones DP, Orrenius S. Characteristics of glutathione biosynthesis by freshly isolated rat kidney cells J Biol Chem 1980. 255175–181 [PubMed] [Google Scholar]
- 43.Rankin BB, Wells W, Curthoys NP. Rat renal peritubular transport and metabolism of plasma [35S]glutathione Am J Physiol 1985. 249F198–F204 [DOI] [PubMed] [Google Scholar]
- 44.Fukumoto Y, Shimokawa H, Kozai T. Vasculoprotective role of inducible nitric oxide synthase at inflammatory coronary lesions induced by chronic treatment with interleukin-1beta in pigs in vivo Circulation 1997. 963104–3111 [DOI] [PubMed] [Google Scholar]
- 45.Hickey MJ, Granger DN, Kubes P. Inducible nitric oxide synthase (iNOS) and regulation of leucocyte/endothelial cell interactions: studies in iNOS-deficient mice Acta Physiol Scand 2001. 173119–126 [DOI] [PubMed] [Google Scholar]
- 46.Beckman JS, Koppenol WH. Nitric oxide, superoxide, and peroxynitrite: the good, the bad, and ugly Am J Physiol 1996. 271C1424–C1437 [DOI] [PubMed] [Google Scholar]
- 47.Gozzelino R, Jeney V, Soares MP. Mechanisms of cell protection by heme oxygenase-1 Annu Rev Pharmacol Toxicol 2010. 50323–354 [DOI] [PubMed] [Google Scholar]
- 48.van Dullemen LF, Bos EM, Schuurs TA. Brain death induces renal expression of heme oxygenase-1 and heat shock protein 70. J Transl Med. 2013;11:22. doi: 10.1186/1479-5876-11-22. [DOI] [PMC free article] [PubMed] [Google Scholar]
- 49.Tullius SG, Nieminen-Kelha M, Buelow R. Inhibition of ischemia/reperfusion injury and chronic graft deterioration by a single-donor treatment with cobalt-protoporphyrin for the induction of heme oxygenase-1 Transplantation 2002. 74591–598 [DOI] [PubMed] [Google Scholar]
- 50.Wagner M, Cadetg P, Ruf R. Heme oxygenase-1 attenuates ischemia/reperfusion-induced apoptosis and improves survival in rat renal allografts Kidney Int 2003. 631564–1573 [DOI] [PubMed] [Google Scholar]