Abstract
Background
A measure of donor liver quality, the donor liver index, was developed and validated for the UK population of transplant recipients. Unlike previously proposed measures, this index is only based on variables that are available at the point of retrieval, and so does not include cold ischemic time.
Methods
Indices of liver quality were based on data from the UK Transplant Registry on all 7929 liver transplants between January 2000 and December 2014.
Results
The donor liver index (DLI) was based on factors shown to affect graft survival, which included donor age, sex, height, type (donor after brain death or circulatory death), bilirubin, smoking history, and whether the liver was split. A separate index (DLI1) looking at 1-year survival showed donor cardiac disease, black ethnicity, and steatosis to be additional risk factors. A strong association was found between DLI and whether or not a surgeon accepts an offered liver for transplant, with a marked fall in acceptance rates for livers with an index greater than 1.31. Since 2000, there has been a notable reduction in the quality of livers transplanted, coupled with variation between the 7 UK liver transplant centers in risk appetite.
Conclusions
The DLI is an index of liver quality which enables analysis of the changing trends in liver quality and center behavior. DLI1 enables identification of factors affecting shorter-term survival, and perhaps identifies a cohort of livers that may benefit from novel preservation technologies.
In 2006, Feng and colleagues1 described factors that were associated with the risk of failure of deceased donor liver grafts in the United States, and developed a donor risk index (DRI) to estimate the likelihood of graft failure based on parameters recorded at the time of transplantation. Subsequently, indices characterizing the chance of graft failure have been developed for other donor organs in the United States,2–4 as well as on donor populations from different countries.5,6
Indices estimating the risk of graft failure can be used in many ways. One such index, the kidney donor profile index (KDPI), has been integrated into the new American kidney allocation scheme,7 matching kidneys which have been estimated to have longer survival with younger patients. Donor organ indices can also be used in monitoring changes in donor organ quality over time, in assessing the attitudes of different transplant centers toward poorer quality organs, and for risk-adjusting outcome data. They also have a potential role in clinical trials of different preservation techniques, although the presence of cold ischemic time (CIT) as a factor in an index limits its utility in this respect.
One of the drivers to produce the liver DRI cited by Feng et al was the worsening donor demographic, and the need for a tool to properly inform a decision to use or not use a donor liver. Although being able to predict a poor graft survival is useful, and may inform recipient selection, a number of potentially useable livers remain unused; in 2014 in the United States, 9.6% of donor livers recovered from deceased donors were not transplanted.8 Novel liver preservation technologies involving hypothermic or normothermic perfusion may enable some of the hitherto unused livers to be transplanted, and an accurate index predicting graft survival may be a useful tool to identify those donor livers that would benefit most from a period of ex vivo assessment and “resuscitation.”9,10
The liver DRI developed by Feng et al1 is applicable to the US donor population, but is not readily transferable to populations in other countries. Moreover, the inclusion of a factor relating to cold ischemia makes it less useful as an indicator of liver quality at the time of retrieval. It was with these limitations in mind that we developed a UK index of liver “quality,” called the UK donor liver index, which related to the point of retrieval without reference to ischemic times. In this article, we describe the development, validation, and uses of an index based on data held by the UK Transplant Registry.
MATERIALS AND METHODS
Data from all first liver transplants from deceased donors between January 1, 2000, and December 31, 2014 were identified from the UK Transplant Registry. Recipients younger than 16 years and recipients of heterotopic, auxillary and blood group incompatible transplants were excluded. Donor, recipient, and transplant data were used to identify factors associated with 1-, 2-, 5-, and 10-year graft survival. Variables recorded by the registry that were considered to possibly influence the outcome of a liver transplant are detailed below.
Donor Variables Included in Model
Donor variables: age, sex, ethnicity, cause of death, donor type (donor after circulatory death [DCD], donor after brain death [DBD]), split or partial liver, height, weight, body mass index, body surface area (Du Bois formula11), blood group. In addition positive or negative past history of the following items, recorded at the time of donor evaluation, were also included: cardiac disease, diabetes mellitus, cytomegalovirus (CMV), hypertension, malignancy, drug abuse, alcohol abuse, smoking, cardiac or respiratory arrest, and inotrope use. The following biochemical variables, recorded at the time of referral, were included: γ-glutamyl transferase, alanine aminotransferase, aspartate aminotransferase, sodium, bilirubin, alkaline phosphatase, creatinine, international normalized ratio (INR), potassium, blood urea nitrogen and albumin. Lastly, the presence of capsular damage, steatosis, and the surgeon’s subjective opinion of the liver (healthy or suboptimal) were also included.
Recipient and Transplant Factors Used for Adjustment
Donor factors were adjusted for the following transplant and recipient factors: CIT, retrieval team (whether or not the retrieval team and transplant team are from the same center); ABO compatibility (0 = no, 1 = compatible, 2 = identical), and recipient age, gender, ethnicity (1 = white, 2 = Asian, 3 = black, 4 = other), height, weight, blood group (O, A, B, AB, but not included in model as donor blood group and ABO compatibility were both present), body mass index, surface area, urgency status at transplant (elective or super-urgent), diagnosis (10 groups), CMV status and donor recipient CMV match, previous abdominal surgery, bilirubin, albumin, creatinine, sodium, INR, ventilation prior to transplantation, renal support (whether on dialysis or not), inpatient or not, lifestyle activity score, encephalopathy grade, presence of ascites, whether on diuretic therapy, presence of oesophageal varices, presence of a shunt for varices (none, surgical shunt, transjugular portosystemic shunt), presence of sepsis prior to surgery, intraoperative blood requirement, whether a Roux-en-Y biliary anastomosis, the transplant center, and the era (2000-2003, 2004-2007, 2008-2011, 2012 onward).
Factors Excluded From Model
Where variables were not recorded in at least 50% of potential donors, they were omitted from the modeling process, because an index including them would be of little practical value. These potential variables were donor aspartate transaminase, INR, sodium, potassium, urea, creatinine and also whether the recipient had a shunt for varices.
Modeling and Imputation
The data set was randomly split into a modeling set comprising 70% and a validation data set comprising 30%. Plots of martingale residuals for a null Cox regression model were used to determine whether any of the continuous variables exhibit non-linearity.12 There was no evidence of this, and so all variables were taken to be linear in the modeling process.
There were many missing observations in the modeling data set, and so multiple imputation based on chained equations was used to impute for missing values in 20 copies of the modeling data set.13 Missing data were estimated from logistic regression for binary variables, cumulative logistic regression for ordinal variables, a discriminant function approach for categorical variables, and linear models for continuous variables. Some variables (Donor albumin, bilirubin, alanine aminotransferase, γ-glutamyl transferase, alkaline phosphatase; Recipient INR, bilirubin, creatinine) were log transformed to account for skewness and ensure that imputed values were nonnegative. Donor and recipient CMV status were imputed separately and CMV match status calculated from these. All variables featured in each of the models for the imputed variables. Additionally, the unadjusted cumulative hazard function at the graft survival time of the recipient and the event status variable were incorporated.14 The distributions of values of the variables in the 20 imputed data sets were compared with those in the original data set and found to be very similar. Imputation was not necessary for the validation data set.
To identify relevant donor factors to use in an index predicting graft survival, all recipient and transplant factors were included in a Cox regression model for the recipient graft survival times. A stepwise variable selection process was used with each imputed data set to identify donor factors, using a 20% significance level for inclusion and a 10% significance level to subsequently remain in the model. Variables that were selected for inclusion in at least 10 of the 20 different imputed data sets were considered for adoption in the final index. In a supporting analysis, all 20 imputed data sets were stacked and stepwise selection of the donor factors after fitting all recipient and transplant factor was carried out using weights of 0.05.15 The selected variables were very similar to those chosen from the previous approach. Models were further refined using the log likelihood ratio statistic and Akaike’s Information Criterion to determine whether the more marginal terms could be eliminated. The chosen model was then fitted to each imputed data set and the results combined to account for variation between the 20 imputed data sets.
Consistency of Factors Predicting Graft Survival Over Time
Some donor factors are more likely to affect short term survival, while others continue to have an impact on long term survival. To determine donor factors that were indicative of short-term, medium-term, or longer-term survival, graft survival times in the modeling data set were censored at 1, 2, 5, and 10 years to give indices based on survival to these times.
Association Between Donor Liver Index and Acceptance of Livers for Transplantation
The association between the values of the index with offer acceptance and transplantation was explored for a cohort of 2274 potential solid organ donors where a liver had been offered for transplant between January 1, 2015, and March 31, 2016. Information on whether the liver was split was only available for livers that were accepted for transplant. Because livers from donors aged 40 years or older are not offered for splitting in the UK, this analysis was restricted to potential donors in this age group. Rates were compared using χ2 tests. The relation between the probability of an offered liver being accepted and values of the donor liver index were examined using logistic regression models. Linear regression modeling was used to determine the significance of trend in the index over time and to compare the slopes between centers.
Model Validation
The index obtained from the modeling process was validated on 30% of the data by assigning transplant recipients to 4 groups defined by the quartiles of the index distribution in the modeling data set. The Kaplan-Meier estimate of the survivor function is obtained for each group, and compared using the log rank test. Cox regression modeling was used to determine the significance of differences in adjusted hazard ratios between the groups. The association between the index and other measures was assessed using Pearson correlation coefficient.
All data management and analysis was carried out using SAS 9.3 (SAS Institute, Cary, NC).
RESULTS
The final dataset from 7929 liver transplant recipients was randomly divided into a modeling set comprising 5586 observations and a validation set comprising the remaining 2343.
Donor Quality Index
The relevant donor variables identified were donor age, sex, type, height, bilirubin, smoking history, and whether the liver was split. A Cox regression model containing these variables and all the recipient and transplant factors was then fitted to each of the 20 imputed data sets, and the estimated coefficients of the variables in the index were combined to give a donor liver index (DLI). The resulting estimates adjusted for all the recipient and transplant factors under consideration, together with hazard ratios and their confidence limits, are shown in Table 1.
TABLE 1.
Donor factors associated with graft survival, showing the hazard ratio, 95% confidence limits and the corresponding P value
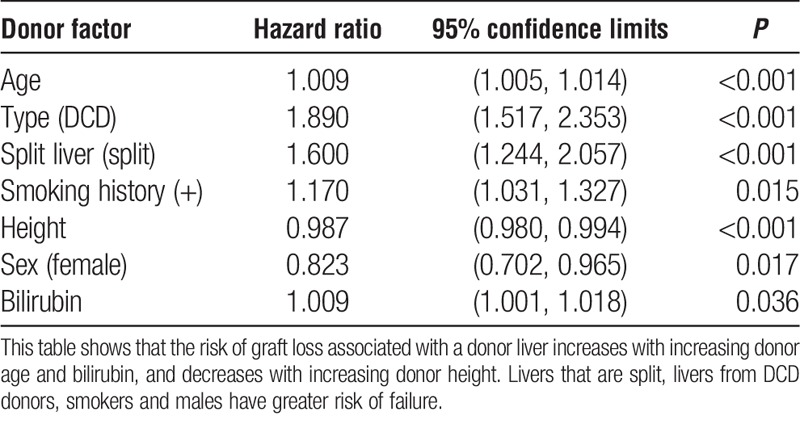
The index was obtained from the coefficients of the variables in the model, adjusted so that a DLI of 1.0 is obtained for a whole liver from a male DBD donor aged 45 years; height, 170 cm (67 in.); bilirubin, 10 μmol/L; and who is a nonsmoker. The resulting index is:
DLI = exp{ 1.6775 + 0.009179 age − (0.1948 if female) + (0.6363 if DCD) + (0.4697 if split liver) − 0.01283 height (cm) + (0.1570 if smoker) + 0.009019 bilirubin }.
The quartiles of the distribution of DLI values in the modeling data set are 0.94, 1.10, 1.31, and the distribution of DLI values in this data set is shown in Figure S1, SDC, http://links.lww.com/TP/B375.
Consistency of Factors Over Time
Using a similar variable selection routine, but with graft survival censored at 1 year, the variables associated with 1-year graft survival (DLI1) were donor type, whether liver is split, height, history of cardiac disease, bilirubin, presence of steatosis, smoking history, and ethnicity. The ethnicity effect was due to a greater hazard of graft failure for black donors relative to the other groups, and so ethnicity was redefined as a binary factor. The possibility that this was a proxy for blood group differences was excluded.
The corresponding donor liver index for 1-year graft survival (DLI1) was
DLI1 = exp{ 2.3159 + (0.9106 if DCD) + (0.7140 if split liver) − 0.01434 *(height (cm)) + (0.3058 if history of cardiac disease) + (0.2545 if steatosis present) + 0.01222 × (bilirubin (μmol/L)) + (0.1736 if positive smoking history) + (0.6453 if ethnicity is black) }.
The corresponding quartiles of the distribution of DLI1 values are 1.12, 1.36, and 1.82. Livers at higher risk of failure within the first year would be those with a DLI1 value greater than 1.82.
A similar process was undertaken for 2-year graft survival, where the donor factors were type, split liver, age, height, sex, bilirubin, cardiac disease, smoking, and ethnicity. At 5 years, the factors were type, split liver, age, height, cardiac disease, bilirubin, smoking and ethnicity, and at 10 years donor type, split liver, age, sex, height, bilirubin, smoking, ethnicity.
Most factors were common to all models, but steatosis was also associated with 1-year graft failure, and a positive history of cardiac disease was associated with graft survival up to 5 years.
Validation of the DLI
The index could be obtained for 1750 (75%) of the independent set of 2343 recipients; missing values for donor bilirubin accounted for most of this shortfall. Figure 1 shows the Kaplan-Meier survivor estimate by DLI quartile. The index is best able to discriminate livers with an index greater than the upper quartile of DLI values from the rest. On fitting a Cox model containing DLI group, the c-statistic is 0.55. The corresponding adjusted hazard ratio for livers in the low quality group (DLI > 1.31), relative to those of high quality (DLI < 0.94) is 2.86 (P < 0.001), suggesting that recipients of high risk livers have nearly a threefold increase in the risk of graft failure at any time, compared to those who receive a low risk liver.
FIGURE 1.
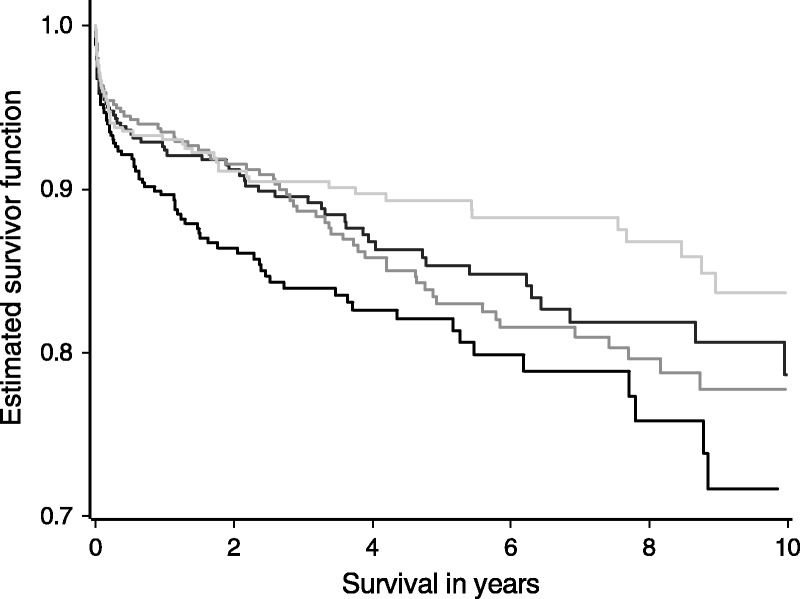
Graft survival posttransplant in the validation set of 1750 liver transplants according to DLI quartile (DLI < 0.94, 0.94 ≤ DLI < 1.10, 1.10 ≤ DLI < 1.31, DLI ≥ 1.31). The DLI is able to discriminate between different levels of risk where the DLI is greater than the upper quartile of 1.31. Survival is lowest in this group but there are no significant differences between the survival estimates for the 3 groups with DLI values less than 1.31.
A similar validation process was performed for 1-year graft survival predicted by DLI1 (Figure 2). This index was also able to discriminate high risk livers (DLI1 > 1.82) from lesser risk livers, particularly at early survival times.
FIGURE 2.
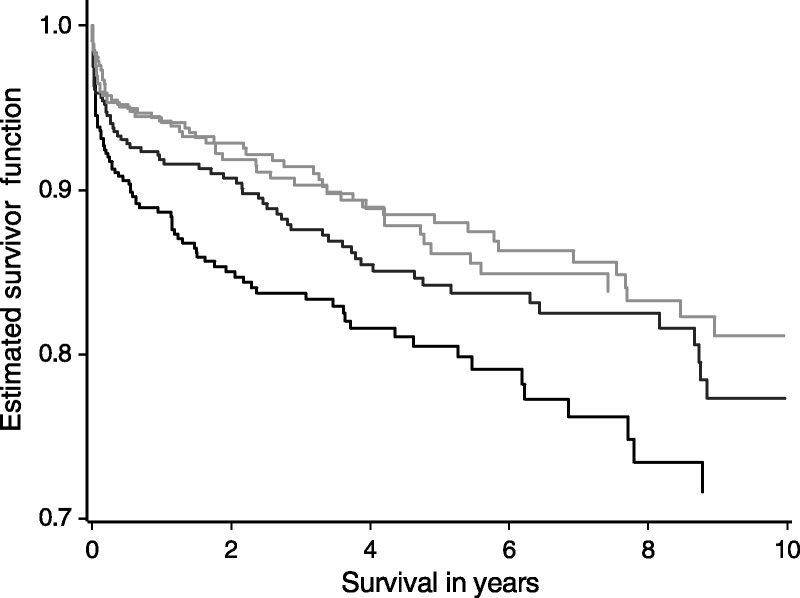
Graft survival posttransplant in the validation set according to DLI1 quartile (DLI < 1.12, 1.12 ≤ DLI < 1.36, 1.36 ≤ DLI < 1.82, DLI ≥ 1.82). The DLI1 is able to discriminate high risk quartile livers (DLI1 > 1.82) with the lowest survival rates from the other 3 quartiles, particularly at early survival times.
Association Between DRI and Acceptance of Livers for Transplantation
Of the potential liver donors in the 15 month period from January 2015, a DLI value could be calculated for 986 aged 40 or more. Of livers offered in this cohort, 93% of low or moderate risk livers (DLI ≤ 1.31) were accepted for transplant, whereas 49% of high risk livers (DLI > 1.31) were accepted. Of those accepted, 89% of the low-risk or moderate-risk livers were transplanted, compared to 70% of the high risk livers. The corresponding utilization rates were 83% for low risk livers and 34% for high-risk livers.
Figure 3 shows the DLI for livers that were offered and for those that were accepted. Livers accepted for transplantation have a significantly lower mean DLI (P < 0.001) and there was a clear tendency for livers of higher quality to be transplanted (P < 0.001). A similar pattern is found using DLI1.
FIGURE 3.
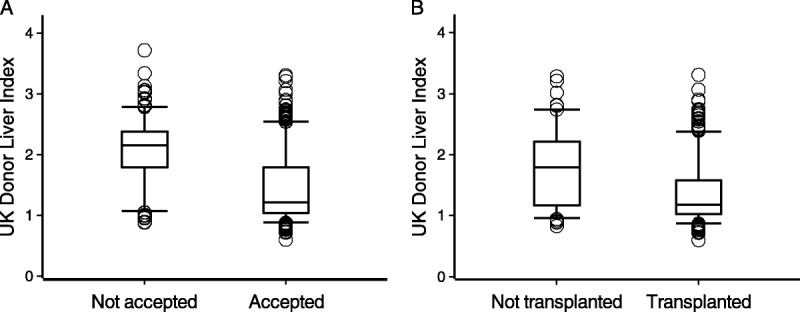
Box plots showing the distribution of the DLI indices for all donors (A) where the liver was offered and either accepted or not accepted for transplant and (B) whether the accepted livers were subsequently transplanted.
The average model for end-stage liver disease (MELD) scores for recipients of high-quality and low-quality livers were 17.4 and 16.1, respectively (P = 0.06). There was a significant association between primary disease and liver quality (P < 0.001); patients with acute liver disease are more likely to receive a high quality liver. The proportions of recipients with a hepatocellular carcinoma (HCC) were very similar in the 2 groups.
Probability of an Offered Liver Being Accepted
In both DLI and DLI1, the higher the quality, the greater is the probability of a liver being accepted. The fit of the logistic model was substantially improved by using a natural cubic spline with 4 knots for the DLI values. The fitted relationship between probability of acceptance and DLI value, together with 95% confidence bands, is shown in Figure 4, for which the c-statistic is 0.81. This shows how the probability of acceptance declines rapidly for livers with a DLI that exceeds 1.31.
FIGURE 4.
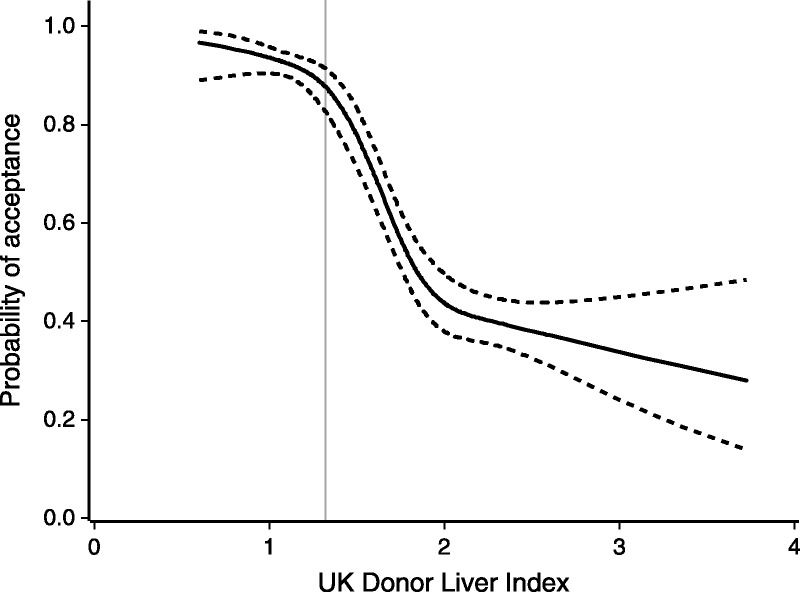
The probability of an offered liver being accepted for transplant by DLI, with 95% confidence bands shown as dashed lines.
Trends Over Time
Trends in the index are explored for transplants carried out since January 1, 2000, where the DLI can be calculated. Although our index excludes CIT, it is highly significantly associated with CIT (P < 0.001), in that higher-quality livers are more likely to be used in transplants where the CIT is longer.
Figure 5 shows a plot of yearly mean DLI values for each UK transplant center. There was a clear trend in DLI values over this period (P<0.001), with average DLI increasing from 1.04 in 2000 to 1.30 in 2015. The DLI values also varied significantly between centers (P < 0.001), with 2 centers generally using livers of lower average quality throughout this period. Other centers increased their use of lower quality livers around 2007, corresponding to an increase in DCD transplants. There was no evidence of centers exhibiting different patterns over time (P = 0.58).
FIGURE 5.
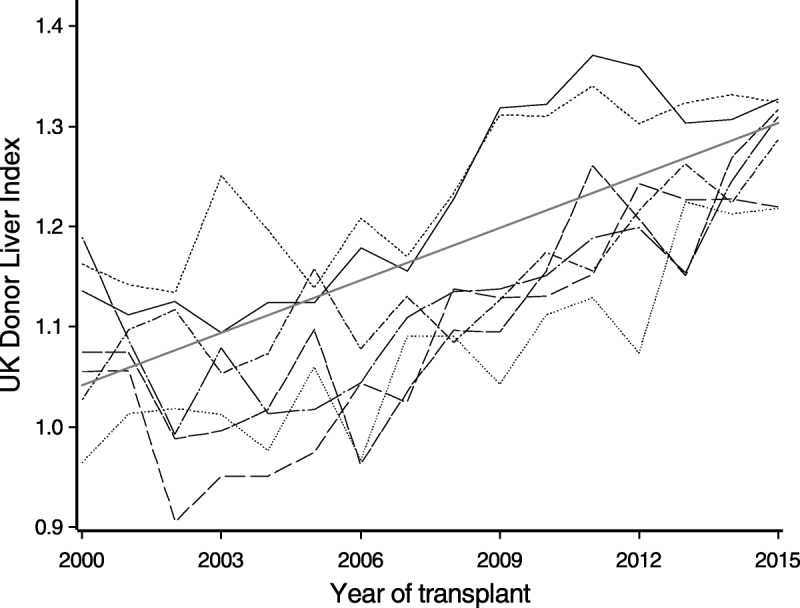
Yearly mean DLI values from 2000 for each UK liver transplant center. Different line styles are used for each of the 7 centers. The fitted linear regression model is also shown.
Comparison With Other Liver Donor Risk Indices
A comparison of the performance of the Feng index1 with the DLI can only be based on donor livers where the CIT is known, which means that the livers would have been transplanted. With this proviso, and by assuming livers were regionally allocated, a Feng DRI was calculated and compared with the DLI on the cohort of potential liver donors since January 1, 2015 (Figure 6). The Feng index generally has higher values than DLI and the correspondence between the 2 indices is less at larger values of the DLI. However, the 2 indices are generally consistent in their ranking of donor risk, with a correlation coefficient of 0.77 (P < 0.001). Comparison was also made with the Eurotransplant DRI.5 The relationship was similar to the relationship with the Feng DRI with a correlation 0.75 (P < 0.001).
FIGURE 6.
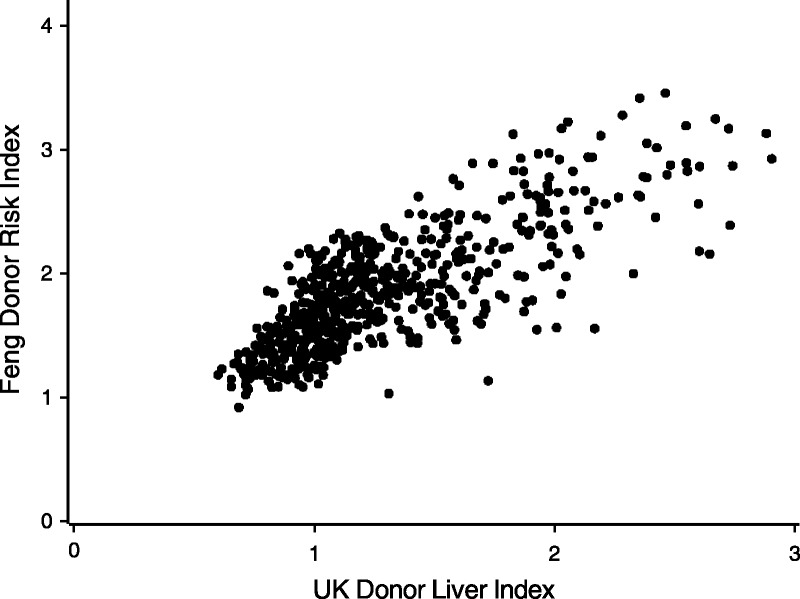
Scatter plot showing the correlation between the Donor Risk Index of Feng et al1 and the DLI.
DISCUSSION
Analysis of the UK Transplant Registry has identified donor age, height and sex, bilirubin, a history of smoking, donor type (DCD or DBD), and use of a split liver as factors at the point of referral which influence graft survival posttransplant in the UK. The derived index was able to discriminate livers with good survival from those with poor survival. Further analysis showed that some factors were more important in short-term graft survival as opposed to long-term graft survival. Steatosis and history of cardiac disease were more important in predicting short-term graft failure than donor age and sex, but those factors were more important in long-term graft survival.
Although the index shows good correlation with the indices derived by Feng et al1 on US data, and that of Braat et al5 on Eurotransplant data, it differs from them in important ways. In particular, it has been derived from the UK population, but as the index is comparable to other proposals, it has the potential to be used in other countries. The DLI is derived from data available at the time the organ is offered, and does not include CIT. This permits assessment of liver quality per se, without the confounding effects of cold ischemia, effects that may change with the advent of novel preservation technologies.
We found small differences in disease severity at transplant, based on the MELD score, for recipients of high and low quality livers. There was no difference in the proportions transplanted for HCC. This suggests that the survival advantage of recipients of high quality livers is not due to livers being allocated to those who are less sick at transplant, or to HCC patients who tend to survive longer. Consequently, the selective use of organs for transplant cannot be explained by selection bias with respect to the recipients.
An index such as the one described here is necessarily based on data normally collected and so is a realistic basis for clinical decision making. Although one of the important determinants of liver function posttransplant is the degree of steatosis, neither this nor the other commonly used indices include a direct measure of fat content. It is noteworthy that the effect of steatotic appearance on outcome is most prominent in the first year. The second limitation is that the index uses biochemical values at a single time point, that is, the time of referral as a donor. This may miss important changes, such as falling transaminases following a period of ischemia. A third limitation is the necessary use of categorical values to describe potentially complex situations. Hence, a preadmission donor cardiac arrest that lasted for 2 minutes with immediate resuscitation is classified similarly to one where there was a significant asystolic period before resuscitation was begun, with possible associated ischemic biliary and parenchymal damage. Similarly, donation after circulatory death covers a number of different scenarios from the donor who suffers a circulatory death immediately treatment is withdrawn to one who may have a prolonged period of hypotension and hypoxemia prior to arrest.16 The effect of DCD donation on outcome should also be considered in the context of UK practice: all DCD donors are controlled donors (Maastricht III or IV),17 and no prior treatment such as heparinization or cannulation is permitted; following circulatory arrest there is a mandatory period of 5 minutes before death can be verified, and organ recovery begun.
Donor risk indices have been criticized because they may not properly account for interactions between specific donors and recipient diseases. In liver transplantation it is recognized that hepatitis C–positive recipients have a disproportionately poorer outcome when they receive older or steatotic grafts, or in the presence of donor specific antibodies.18–20 The advent of new treatments for hepatitis C means that the disproportionate effects of this disease are unlikely to persist in the future, as patients are either cleared of hepatitis C while waiting, or soon after transplant.
One of the potential values of an index of liver quality is in recipient selection. Although all recipients benefit from a good quality liver, there remains the question of how best to use a poorer quality liver,21,22 particularly if the decision is to transplant it into a patient with a high MELD score in whom the decision may be between the risk of death on the waiting list and risk from a suboptimal liver. Survival benefit may favor use of a poorer quality liver, if that is the one available, rather than prolong waiting in anticipation of a better offer.23,24 One of the advantages of developing an index of donor liver quality is that it will enable modeling to support the best allocation of such a liver.
Lastly, it should be remembered that the donor liver index describes the risk of graft failure based on donor factors, and not the risk from the donor per se. It does not, for example, include any reference to the risk of donor transmitted infection or malignancy, either of which may affect patient or graft survival. For that reason, we have called our index an index of liver quality, although we acknowledge that other factors such as steatosis which may affect graft outcomes (and therefore “quality”) are not directly accounted for.
Footnotes
The research was funded by the National Institute for Health Research Blood and Transplant Research Unit (NIHR BTRU) in Organ Donation and Transplantation at the University of Cambridge in collaboration with Newcastle University and in partnership with NHS Blood and Transplant (NHSBT). The views expressed are those of the authors and not necessarily those of the NHS, the NIHR, the Department of Health or NHSBT.
The authors declare no conflicts of interest.
DC, PJF, and CJEW conceived of the study, contributed to the analysis and interpretation of the data, approved the final manuscript and agree to be accountable for all aspects of the work.
Correspondence: Christopher J.E. Watson, MD, Department of Surgery, Box 202, Addenbrooke’s Hospital, Cambridge CB2 0QQ, United Kingdom. (cjew2@cam.ac.uk).
Supplemental digital content (SDC) is available for this article. Direct URL citations appear in the printed text, and links to the digital files are provided in the HTML text of this article on the journal’s Web site (www.transplantjournal.com).
Using data from the UK Transplant Registry, the authors develop a UK index of liver “quality” called the UK Donor Liver Index, which relates to the point of retrieval without reference to ischemic times, and estimates the risk of graft failure based on donor factors. Supplemental digital content is available in the text.
REFERENCES
- 1.Feng S, Goodrich NP, Bragg-Gresham JL. Characteristics associated with liver graft failure: the concept of a donor risk index Am J Transplant 2006. 6783–790 [DOI] [PubMed] [Google Scholar]
- 2.Rao PS, Schaubel DE, Guidinger MK. A comprehensive risk quantification score for deceased donor kidneys: the kidney donor risk index Transplantation 2009. 88231–236 [DOI] [PubMed] [Google Scholar]
- 3.Weiss ES, Allen JG, Kilic A. Development of a quantitative donor risk index to predict short-term mortality in orthotopic heart transplantation J Heart Lung Transplant 2012. 31266–273 [DOI] [PubMed] [Google Scholar]
- 4.Axelrod DA, Sung RS, Meyer KH. Systematic evaluation of pancreas allograft quality, outcomes and geographic variation in utilization Am J Transplant 2010. 10837–845 [DOI] [PubMed] [Google Scholar]
- 5.Braat AE, Blok JJ, Putter H. The Eurotransplant Donor Risk Index in liver transplantation: ET-DRI Am J Transplant 2012. 122789–2796 [DOI] [PubMed] [Google Scholar]
- 6.Watson CJ, Johnson RJ, Birch R. A simplified donor risk index for predicting outcome after deceased donor kidney transplantation Transplantation 2012. 93314–318 [DOI] [PubMed] [Google Scholar]
- 7.The Organ Procurement and Transplantation Network. A Guide to Calculating and Interpreting the Kidney Donor Profile Index (KDPI). https://optn.transplant.hrsa.gov/ContentDocuments/Guide_to_Calculating_Interpreting_KDPI.pdf. Published 2014. Accessed March 5, 2016. [Google Scholar]
- 8.Kim WR, Lake JR, Smith JM. Liver Am J Transplant 2016. 1669–98 [DOI] [PubMed] [Google Scholar]
- 9.Ravikumar R, Jassem W, Mergental H. Liver transplantation after ex vivo normothermic machine preservation: a phase 1 (first-in-man) clinical trial Am J Transplant 2016. 161779–1787 [DOI] [PubMed] [Google Scholar]
- 10.Watson CJ, Kosmoliaptsis V, Randle LV. Preimplant normothermic liver perfusion of a suboptimal liver donated after circulatory death Am J Transplant 2016. 16353–357 [DOI] [PubMed] [Google Scholar]
- 11.DuBois D, DuBois E. A formula to estimate the approximate surface area if height and weight be known Arch Intern Med 1916. 17863–871 [Google Scholar]
- 12.Collett D. Modelling Survival Data in Medical Research. 3rd ed. Florida: Chapman and Hall/CRC; 2015. [Google Scholar]
- 13.White IR, Royston P, Wood AM. Multiple imputation using chained equations: issues and guidance for practice Stat Med 2011. 30377–399 [DOI] [PubMed] [Google Scholar]
- 14.White IR, Royston P. Imputing missing covariate values for the Cox model Stat Med 2009. 281982–1998 [DOI] [PMC free article] [PubMed] [Google Scholar]
- 15.Wood AM, White IR, Royston P. How should variable selection be performed with multiply imputed data? Stat Med 2008. 273227–3246 [DOI] [PubMed] [Google Scholar]
- 16.Ho KJ, Owens CD, Johnson SR. Donor postextubation hypotension and age correlate with outcome after donation after cardiac death transplantation Transplantation 2008. 851588–1594 [DOI] [PubMed] [Google Scholar]
- 17.Kootstra G, Daemen JH, Oomen AP. Categories of non–heart-beating donors Transplant Proc 1995. 272893–2894 [PubMed] [Google Scholar]
- 18.Berenguer M. Risk of extended criteria donors in hepatitis C virus–positive recipients Liver Transpl 2008. 14S45–S50 [DOI] [PubMed] [Google Scholar]
- 19.Maluf DG, Edwards EB, Stravitz RT. Impact of the donor risk index on the outcome of hepatitis C virus–positive liver transplant recipients Liver Transpl 2009. 15592–599 [DOI] [PubMed] [Google Scholar]
- 20.O’Leary JG, Kaneku H, Jennings L. Donor-specific alloantibodies are associated with fibrosis progression after liver transplantation in hepatitis C virus–infected patients Liver Transpl 2014. 20655–663 [DOI] [PubMed] [Google Scholar]
- 21.Volk ML, Lok AS, Pelletier SJ. Impact of the model for end-stage liver disease allocation policy on the use of high-risk organs for liver transplantation Gastroenterology 2008. 1351568–1574 [DOI] [PubMed] [Google Scholar]
- 22.Bonney GK, Aldersley MA, Asthana S. Donor risk index and MELD interactions in predicting long-term graft survival: a single-centre experience Transplantation 2009. 871858–1863 [DOI] [PubMed] [Google Scholar]
- 23.Schaubel DE, Sima CS, Goodrich NP. The survival benefit of deceased donor liver transplantation as a function of candidate disease severity and donor quality Am J Transplant 2008. 8419–425 [DOI] [PubMed] [Google Scholar]
- 24.Feng S. Increased donor risk: who should bear the burden? Liver Transpl 2009. 15570–573 [DOI] [PubMed] [Google Scholar]


