
FIGURE 3.
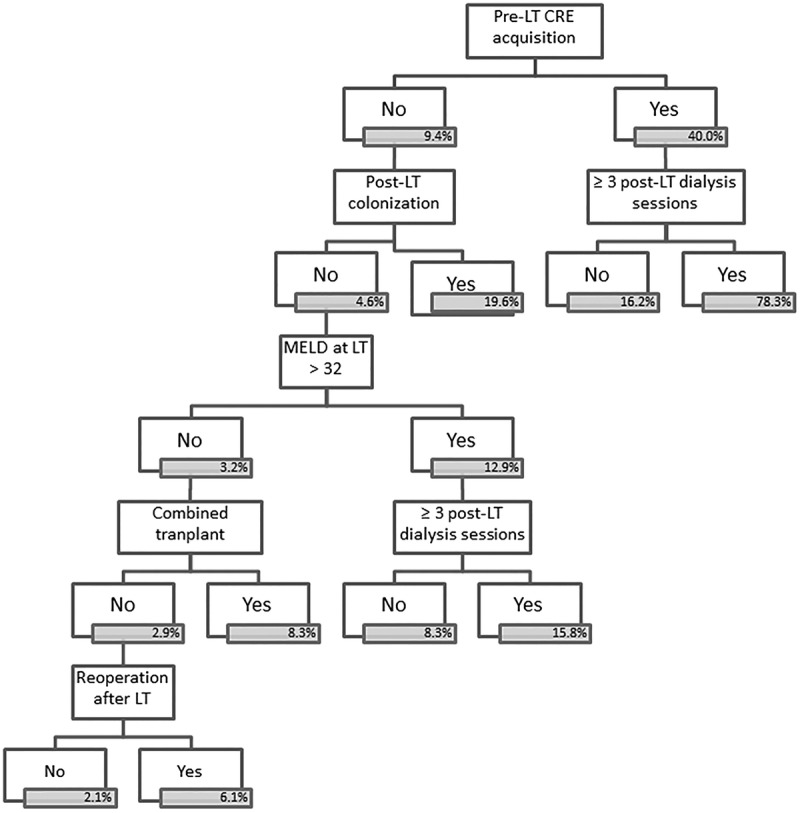
CART analysis of risk factors for infection with CRE among 386 patients undergoing LT. In blue boxes the incidence of CRE infection in that subgroup, in node square de P value for of the prediction of the outcome in this particular subgroup.