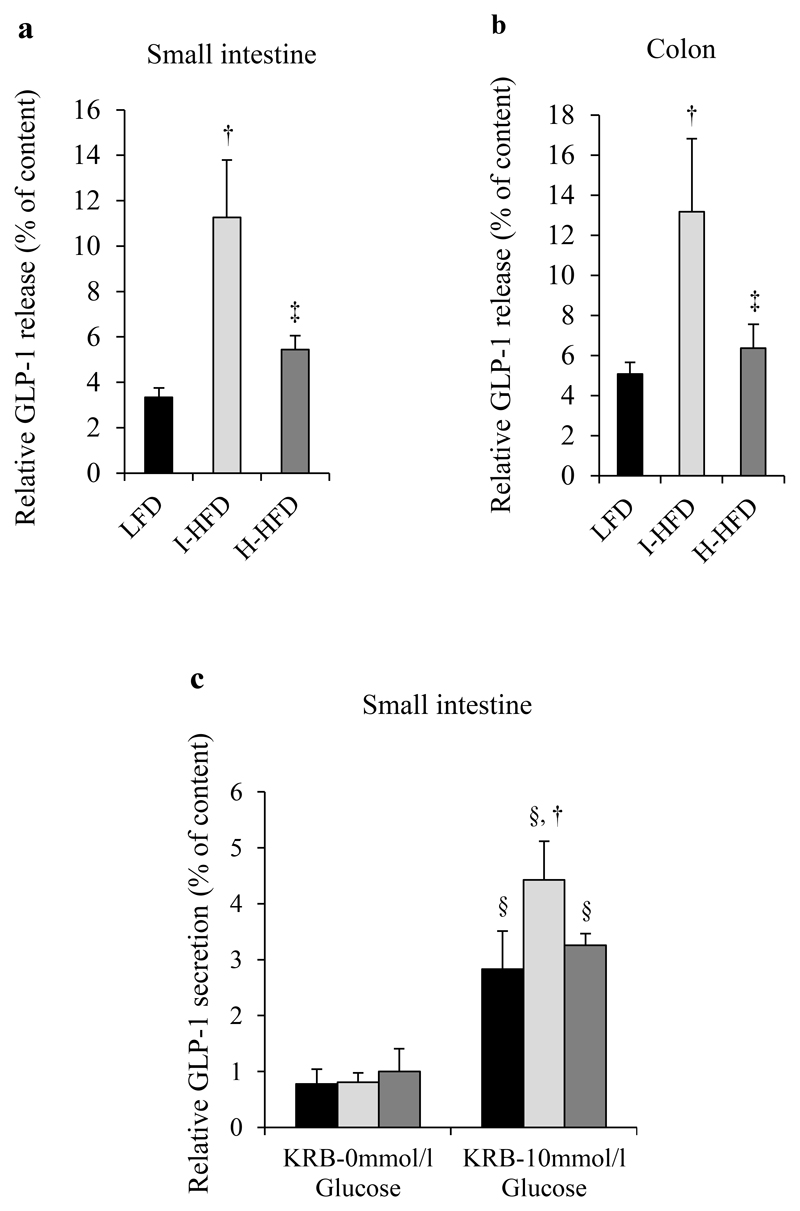
Figure 5. Functional analysis of intestinal L-cells in control and obese mice.
GLP-1 evaluated in supernatants and contents of dissociated mixed cells from small intestine (jejunum/ileum) (a) and colon (b) after 2h incubation in fresh complete medium and for small intestine in Krebs buffer ± 10mmol/l glucose (c). Histograms represent the percentage of GLP-1 measured from the supernatant of primary mixed cells relative to GLP-1 cell contents (n=6 animals per group). †, ‡ and § mean significant compared to LFD, I-HFD and KRB-0mmol/l glucose respectively. LFD (black bars, controls), I-HFD (light-grey bars) and H-HFD (dark-grey bars).

