Abstract
Aims
This study aimed to uncover the hub long non-coding RNAs (lncRNAs) differentially expressed in osteoarthritis (OA) cartilage using an integrated analysis of the competing endogenous RNA (ceRNA) network and co-expression network.
Methods
Expression profiles data of ten OA and ten normal tissues of human knee cartilage were obtained from the Gene Expression Omnibus (GEO) database (GSE114007). The differentially expressed messenger RNAs (DEmRNAs) and lncRNAs (DElncRNAs) were identified using the edgeR package. We integrated human microRNA (miRNA)-lncRNA/mRNA interactions with DElncRNA/DEmRNA expression profiles to construct a ceRNA network. Likewise, lncRNA and mRNA expression profiles were used to build a co-expression network with the WGCNA package. Potential hub lncRNAs were identified based on an integrated analysis of the ceRNA network and co-expression network. StarBase and Multi Experiment Matrix databases were used to verify the lncRNAs.
Results
We detected 1,212 DEmRNAs and 49 DElncRNAs in OA and normal knee cartilage. A total of 75 dysregulated lncRNA-miRNA interactions and 711 dysregulated miRNA-mRNA interactions were obtained in the ceRNA network, including ten DElncRNAs, 69 miRNAs, and 72 DEmRNAs. Similarly, 1,330 dysregulated lncRNA-mRNA interactions were used to construct the co-expression network, which included ten lncRNAs and 407 mRNAs. We finally identified seven hub lncRNAs, named MIR210HG, HCP5, LINC00313, LINC00654, LINC00839, TBC1D3P1-DHX40P1, and ISM1-AS1. Subsequent enrichment analysis elucidated that these lncRNAs regulated extracellular matrix organization and enriched in osteoclast differentiation, the FoxO signalling pathway, and the tumour necrosis factor (TNF) signalling pathway in the development of OA.
Conclusion
The integrated analysis of the ceRNA network and co-expression network identified seven hub lncRNAs associated with OA. These lncRNAs may regulate extracellular matrix changes and chondrocyte homeostasis in OA progress.
Cite this article: Bone Joint Res. 2020;9(3):90–98.
Keywords: Osteoarthritis, Competing endogenous RNA, Long non-coding RNA
Article focus
To uncover the hub long non-coding RNAs (lncRNAs) differentially expressed in osteoarthritis (OA) cartilage with an integrated analysis of the competing endogenous RNA (ceRNA) network and co-expression network.
Key messages
The integrated analysis of the ceRNA network and co-expression network identified seven hub lncRNAs associated with OA. These lncRNAs may regulate extracellular matrix changes and chondrocyte homeostasis in the progress of OA.
Strengths and limitations
The ceRNA network, a recently proposed hypothesis of regulatory analysis, was used to detect the pathogenesis of OA.
Integrated analysis of the ceRNA network and co-expression network was used to identify the hub lncRNA based on total RNA-sequencing data.
This study used a bioinformatics approach without experimental verification.
Introduction
Osteoarthritis (OA) is an age-related, destructive joint disease marked by disordered cartilage homeostasis with subsequent inflammation and degradation.1 OA can cause notable implications and a substantial and increasing economic burden for the individuals affected. It is estimated worldwide that 250 million people are currently subjected to this burdensome syndrome.2 Considering its increasing global prevalence and absence of effective treatments, gaining novel insights into biological mechanisms underlying OA is essential.
Advances in RNA sequencing and array technologies have now identified multiple non-coding RNAs, among which microRNAs (miRNAs) and long non-coding RNAs (lncRNAs) are relatively well studied.3,4 MicroRNAs were noted to act as fine-tuning regulatory molecules regulating the expression of some OA-related genes.3 For instance, miR33a was discovered to function in OA chondrocytes and target cholesterol efflux-related genes.4 Furthermore, miR-140 was shown to regulate the expression of Adamts-5 directly in cartilage development.4,5 Long non-coding RNAs are a type of RNA molecule greater than 200 nucleotides in length and involved in a wide variety of biological processes, including embryonic development, cell cycle progression, and chromatin remodelling.6 Recently, Thomson and Dinger7 reported that lncRNAs might function as competing endogenous RNAs (ceRNAs) and interact with mRNAs by competitively binding their common miRNAs. A growing list of lncRNAs, acting as ceRNAs, were demonstrated to be involved in OA.8–10 For example, lncRNA KLF3-AS1 served as a ceRNA by sponging miR-206 to facilitate GIT1 expression and mediate chondrocyte injury.9 DANCR, acting as a ceRNA to sponge miR-577, targeted SphK2 to regulate the survival of OA chondrocytes.8 In addition, MEG3 could alleviate lipopolysaccharide-induced inflammatory injury by up-regulation of miR-203 in ATDC5 cells.10
A recent study constructed a lncRNA-associated ceRNA network to identify eight lncRNA biomarkers associated with the progression of OA.11 Another study detected four differentially expressed lncRNAs (DElncRNAs) in OA cartilage through analysis of a protein-protein interaction network and a ceRNA regulatory network.12 Both of the above studies compared the expression data between OA patients, whether with mild pain and severe pain or with mild samples and severe samples. These papers may focus more on differential expression at different stages of OA. Moreover, identification of the hub lncRNAs in both studies was based on the ceRNA network.
In the current paper, we compared total RNA-sequencing (RNA-seq) data between OA and normal knee cartilage samples and aimed to detect the hub lncRNAs that are differentially expressed in OA onset and course. We identified the hub lncRNAs using integrated analysis of the ceRNA network and co-expression network. Meanwhile, we conducted function and pathway analysis to explore their potential mechanisms in the occurrence of OA.
Methods
Data collection and preprocessing
Total RNA-seq datasets of human knee cartilage were obtained from the Gene Expression Omnibus (GEO) database (GSE114007). Expression profiles data of ten OA and ten normal knee samples were based on platform GPL18573 (NextSeq 500 System; Illumina, San Diego, California, USA). We downloaded and merged the normalized data with the base package using R software (v3.5.3; R Foundation for Statistical Computing, Vienna, Austria). The data have undergone quality control and normalization using the software FastQC (v0.10.1) and the edgeR TMM method. The data were annotated by the Ensemble database. We chose Ensembl Gene 97 database and Human genes (GRCh38.p12) for annotation and lncRNA classification. Before performing differential expression analysis, we conducted principal component analysis (PCA). The PCA plot of gene expression in normal and OA articular cartilage samples reveals strong clustering of samples by phenotype (Figure 1).
Fig. 1.
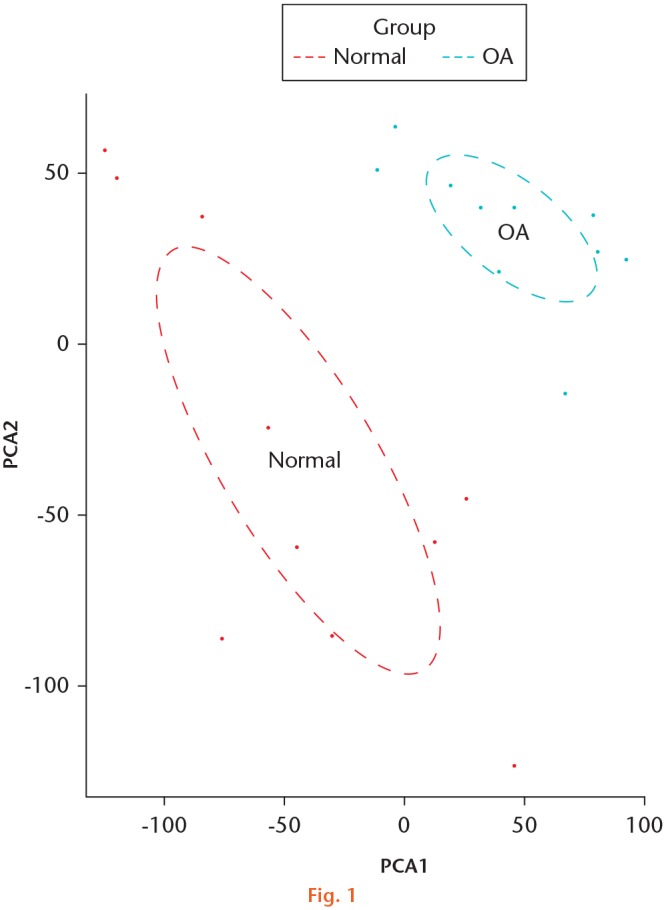
The principal component analysis (PCA) plot of gene expression in normal and osteoarthritis (OA) articular cartilage samples.
Differential analysis of lncRNAs and mRNAs
As there was a significant age difference between OA and normal patients (p < 0.001, independent-samples t-test), age (L: age < 40 years, M: 40 years ≤ age ≤ 60 years, H: age > 60 years) was included as a co-factor in the model. After analysis, we found no differentially expressed genes when age was regarded as the dependent variable. There was no significant difference in other factors, such as sex, the health condition of the patients, tissue sampling location, and body mass index.13 Long non-coding RNA and mRNA expression profiles were screened from the total RNA expression profiles using a Perl script. Differential expression analysis was performed with edgeR package. We used estimateCommonDisp() and estimateTagwiseDisp() function for estimating the dispersion, and exactTest() function for tagwise tests using the exact negative binomial test. By default, Benjamini and Hochberg's algorithm was used to control the false discovery rate (FDR). DElncRNAs and differentially expressed messenger RNAs (DEmRNAs) were discovered according to the following criteria: FDR < 0.05 and |log fold change (FC)| > 1.5. Pheatmap package14 and gplots package15 were used to make the heatmaps and volcano maps.
Construction of a ceRNA network
Human miRNA-lncRNA and miRNA-mRNA target data were collected from starBase (v2.0; Sun Yat-sen University, Guangzhou, China).16 In total, 18,482 miRNA-lncRNA interactions and 4,239,757 miRNA-mRNA interactions were identified, respectively. The interactions that matched with DElncRNAs and DEmRNAs were screened. Also, miRNA-lncRNA and miRNA-mRNA interactions that did not contain the same miRNA were eliminated. The remaining interactions were imported to Cytoscape (v3.7.1; National Resource for Network Biology)17 to construct a ceRNA network. Long non-coding RNAs that had more than ten interactions were regarded as potential hub lncRNAs. MicroRNAs that had two or more interactions were identified as crucial miRNAs.
Construction of a co-expression network
The R package WGCNA (v1.68; R Foundation for Statistical Computing) was used to construct the co-expression network by integrating expression profiles of lncRNA and mRNA. Scale-free topology model and mean connectivity were constructed for screening the optimal soft threshold power to make the soft threshold > 0.7. Then the adjacency matrix was created using the selected soft threshold power. We chose 0.6 as a threshold for the weight score of co-expression to get stronger interaction pairs between lncRNA and mRNA. Long non-coding RNAs in the network were regarded as potential hub lncRNAs.
Verification of the hub lncRNAs
After screening the potential hub lncRNAs from the ceRNA network and the co-expression network, we verified these lncRNAs based on the StarBase and Multi Experiment Matrix (MEM) databases.18 Long non-coding RNAs that have no target gene were excluded from the potential hub lncRNAs.
Function and pathway analysis
The Database for Annotation, Visualization, and Integrated Discovery (DAVID) (v6.8) was used to conduct gene ontology (GO) analysis. ClusterProfiler package and pathview package using R software (v3.5.3; R Foundation for Statistical Computing) was used to perform Kyoto Encyclopedia of Genes and Genomes (KEGG) analysis. Gene ontology terms, including biological process, cellular component, and molecular function were identified as significantly enriched by target genes of lncRNAs when FDR < 0.05 and Bonferroni correction < 0.01. KEGG terms were identified as significantly enriched when FDR < 0.05 and GeneRatio > 0.05.
Results
DElncRNAs in osteoarthritis and normal knee samples
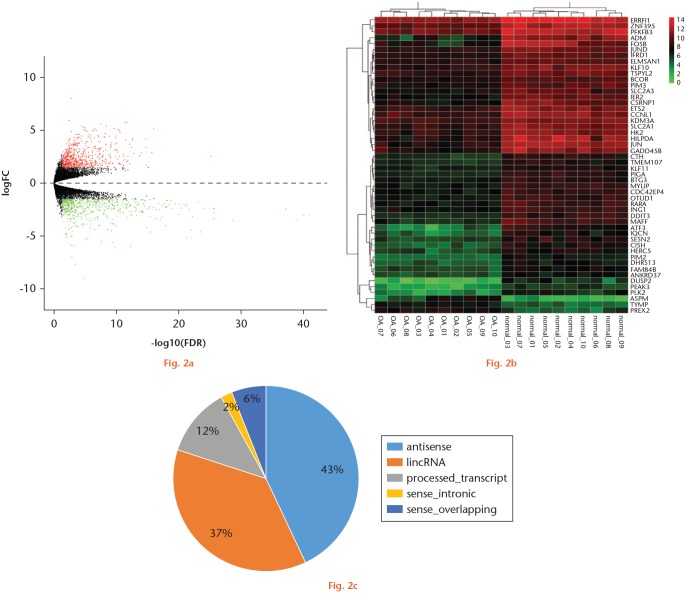
A total of 49 DElncRNAs (21 up-regulated and 28 down-regulated) were recognized in OA and normal knee cartilage (Supplementary Table i). The first ten up-regulated and down-regulated lncRNAs are shown in Table I. The distribution of all DElncRNAs according to the two dimensions of -log10(FDR) and logFC is represented by a volcano map in Figure 2a. The DElncRNAs were evaluated by a heatmap, as shown in Figure 2b. We divided all 49 lncRNAs into five groups: long intergenic non-coding RNA (lincRNA), antisense, processed_transcript, sense_intronic, and sense_overlapping (Figure 2c). The antisense and lincRNA group made up 43% and 37% of all lncRNA, respectively. No 3prime_overlapping_ncrna were identified.
Table I.
The top ten up-regulated and down-regulated long non-coding RNAs
| Type | lncRNA | logFC | p-value* | FDR |
|---|---|---|---|---|
| Up-regulated | LINC00654 | 1.72 | < 0.001 | 1.47E-11 |
| ISM1-AS1 | 2.61 | < 0.001 | 3.52E-10 | |
| FAM225A | 2.72 | < 0.001 | 2.13E-07 | |
| LNX1-AS1 | 2.48 | < 0.001 | 3.85E-07 | |
| SLC8A1-AS1 | 3.14 | < 0.001 | 4.81E-06 | |
| MIR31HG | 2.15 | < 0.001 | 2.65E-05 | |
| MAGI2-AS2 | 2.88 | < 0.001 | 1.14E-04 | |
| CELF2-AS2 | 1.94 | < 0.001 | 1.14E-04 | |
| LINC00839 | 2.57 | < 0.001 | 1.94E-04 | |
| ABCC5-AS1 | 3.15 | < 0.001 | 4.61E-04 | |
| Down-regulated | AL360012.1 | −2.74 | < 0.001 | 1.81E-13 |
| Z93241.1 | −2.73 | < 0.001 | 3.40E-12 | |
| ILF3-DT | −1.56 | < 0.001 | 3.52E-10 | |
| MATN1-AS1 | −2.52 | < 0.001 | 1.41E-09 | |
| MIR210HG | −1.66 | < 0.001 | 4.72E-08 | |
| SMG7-AS1 | −2.09 | < 0.001 | 1.36E-07 | |
| AFDN-DT | −2.20 | < 0.001 | 2.13E-07 | |
| PROSER2-AS1 | −1.62 | < 0.001 | 2.49E-07 | |
| LINC00167 | −1.82 | < 0.001 | 3.19E-07 | |
| TOB1-AS1 | −2.27 | < 0.001 | 1.41E-06 |
FC, fold change; FDR, false discovery rate; lncRNA, long non-coding RNA.
independent-samples t-test
Fig. 2.
Differentially expressed long non-coding RNA (DElncRNA) in osteoarthritis (OA) tissues and normal tissues of knee articular cartilage. a) Volcano map of DElncRNA; b) heatmap of DElncRNA; c) long non-coding RNA (lncRNA) classification. lincRNA, long intergenic non-coding RNA.
DEmRNAs in osteoarthritis and normal samples
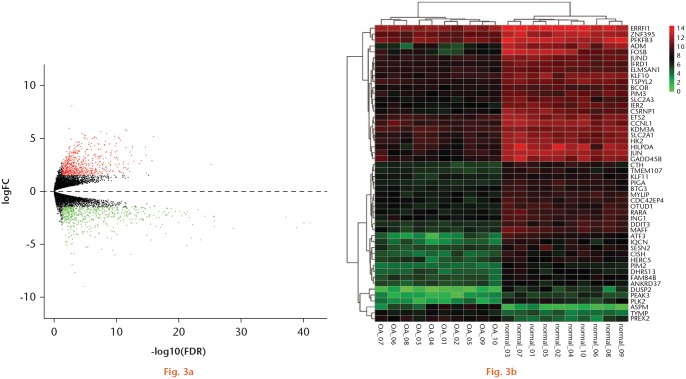
A total of 1,212 DEmRNAs (642 up-regulated and 570 down-regulated) were recognized. The first ten up-regulated and down-regulated mRNAs are outlined in Table II, and a volcano map of related DEmRNAs is depicted in Figure 3a. A heatmap showing the first 50 DEmRNAs is shown in Figure 3b.
Table II.
The top ten up-regulated and down-regulated messenger RNAs
| Type | mRNA | logFC | p-value* | FDR |
|---|---|---|---|---|
| Up-regulated | TYMP | 2.52 | < 0.001 | 6.78E-26 |
| ASPM | 5.15 | < 0.001 | 1.07E-16 | |
| PREX2 | 2.89 | < 0.001 | 1.99E-16 | |
| SKP2 | 1.69 | < 0.001 | 1.59E-15 | |
| CFI | 3.40 | < 0.001 | 1.74E-15 | |
| HMGA2 | 4.17 | < 0.001 | 2.07E-15 | |
| KCNN4 | 2.87 | < 0.001 | 1.03E-14 | |
| TTC9 | 2.59 | < 0.001 | 1.90E-14 | |
| THBS2 | 2.83 | < 0.001 | 1.59E-13 | |
| ST6GALNAC5 | 4.24 | < 0.001 | 2.54E-13 | |
| Down-regulated | DDIT3 | −3.00 | < 0.001 | 8.00E-42 |
| IER2 | −3.04 | < 0.001 | 8.06E-41 | |
| MAFF | −3.45 | < 0.001 | 1.34E-39 | |
| PIGA | −2.46 | < 0.001 | 6.58E-38 | |
| JUN | −3.53 | < 0.001 | 1.87E-29 | |
| RARA | −2.42 | < 0.001 | 2.05E-26 | |
| CISH | −3.35 | < 0.001 | 2.05E-26 | |
| PIM2 | −2.80 | < 0.001 | 2.05E-26 | |
| OTUD1 | −2.37 | < 0.001 | 2.61E-26 | |
| KLF10 | −2.37 | < 0.001 | 6.80E-25 |
FC, fold change; FDR, false discovery rate; mRNA, messenger RNA.
independent-samples t-test
Fig. 3.
Differentially expressed messenger RNAs (DEmRNAs) in osteoarthritis (OA) tissues and normal tissues of knee articular cartilage. a) The volcano map of DEmRNAs; b) heatmap of DEmRNAs.
Construction of a ceRNA network
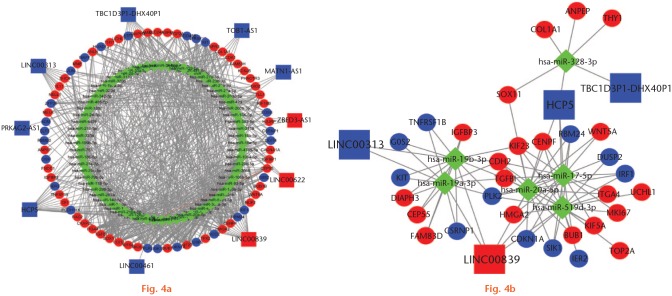
A total of 75 dysregulated lncRNA-miRNA interactions and 711 dysregulated miRNA-mRNA interactions were obtained in the ceRNA network (Figure 4a), including ten DElncRNAs, 69 miRNAs, and 72 DEmRNAs. A total of four lncRNAs, named HCP5, LINC00839, LINC00313, and TBC1D3P1-DHX40P1 were regarded as potential hub lncRNAs. Meanwhile, six miRNAs, including hsa-miR-19a-3p, hsa-miR-19b-3p, hsa-miR-17-5p, hsa-miR-20a-5p, hsa-miR-328-3p, and hsa-miR-519d-5p were identified as key miRNAs. The interactions of these lncRNAs, miRNAs, and their target genes are presented in the sub-network (Figure 4b).
Fig. 4.
Visualizations of differentially expressed long non-coding RNAs (DElncRNAs) and differentially expressed messenger RNAs (DEmRNAs). a) Competing endogenous RNA (ceRNA) network based on DElncRNAs and DEmRNAs; b) sub-network based on hub long non-coding RNAs (lncRNAs) and vital messenger RNAs (mRNAs). Green indicates down-regulated RNAs, blue indicates microRNAs (miRNAs), and red indicates up-regulated RNAs. The diamonds represent miRNAs, the rectangles represent lncRNAs, and the circles represent mRNAs.
Construction of a co-expression network
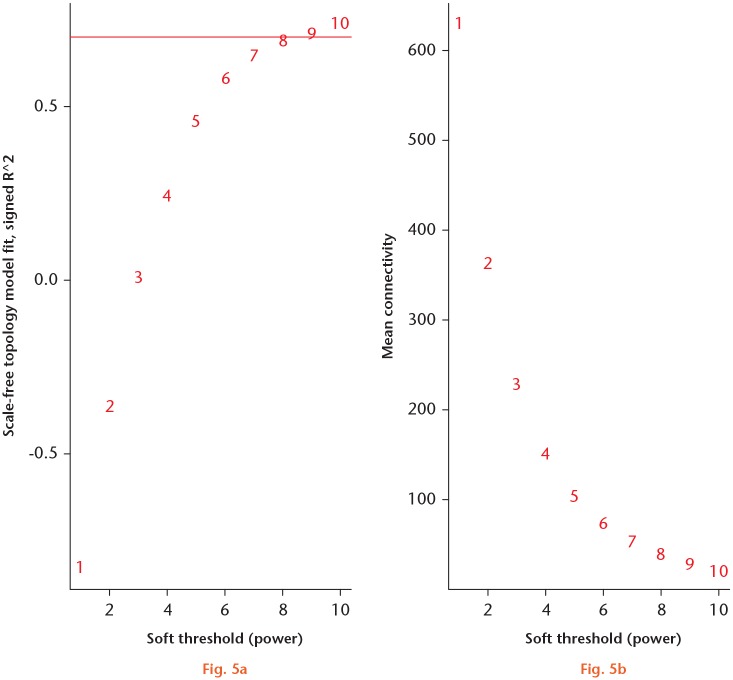
We chose 8 as the optimal soft threshold power based on the scale-free topology model and mean connectivity (Figure 5). A total of 1,330 lncRNA-mRNA interactions were identified to construct the co-expression network, which included ten lncRNAs and 407 mRNAs. In all, ten potential lncRNAs, including COL4A2-AS1, FAM225A, ILF3-DT, ISM1-AS1, LINC00654, LINC01554, MIR210HG, PART1, SLC8A1-AS1, and AC092143.1 were identified as potential lncRNAs.
Fig. 5.
Identification of optimal soft threshold power for the co-expression network. a) The scale-free fit index and b) the mean connectivity showed that β = 8 was chosen to establish long non-coding RNA (lncRNA)-messenger RNA (mRNA) interactions.
Verification of hub lncRNAs
A total of 14 potential hub lncRNAs were identified based on co-expression network analysis and ceRNA network. After the verification of the StarBase and MEM (University of Tartu, Tartu, Estonia) databases, seven lncRNAs named MIR210HG, HCP5, LINC00313, LINC00654, LINC00839, TBC1D3P1-DHX40P1, and ISM1-AS1 were finally identified as the hub lncRNAs related to the OA process.
Functional enrichment analysis
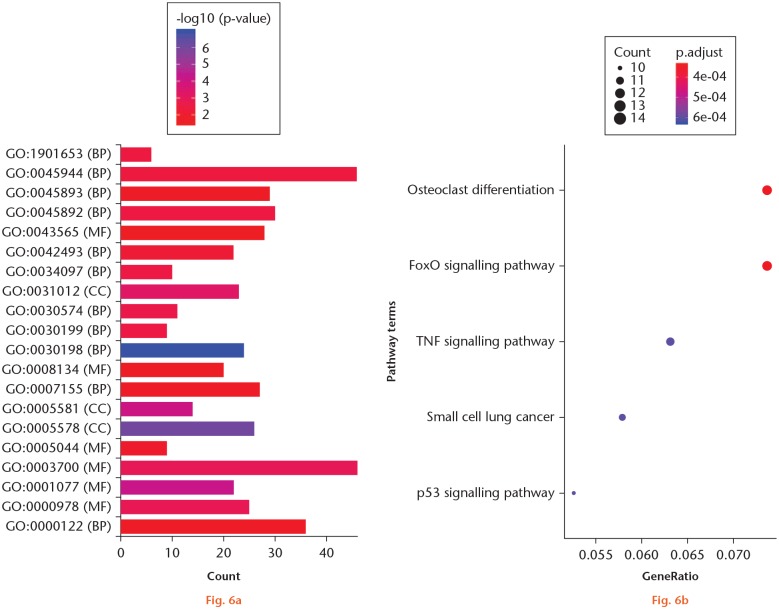
In total, 11 biological process terms, six molecular function terms, and three cellular component terms were identified as significantly enriched (Figure 6a and Supplementary Table ii). Likewise, 18 significantly enriched KEGG terms were detected (Supplementary Table iii). The top five pathway terms are shown in Figure 6b and Table III. The visualization of these pathways is presented in Supplementary Figure a.
Fig. 6.
Function and pathway enrichment analysis for differentially expressed target messenger RNAs (mRNAs) of hub long non-coding RNAs (lncRNAs). a) Bar chart showing the significantly enriched functions; b) scatter plot showing the top five of the significantly enriched pathways. BP, biological process; CC, cellular component; GO, gene ontology; MF, molecular function; TNF, tumour necrosis factor. All p-values were calculated using the t-test.
Table III.
Top five terms of Kyoto Encyclopedia of Genes and Genomes analysis
| ID | Description | GeneRatio | Count | FDR | Genes |
|---|---|---|---|---|---|
| hsa04380 | Osteoclast differentiation | 0.074 | 14 | 0.0003 | BTK, FCGR3A, FOS, FOSB, FOSL2, JUN, JUNB, JUND, NFKB2, NFKBIA, SOCS1, SOCS3, SPI1, TYROBP |
| hsa04068 | FoxO signalling pathway | 0.074 | 14 | 0.0003 | BCL6, BNIP3, CCND1, CCNG2, CDKN1A, CDKN1B, GADD45A, GADD45B, IRS2, KLF2, PLK2, PLK3, SKP2, SOD2 |
| hsa04668 | TNF signalling pathway | 0.063 | 12 | 0.0006 | BCL3, CEBPB, FOS, ICAM1, IRF1, JUN, JUNB, NFKBIA, NOD2, PTGS2, SOCS3, TNFRSF1B |
| hsa05222 | Small cell lung cancer | 0.058 | 11 | 0.0006 | CCND1, CDK6, CDKN1A, CDKN1B, CYCS, FN1, GADD45A, GADD45B, NFKBIA, PTGS2, SKP2 |
| hsa04115 | p53 signalling pathway | 0.053 | 10 | 0.0006 | CCND1, CCNG2, CDK1, CDK6, CDKN1A, CYCS, GADD45A, GADD45B, RRM2, SESN2 |
FDR, false discovery rate; TNF, tumour necrosis factor.
Discussion
The ceRNA network analysis is a recently proposed hypothesis of regulatory analysis, mostly used to explore the mechanism of tumourigenesis.19 For this study we chose to use this mechanism to detect the pathogenesis of OA. We discovered 1,212 DEmRNAs and 49 DElncRNAs in OA and normal knee cartilage using total RNA-seq. A total of seven hub lncRNAs were identified based on the integrated analysis of the ceRNA network and co-expression network and the verification of the StarBase and MEM databases. Subsequent function and pathway enrichment analysis revealed that these lncRNAs regulated extracellular matrix changes and chondrocyte homeostasis in the development of OA.
A previous study13 using the data of GSE114007 identified 1,310 DEmRNAs in 18 normal and 20 OA knee samples from two platforms according to the criteria of the adjusted p-value of < 0.05 and |log2FC| > 1. To minimize the batch effects, we analyzed ten normal and ten OA knee samples that were based on the same platform GPL18573. A total of 1,212 DEmRNAs were discovered with the criteria of FDR < 0.05 and a |logFC| > 1.5. Comparing the data from Fisch et al13 with our data, we found 601 overlapping DEmRNAs (Supplementary Figure b), including 312 up-regulated mRNAs and 389 down-regulated mRNAs.
Many studies have exemplified the role of miRNAs in OA pathogenesis.4,5,20 The miRNAs may also play pivotal roles in the ceRNA network and generally negatively regulate downstream mRNAs. Other types of RNA, such as circRNA21 or lncRNA,8,22 can regulate mRNAs by competing for the binding sites of miRNAs in the OA course. Overall, six miRNAs, including hsa-miR-19a-3p, hsa-miR-19b-3p, hsa-miR-20a-5p, hsa-miR-17-5p, hsa-miR-328-3p, and hsa-miR-519d-5p were identified to form the core of the ceRNA network. A previous study indicated that miR-19a might act as an oncogenic miRNA in bladder cancer.23 The hsa-miR-19a-3p and hsa-miR-19b-3p in another study were identified as biomarkers of colorectal cancer.24 Additionally, hsa-miR-20a-5p was reported to be down-regulated in multiple sclerosis.25 However, the role of these selected miRNAs in the development of OA needs further research.
Long non-coding RNAs are emerging as critical species-specific regulators of cellular and disease processes.26 They can also play a role by competing for the gene loci of miRNAs to regulate the expression of mRNA indirectly. Ajekigbe et al27 identified 92 DElncRNAs in knee OA cartilage, including 73 up-regulated and 19 down-regulated lncRNAs (FDR < 0.05). We obtained 133 DElncRNAs, including 52 up-regulated and 81 down-regulated lncRNAs when our cutoff criteria were FDR < 0.05. There are seven overlapping lncRNAs (Supplementary Figure c), including MEG3, MIR210HG, NEAT1, LINC00092, CRNDE, CYTOR, and C1orf220 between our studies. MEG3 was shown to be significantly down-regulated in OA cartilage in the research by Ajekigbe et al,27 which was consistent with our result.
In our study, we detected 49 DElncRNAs in OA and normal knee cartilage. Seven hub lncRNAs named MIR210HG, HCP5, LINC00313, LINC00654, LINC00839, TBC1D3P1-DHX40P1, and ISM1-AS1 were finally discovered. Several studies had shown that MIR210HG could be an essential biomarker for the diagnosis of glioma28 and could facilitate osteosarcoma cell invasion and metastasis.29 It may also play critical roles in the development of OA. HCP5 has been identified as a ceRNA in the process of breast cancer30 and pancreatic cancer,31 but its role as a ceRNA in the OA process remains to be studied.
Functional enrichment analysis revealed that these genes regulated extracellular matrix changes, including extracellular matrix organization, the collagen catabolic process, and collagen fibril organization. It has been shown that increased catabolism in the extracellular matrix of cartilage plays a crucial role in the development and progression of OA.32 Similarly, extracellular matrix organization33 and collagen fibril organization34 were significantly enriched in OA cartilage in previous studies. Pathway analysis revealed that these genes enriched in osteoclast differentiation, the FoxO signalling pathway, and the tumour necrosis factor (TNF) signalling pathway. Osteoclasts have been demonstrated to be involved in OA-related cartilage destruction.35 A recent study indicated that the osteoclastogenesis associated with enhanced inflammation could explain the high degree of bone destruction.36 Likewise, the research by Li et al37 demonstrated that the activity of osteoclast differentiation from bone marrow-derived cells was significantly increased in OA mice. FoxO transcription factors have proved to be protective factors in chondrocytes through regulation of autophagy38 and oxidative stress resistance,39 and their reduced expression was found in aged and OA cartilage. TNF-α and TNF-β are major proinflammatory cytokines40 and can critically mediate the disturbed processes implicated in OA pathophysiology.41 Yan et al42 restored anabolism-catabolism balance to prevent cartilage degradation in OA rats by suppression of TNF-α-induced activation of the NF-ĸB pathway in chondrocytes. In summary, these lncRNAs may influence the progress of OA by regulating extracellular matrix changes and chondrocyte homeostasis.
The current article had several advantages. Firstly, ceRNA was applied to explain the pathogenesis of OA, which provides a new therapeutic idea for OA. Secondly, the integrated analysis of the ceRNA network and co-expression network was used to identify the hub lncRNA based on total RNA-seq data. Additionally, the enriched functions and involved pathways of the hub lncRNAs were unveiled, which has laid the foundation for future mechanism research.
This study had several limitations. Firstly, the sample size was relatively small. Secondly, the hub lncRNAs were predictably discovered from total RNA-seq. Further studies are warranted to learn whether these detected lncRNAs are genuinely causal and can be finally used in clinical applications.
In conclusion, the integrated analysis of the ceRNA network and co-expression network identified seven hub lncRNAs associated with OA. These lncRNAs may regulate extracellular matrix changes and chondrocyte homeostasis in the progress of OA.
Acknowledgments
The authors thank Jianchun Guo for her help in the language editing.
Footnotes
Author Contributions: H. Chen: Designed the research, Acquired, analyzed, and interpreted the data, Drafted and critically revised the paper.
L. Chen: Designed the research, Interpreted the data, Critically revised the paper.
ICMJE COI statement: None declared
Ethical review statement: None declared.
Follow us @BoneJointRes
Supplementary Material
Tables illustrating data related to: differentially expressed long non-coding RNAs; significantly enriched gene ontology (GO) terms; and significantly enriched Kyoto Encyclopedia of Genes and Genomes (KEGG) terms. Figures illustrating data related to: pathview analysis of the top three differentially enriched pathways; the overlapping messenger RNA (mRNA) between the data from Fisch et al13 and our data; and the overlapping long non-coding RNA (lncRNA) between the data from Ajekigbe et al27 and our data.
Funding statement
No benefits in any form have been received or will be received from a commercial party related directly or indirectly to the subject of this article.
References
- 1. Zhang X, Bu Y, Zhu B, et al. Global transcriptome analysis to identify critical genes involved in the pathology of osteoarthritis. Bone Joint Res. 2018;7(4):298-307. [DOI] [PMC free article] [PubMed] [Google Scholar]
- 2. Hunter DJ, Bierma-Zeinstra S. Osteoarthritis. Lancet. 2019;393(10182):1745-1759. [DOI] [PubMed] [Google Scholar]
- 3. Yin CM, Suen WC, Lin S, Wu XM, Li G, Pan XH. Dysregulation of both miR-140-3p and miR-140-5p in synovial fluid correlate with osteoarthritis severity. Bone Joint Res. 2017;6(11):612-618. [DOI] [PMC free article] [PubMed] [Google Scholar]
- 4. Kostopoulou F, Malizos KN, Papathanasiou I, Tsezou A. MicroRNA-33a regulates cholesterol synthesis and cholesterol efflux-related genes in osteoarthritic chondrocytes. Arthritis Res Ther. 2015;17:42. [DOI] [PMC free article] [PubMed] [Google Scholar]
- 5. Miyaki S, Sato T, Inoue A, et al. MicroRNA-140 plays dual roles in both cartilage development and homeostasis. Genes Dev. 2010;24(11):1173-1185. [DOI] [PMC free article] [PubMed] [Google Scholar]
- 6. Ma L, Bajic VB, Zhang Z. On the classification of long non-coding RNAs. RNA Biol. 2013;10(6):925-933. [DOI] [PMC free article] [PubMed] [Google Scholar]
- 7. Thomson DW, Dinger ME. Endogenous microRNA sponges: evidence and controversy. Nat Rev Genet. 2016;17(5):272-283. [DOI] [PubMed] [Google Scholar]
- 8. Fan X, Yuan J, Xie J, et al. Long non-protein coding RNA DANCR functions as a competing endogenous RNA to regulate osteoarthritis progression via miR-577/SphK2 axis. Biochem Biophys Res Commun. 2018;500(3):658-664. [DOI] [PubMed] [Google Scholar]
- 9. Liu Y, Lin L, Zou R, Wen C, Wang Z, Lin F. MSC-derived exosomes promote proliferation and inhibit apoptosis of chondrocytes via lncRNA-KLF3-AS1/miR-206/GIT1 axis in osteoarthritis. Cell Cycle. 2018;17(21-22):2411-2422. [DOI] [PMC free article] [PubMed] [Google Scholar]
- 10. Wang Z, Chi X, Liu L, et al. Long noncoding RNA maternally expressed gene 3 knockdown alleviates lipopolysaccharide-induced inflammatory injury by up-regulation of miR-203 in ATDC5 cells. Biomed Pharmacother. 2018;100:240-249. [DOI] [PubMed] [Google Scholar]
- 11. Chen Y, Lin Y, Bai Y, Cheng D, Bi Z. A Long Noncoding RNA (lncRNA)-Associated Competing Endogenous RNA (ceRNA) Network Identifies Eight lncRNA Biomarkers in Patients with Osteoarthritis of the Knee. Med Sci Monit. 2019;25:2058-2065. [DOI] [PMC free article] [PubMed] [Google Scholar]
- 12. Xiao K, Yang Y, Bian Y, et al. Identification of differentially expressed long noncoding RNAs in human knee osteoarthritis. J Cell Biochem. 2019;120(3):4620-4633. [DOI] [PubMed] [Google Scholar]
- 13. Fisch KM, Gamini R, Alvarez-Garcia O, et al. Identification of transcription factors responsible for dysregulated networks in human osteoarthritis cartilage by global gene expression analysis. Osteoarthritis Cartilage. 2018;26(11):1531-1538. [DOI] [PMC free article] [PubMed] [Google Scholar]
- 14. Kolde R. Pheatmap: pretty heatmaps. R package version. 2019. https://rdrr.io/cran/pheatmap/ (date last accessed 10 February 2020).
- 15. Warnes MGR, Bolker B, Bonebakker L, et al. Package ‘gplots’. Various R Programming Tools for Plotting Data. 2020. https://rdrr.io/cran/gplots/ (date last accessed 10 February 2020).
- 16. Li JH, Liu S, Zhou H, Qu LH, Yang JH. starBase v2.0: decoding miRNA-ceRNA, miRNA-ncRNA and protein-RNA interaction networks from large-scale CLIP-Seq data. Nucleic Acids Res. 2014;42(Database issue):D92-D97. [DOI] [PMC free article] [PubMed] [Google Scholar]
- 17. No authors listed. National Resource for Network Biology (NRNB). 2020. https://nrnb.org/ (date last accessed 10 February 2020).
- 18. No authors listed. MEM - Multi Experiment Matrix. 2015. https://biit.cs.ut.ee/mem/ (date last accessed 24 January 2020).
- 19. Li Y, Ma B, Yin Z, et al. Competing endogenous RNA network and prognostic nomograms for hepatocellular carcinoma patients who underwent R0 resection. J Cell Physiol. 2019;234(11):20342-20353. [DOI] [PubMed] [Google Scholar]
- 20. Miyaki S, Asahara H. Macro view of microRNA function in osteoarthritis. Nat Rev Rheumatol. 2012;8(9):543-552. [DOI] [PMC free article] [PubMed] [Google Scholar]
- 21. Li HZ, Lin Z, Xu XH, Lin N, Lu HD. The potential roles of circRNAs in osteoarthritis: a coming journey to find a treasure. Biosci Rep. 2018;38(5):38. [DOI] [PMC free article] [PubMed] [Google Scholar]
- 22. Shen H, Wang Y, Shi W, Sun G, Hong L, Zhang Y. LncRNA SNHG5/miR-26a/SOX2 signal axis enhances proliferation of chondrocyte in osteoarthritis. Acta Biochim Biophys Sin (Shanghai). 2018;50(2):191-198. [DOI] [PubMed] [Google Scholar]
- 23. Feng Y, Liu J, Kang Y, et al. miR-19a acts as an oncogenic microRNA and is up-regulated in bladder cancer. J Exp Clin Cancer Res. 2014;33:67. [DOI] [PMC free article] [PubMed] [Google Scholar]
- 24. Giráldez MD, Lozano JJ, Ramírez G, et al. Circulating microRNAs as biomarkers of colorectal cancer: results from a genome-wide profiling and validation study. Clin Gastroenterol Hepatol. 2013;11(6):681-8.e3. [DOI] [PubMed] [Google Scholar]
- 25. Keller A, Leidinger P, Steinmeyer F, et al. Comprehensive analysis of microRNA profiles in multiple sclerosis including next-generation sequencing. Mult Scler. 2014;20(3):295-303. [DOI] [PubMed] [Google Scholar]
- 26. Lin J, Zhang X, Xue C, et al. The long noncoding RNA landscape in hypoxic and inflammatory renal epithelial injury. Am J Physiol Renal Physiol. 2015;309(11):F901-F913. [DOI] [PMC free article] [PubMed] [Google Scholar]
- 27. Ajekigbe B, Cheung K, Xu Y, et al. Identification of long non-coding RNAs expressed in knee and hip osteoarthritic cartilage. Osteoarthritis Cartilage. 2019;27(4):694-702. [DOI] [PMC free article] [PubMed] [Google Scholar]
- 28. Min W, Dai D, Wang J, et al. Long Noncoding RNA miR210HG as a Potential Biomarker for the Diagnosis of Glioma. PLoS One. 2016;11(9):e0160451. [DOI] [PMC free article] [PubMed] [Google Scholar]
- 29. Li J, Wu QM, Wang XQ, Zhang CQ. Long Noncoding RNA miR210HG Sponges miR-503 to Facilitate Osteosarcoma Cell Invasion and Metastasis. DNA Cell Biol. 2017;36(12):1117-1125. [DOI] [PubMed] [Google Scholar]
- 30. Wang L, Luan T, Zhou S, et al. LncRNA HCP5 promotes triple negative breast cancer progression as a ceRNA to regulate BIRC3 by sponging miR-219a-5p. Cancer Med. 2019;8(9):4389-4403. [DOI] [PMC free article] [PubMed] [Google Scholar]
- 31. Wang W, Lou W, Ding B, et al. A novel mRNA-miRNA-lncRNA competing endogenous RNA triple sub-network associated with prognosis of pancreatic cancer. Aging (Albany NY). 2019;11(9):2610-2627. [DOI] [PMC free article] [PubMed] [Google Scholar]
- 32. Yuan Y, Zhang GQ, Chai W, Ni M, Xu C, Chen JY. Silencing of microRNA-138-5p promotes IL-1β-induced cartilage degradation in human chondrocytes by targeting FOXC1: miR-138 promotes cartilage degradation. Bone Joint Res. 2016;5(10):523-530. [DOI] [PMC free article] [PubMed] [Google Scholar]
- 33. Zhang R, Guo H, Yang X, et al. Potential candidate biomarkers associated with osteoarthritis: Evidence from a comprehensive network and pathway analysis. J Cell Physiol. 2019;234(10):17433-17443. [DOI] [PubMed] [Google Scholar]
- 34. Li H, Yang HH, Sun ZG, Tang HB, Min JK. Whole-transcriptome sequencing of knee joint cartilage from osteoarthritis patients. Bone Joint Res. 2019;8(7):290-303. [DOI] [PMC free article] [PubMed] [Google Scholar]
- 35. Stock M, Menges S, Eitzinger N, et al. A Dual Role of Upper Zone of Growth Plate and Cartilage Matrix-Associated Protein in Human and Mouse Osteoarthritic Cartilage: Inhibition of Aggrecanases and Promotion of Bone Turnover. Arthritis Rheumatol. 2017;69(6):1233-1245. [DOI] [PubMed] [Google Scholar]
- 36. Lavocat F, Osta B, Miossec P. Increased sensitivity of rheumatoid synoviocytes to Schnurri-3 expression in TNF-α and IL-17A induced osteoblastic differentiation. Bone. 2016;87:89-96. [DOI] [PubMed] [Google Scholar]
- 37. Li X, Yang J, Liu D, et al. Knee loading inhibits osteoclast lineage in a mouse model of osteoarthritis. Sci Rep. 2016;6:24668. [DOI] [PMC free article] [PubMed] [Google Scholar]
- 38. Shen C, Cai GQ, Peng JP, Chen XD. Autophagy protects chondrocytes from glucocorticoids-induced apoptosis via ROS/Akt/FOXO3 signaling. Osteoarthritis Cartilage. 2015;23(12):2279-2287. [DOI] [PubMed] [Google Scholar]
- 39. Akasaki Y, Alvarez-Garcia O, Saito M, Caramés B, Iwamoto Y, Lotz MK. FoxO transcription factors support oxidative stress resistance in human chondrocytes. Arthritis Rheumatol. 2014;66(12):3349-3358. [DOI] [PMC free article] [PubMed] [Google Scholar]
- 40. Brenner D, Blaser H, Mak TW. Regulation of tumour necrosis factor signalling: live or let die. Nat Rev Immunol. 2015;15(6):362-374. [DOI] [PubMed] [Google Scholar]
- 41. Kapoor M, Martel-Pelletier J, Lajeunesse D, Pelletier JP, Fahmi H. Role of proinflammatory cytokines in the pathophysiology of osteoarthritis. Nat Rev Rheumatol. 2011;7(1):33-42. [DOI] [PubMed] [Google Scholar]
- 42. Yan L, Zhou L, Xie D, et al. Chondroprotective effects of platelet lysate towards monoiodoacetate-induced arthritis by suppression of TNF-α-induced activation of NF-ĸB pathway in chondrocytes. Aging (Albany NY). 2019;11(9):2797-2811. [DOI] [PMC free article] [PubMed] [Google Scholar]


