

Highlights
-
•
Individuals with alcohol use disorder were randomized to prazosin or placebo.
-
•
Greater deactivation in PCC and vmPFC to high-threat versus low-threat was observed.
-
•
Prazosin reduced subjective anxiety levels but did not change brain activity.
-
•
Patients with low anticipatory anxiety did not improve on prazosin.
-
•
Greater vmPFC deactivation predicted poor treatment response to prazosin.
Keywords: Prazosin, Anticipatory anxiety task, Alcohol use disorder, fMRI, Stress, Treatment
Abstract
Background
Higher levels of anxiety, negative affect, and impaired emotion regulation are associated with alcohol use disorder (AUD) and contribute to relapse and worse treatment outcomes. Prazosin, while typically used to treat post-traumatic stress disorder (PTSD) and other anxiety disorders, has shown promise for treating AUD. In order to better understand these underlying neural processes in individuals with AUD, our aims in this study were to measure brain activation during an anticipatory anxiety task before treatment to determine whether observed patterns supported previous work. We then aimed to measure the effects of prazosin on patients with AUD and explore whether greater baseline anticipatory anxiety (as measured by subjective and neural measures) predicts better treatment outcomes.
Methods
Thirty-four individuals seeking treatment for AUD participated in a six-week placebo-controlled study of prazosin and underwent an anticipatory anxiety task during fMRI scans at baseline and three weeks. Alcohol use over six weeks was measured.
Results
Greater levels of subjective anxiety and deactivation in posterior cingulate cortex (PCC) and ventromedial prefrontal cortex (vmPFC) were observed during high-threat stimuli compared to low-threat stimuli. Compared to placebo, prazosin reduced subjective anxiety to high-threat stimuli but there were no observed significant effects of prazosin on brain activation during the task. However, AUD patients with greater vmPFC deactivation during high threat relative to low threat and patients with low baseline anticipatory anxiety during the task had worse clinical outcomes on prazosin.
Conclusions
Deactivation in PCC and vmPFC to high-threat stimuli replicated previous work and shows promise for further study as a marker for AUD. Although prazosin did not affect brain activation in the regions of interest during the anticipatory anxiety task, subjective levels of anxiety and brain activation in vmPFC predicted treatment outcomes in individuals with AUD undergoing treatment with prazosin, highlighting individuals more likely to benefit from prazosin than others.
1. Introduction
Higher levels of anxiety, negative affect, and impaired emotion regulation are known to be associated with alcohol use disorder (AUD) and AUD severity and likely contribute to relapse and worse treatment outcomes (Berking et al., 2011; Charney et al., 2010; Kodl et al., 2008; Sinha, 2012; Wilcox et al., 2016, Wilcox and Tonigan, 2016). Negative affect triggers craving and drinking behavior and is perpetuated by negative conditioning (Koob, 2008) even in the face of possible negative consequences and/or a desire to remain abstinent. We need to better understand the underlying neural process, however, and its clinical relevance.
Functional MRI (fMRI) can be used to measure changes in brain activation during tasks evoking negative affect in SUD and which engage emotion regulation neural circuitry (Wilcox et al., 2016). Numerous such studies have been performed in AUD and other SUD (Ashare et al., 2016; Elton et al., 2015; Regier et al., 2017; Seo et al., 2016); also reviewed in (Wilcox et al., 2016). Contrary to what is seen in anxiety and depressive disorders, heightened activation of the amygdala and insula does not appear to be an essential component of negative affect states in SUD (O'Daly et al., 2012; Seo et al., 2013; Wang et al., 2010; Wilcox et al., 2016). Rather, in SUD, hypoactivation in the prefrontal cortex and anterior cingulate cortex is more commonly observed, as well as an association between hypoactivation in these areas and worse treatment outcomes (Wilcox et al., 2016). However, to our knowledge, only one fMRI study using an anticipatory anxiety task in AUD has been performed to examine the relationship between brain activation and AUD diagnosis or AUD severity (Yang et al., 2013). This study demonstrated deactivation to a high-threat stimulus relative to low-threat in rostral anterior cingulate cortex (rACC)/ventromedial prefrontal cortex (vmPFC) and posterior cingulate cortex (PCC) in AUD; controls did not demonstrate deactivation to high-threat.
Prazosin is an alpha-1 adrenergic antagonist used for the treatment of hyperarousal and night-mares in post-traumatic stress disorder and other anxiety or mood-related disorders (Feenstra et al., 2016; Roepke et al., 2017; Singh et al., 2016). It is presently under study for AUD treatment and has shown some efficacy (Haass-Koffler et al., 2017; Kenna et al., 2016; Simpson et al., 2015; Simpson et al., 2009; Wilcox et al., 2018b). Previous work has shown prazosin can normalize subjective response and hypothalamic-pituitary-adrenal (HPA) axis blunting to stressful stimuli in AUD (Fox et al., 2012). However, to our knowledge, no previous work has shown how prazosin affects subjective anxiety or the brain's response during tasks evoking negative affect or anticipatory anxiety tasks, although we would surmise it is acting by normalizing this circuitry as well.
With the growing number of available medications available with modest efficacy available for AUD treatment (Reus et al., 2018) it is increasingly important for us to identify not only how a medication is working but in whom it will be more likely to work best, as this can help guide clinical decision making. Measuring brain activation during an anticipatory anxiety task could identify individuals more likely to respond to prazosin. If prazosin is acting to normalize function in brain circuits it may also be true that individuals with the most deficient function in these brain circuits would be most likely to respond to treatment.
In this study, our first aim was to report on the brain activation patterns during an anticipatory anxiety task in an independent sample of individuals with AUD and determine if the activation patterns mirrored those observed in previous work (Yang et al., 2013). We hypothesized that deactivation to high-threat versus low-threat in PCC and rACC/vmPFC would be observed in AUD compared to controls. Our second aim was to measure the effects of prazosin on these neuroimaging metrics (Wilcox et al., 2018b). We expected that prazosin would be associated with normalization of the aforementioned neural signatures (less deactivation to high-threat vs. low-threat) and reduction in subjective anxiety during the task. Finally, our third aim was to explore whether greater dysfunction in the involved neural circuits or greater anticipatory anxiety would predict a more robust response to prazosin.
2. Material and methods
2.1. Participants
Participants were 34 (64.7% male) treatment-seeking individuals between the ages of 18 and 59 (mean 39.2 ± 11.4) with AUD who participated in a clinical trial of prazosin for the treatment of AUD results for and details about which are published elsewhere (Wilcox et al., 2018b). In brief, 36 individuals with current alcohol dependence were included in the parent study, but one participant was excluded from the present analyses as they declined participation in the imaging study due to claustrophobia and another due to enlarged brain ventricles. Participants were excluded from the trial if they were currently receiving alcohol treatment; currently taking anti-depressant, anti-craving, anxiolytic, anti-psychotic, mood stabilizing, or anti-convulsant medications; had any severe neurologic, cardiac, hepatic, or renal medical issues or any other serious medical conditions requiring immediate treatment; comorbid diagnoses of schizophrenia, schizoaffective disorder, post-traumatic stress disorder, bipolar I disorder, or dependence on another drug other than nicotine or cannabis; had suicidal thoughts during the past month; had any contraindications to fMRI; or were currently pregnant. This study utilized data obtained at the baseline visit and second scan session only. All participants underwent a baseline fMRI scan prior to initiation of study medications (either prazosin or placebo) and 23 underwent a second scan approximately 3 weeks after the initial brain scan, the procedures for which were identical.
2.2. Trial procedures
The study protocol was approved by the University of New Mexico Health Sciences Center Human Resources and Review Committee, the local Institutional Review Board, and the procedures followed were in accordance with the ethical standards of the responsible committee on human experimentation (institutional and national) and with the Helsinki Declaration. Informed consent was obtained from all individual participants in the study.
Once it was confirmed participants qualified for the study, they had a visit prior to the first scan session to prepare them for the stress task used during the fMRI, including temperature calibration and a preview run of the task for conditioning (see the Anticipatory Anxiety Task section for more details on this task).
Participants started medication after the first scan and returned approximately three weeks later for their second scan after having titrated up to a total of 16 mg daily dose, averaging 22.4 days (± 2.9) between medication start date and the second scan. Four COMBINE Medical Management visits (Anton et al., 2006) occurred between the first and second scan. A manuscript summarizing the methods and results of the clinical trial are published elsewhere (Wilcox et al., 2018b).
2.3. Measures
The Structured Clinical Interview for DSM Disorders (SCID) (Kranzler et al., 1996) was administered to all participants at the initial visit. All participants received a urine toxicology screen, a breath alcohol concentration (BAC) (excluded for BAC > 0.01), and a Clinical Institute Withdrawal Assessment of Alcohol Scale (Sullivan et al., 1989)(CIWA; excluded for score > 8) prior to the imaging sessions.
The Timeline Follow-back calendar was used to determine alcohol and other drug usage during the previous 90 days (Sobell et al., 1992) and throughout the study. Drinks per week (DPW), drinks per drinking day (DPDD), and percent days abstinent (PDA) were calculated from these data in the 90 days prior to the screen visit (BL90) and in the 90 days prior to the scan (Scan90).
Participants completed a series of measures addressing different aspects of AUD severity including our primary measures: the Alcohol Use Disorders Identification Test (AUDIT), a standard screening tool for AUD (Babor et al., 2011); and the Drinkers Inventory of Consequences (DRINC) which addresses consequences of heavy drinking (DrInC-2R) (Forcehimes et al., 2007).
Primary measures of emotion regulation were the Affective Lability Scale (AffLab) (Look et al., 2010) and of negative affect the PROMIS Anxiety (PrAnx), Depression (PrDep) and Anger (PrAng) T scores (Schalet et al., 2016). The State-Trait Anxiety Index (STAI) (Spielberger et al., 1970) (for which the Trait subscale was used for this portion of the study) the Beck Depression Inventory-Second Edition (BDI) (Richter et al., 1998) were also administered.
2.4. Anticipatory anxiety task
This fMRI task was designed after a task used in previous work (Yang et al., 2013, 2012). In brief, this was an anticipatory anxiety task during which participants were presented with a series of either a high-threat or a low-threat conditioned stimulus (CS) (circle or square) followed by application of an unpleasant or neutral unconditioned stimulus (US). Specifically, the high-threat CS signaled either the application of a non-painful (low heat) or painful (high heat) stimulus whereas the low-threat CS indicated that the low heat temperature would consistently follow. Heat stimuli were delivered with a thermode to the forearm (Fig. 1).
Fig. 1.

This figure is a schemata for the anticipatory anxiety task, and is an example for a participant who was randomized to have the square be their high-threat CS.
Temperature calibration, which occurred a day or two before the first scan, determined participant heat sensitivity and trained them in the anticipatory anxiety task. During calibration, a computerized thermal stimulator (Pathway Pain & Sensory Evaluation System, Medoc Ltd.) delivered heat to participants’ left inner forearm with a 30×30-mm square ATS (Advanced Thermal Stimulation) thermode. Heat sensitivity was determined by slowly increasing the thermode temperature from 30 °C to the maximum threshold of 50 °C, and participants were asked to click a mouse button when they felt that the thermode would burn them if it got any hotter (the increase in heat stopped when the mouse was clicked). This process was repeated four times, and the mean of the final three measurements was determined to be the pain threshold or high heat temperature. Low heat temperatures were set at 7.5 °C cooler and baseline temperatures at an additional 10 °C cooler.
After calibration was complete, participants underwent a conditioning session in which they performed one run of the anticipatory anxiety task and learned which shape (square or circle) was their threat shape; i.e., which conditioned stimulus (CS) would predict the uncertain onset of the painful unconditioned stimulus (US), the high-threat CS. The threat shape (square or circle) was pseudo-randomized between participants (balanced within condition assignment and presence or absence of anxiety disorder). The high-threat CS signaled application of either the low or high heat. The other shape was a low-threat CS which indicated that the low heat temperature would consistently follow. Each run of the stress task included 18 trials. Each trial had two periods: presentation of the high-threat or low-threat shape (CS for 8, 10, or 12 s, allowing jitter between the onset of CS and US) followed by the high or low heat US while the CS remained on the screen (8 s), and an inter-trial period (jittered 9–11 s) (see Fig. 1). Heat stimulus increased from baseline by 7.9 °C per second for high heat and by 4.5 °C/sec for low heat, remained at the peak temperature for 3 s, and returned to baseline. At each scan, participants underwent two full (18 trial) runs of the task and were asked at the end of each run about anxiety and pain experienced (see next section for details). High-threat and low-threat shapes alternated in a pseudo-randomized fashion over each run (9 high-threat and 9 low-threat per run), and the high or low heat US was pseudo-randomized within presentations of the high-threat shape (with 5 high heat US in the first run and 4 high heat US in the second run).
2.5. Anticipatory anxiety task subjective anxiety measures
Anticipatory anxiety was assessed subjectively at the end of each scan run by asking participants the amount of anxiety experienced to high-threat and low-threat CS (“How much anxiety did you feel when you saw this shape (the shapes were presented with the question below)?” with 1= “Not at all anxious” and 5 = “Extremely anxious”) and amount of pain experienced to high heat and to low heat (“How intense was the pain you felt with the high/low heat?” with 1= “Not at all painful” and 5 = “Extremely painful”).
2.6. MR imaging and analyses
Imaging data were collected on a Siemens 3 Tesla Tim Trio system using a 12 channel head coil. Structural images were collected with a multi-echo MPRAGE T1 sequence [TR (repetition time) = 2.53 s; TEs (echo time) = 1.64, 3.5, 5.36, 7.22, and 9.08 ms; flip angle = 7○; NEX (number of excitations) = 1; slice thickness = 1 mm; FOV (field of view) = 256 mm; resolution = 256×256; voxel size = 1.0 × 1.0 × 1.0 mm] and functional images with echo-planar images (TR = 2000 ms; TE = 29 ms; flip angle = 75◦; FOV = 240 mm; matrix size = 64 × 64; voxel size = 3.75 × 3.75 × 4.55 mm; slices = 33). Motion parameters were estimated from a rigid registration of subsequent images to the first image. All participants were analyzed for excessive motion (greater than three times the interquartile range on two or more of six parameters) compared to the rest of their cohort and none were determined to have excessive head motion using these criteria.
The AFNI software package (Cox, 1996) was used to process functional images using standard pre-processing techniques (slice-time correction, motion correction, 6 mm Gaussian full-width half-maximum spatial filter, and spatial normalization to Talairach space). A deconvolution analysis with 9 interval piecewise linear splines (tent functions) time locked to the TR (2 s) was performed on resulting images using AFNI.
Regressors in the deconvolution were tied to the onset time for several stimuli listed as follows: high pain, low pain, high threat (high threat CS followed by high pain US and high threat CS followed by low pain US as a single regressor), low threat/low pain (low threat CS followed by low pain US). Varying CS and inter-trial interval lengths (described in the Anticipatory Anxiety Task section) were designed to prevent collinearity of the CS and US regressors. The analyses also included 12 motion regressors (3 rotational, 3 translational and their derivatives). Beta estimates for regressors of interest [high threat/high pain, high threat/low pain, low threat/low pain] were first normalized by the model estimate of the baseline and averaged separately within 2 epochs [the early phase (2–6 s), the middle phase (6–10 s)] post-CS onset resulting in percent signal change (PSC) maps.
The reason two epochs were examined (early phase and middle phase) was that we did not know if there would be different timings of BOLD response to stimuli depending on clinical characteristics or across brain regions (Alvarez et al., 2011; Blackford et al., 2009) or what the shape of the hemodynamic function would be during this particular task. We did not expect the hemodynamic response function to necessarily follow a typical discrete event-evoked course, since the CS lasted for seconds. Relatedly, because of its length, there may have been more than one psychological process being elicited over the course of the cue presentation.
Paired t-tests were performed on the resulting early and middle phase PSC maps (high threat vs. low threat). Results from the paired t-tests (T maps) were corrected for false positives at alpha < 0.05 based on 10,000 Monte-Carlo simulations using spherical autocorrelation (individual voxel level p<0.005; minimum cluster size = 2175 microliters) within a white matter exclusion mask. The exclusion mask was derived from a spatially normalized atlas (FS_Desai_PM from AFNI) containing probabilistic maps of 40 ROI originally parcellated by FreeSurfer (Dale et al., 1999). Voxels that exceeded 80% probability of being in white matter or the ventricles (with the exception of 5th ventricle) were first selected to form a template mask, which was then dilated and eroded by 2 mm to fill small holes and smooth edges (more details on this mask in (Wilcox et al., 2019)). PSC values from the resulting significant regions were averaged within said regions and then carried forward into subsequent clinical analyses.
Unexpectedly, we did not observe effects in vmPFC in our whole brain analysis (see Results). A post-hoc regions of interest (ROI) analysis using anatomical masks of four regions was therefore performed (vmPFC-AL, vmPFC-BL, vmPFC-AR, vmPFC-BR; vmPFC-A = subcallosal & more posterior than vmPFC-B; a left and right region of each was examined separately) (Fig. 2). Anatomical masks were derived from the FSL Harvard-Oxford Atlas (Desikan et al., 2006; Goldstein et al., 2007; Makris et al., 2006). PSC from the aforementioned deconvolution analyses were averaged within these ROI to be carried forward into subsequent paired T-test and clinical analyses.
Fig. 2.
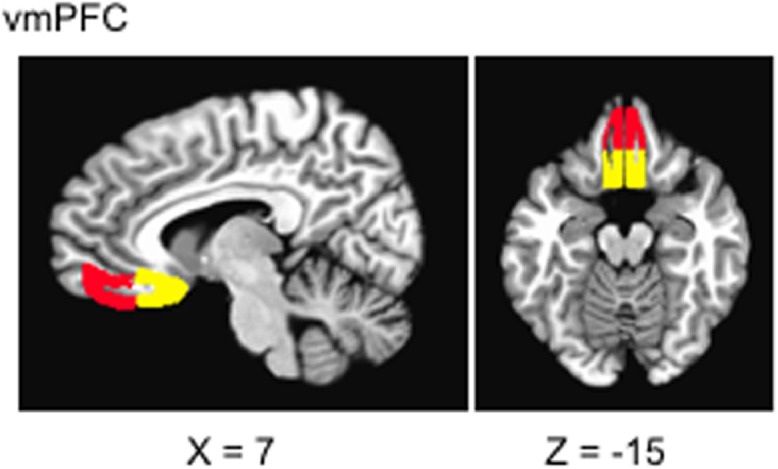
vmPFC-A in yellow (BAs: 11,24,25); vmPFC-B in red (BAs: 10,11). Regions are apriori anatomical masks derived from the FSL Harvard-Oxford Atlas (Desikan et al., 2006; Goldstein et al., 2007; Makris et al., 2006). Slice coordinates are given in Talairach space.
For the whole brain and ROI analyses, PSC in selected regions were obtained at a second scan (Scan 2) performed 3 weeks after initiation of prazosin. PSC from Scan 2 images were obtained by performing the same preprocessing and level 1 (deconvolution) analyses described above, and then taking a binary mask derived from the regions in which there was a significant difference between high-threat and low-threat on the paired T-test, obtained from the Scan 1 whole brain analysis, or by using the same vmPFC binary masks utilized in the ROI analysis.
2.7. Cerebral blood flow analyses
A pulsed Arterial Spin Labeling (pASL) image was acquired to quantify relative cerebral blood flow (CBF) [Siemens PICORE; 52 pairs of label/control axial images; TR =4000 ms; TE = 12 ms; TI1 = 700 ms; TI2 = 1800 ms; label thickness = 100 mm; voxel size = 3.75×3.75×5.00 mm]. All images were 2D and 3D registered to the reference image to account for subject motion. Each pair of labeled images were subtracted from the control images after which a single mean perfusion image was calculated. CBF was calculated using in-house software following (Wang et al., 2003) with a blood/tissue water partition coefficient of 0.9 mL/g and inversion efficiency of 0.95. However, to account for slice distance from the inversion slab, TI2 was increased by 42.5 ms at each slice inferior to superior. CBF images spatially normalized to Talairach space.
A final exploratory analyses using baseline CBF to correct for overall changes in blood flow was performed, due to the known vasodilatory effects of prazosin on the cardiovascular system. It has been proposed that effects of medications on blood flow should be considered during pharmacological fMRI studies, as has been done in previous work (Haller et al., 2013; Wu et al., 2014) to attempt to parse the neural mechanisms of a medication from vascular mechanisms (Salmeron and Stein, 2002). CBF may indicate effects from the vascular endpoints of drug actions, (Khalili-Mahani et al., 2014; Ogoh et al., 2010) and may be altered by changes in BP (Jennings et al., 2008; Waldstein et al., 2010),whereas BOLD signal is ideally primarily representing effects on neuronal endpoints. BOLD signal may not be independent of CBF (Viviani et al., 2012) although the degree to which alterations in baseline CBF affect BOLD signal is unknown, and possibly insignificant (Liau et al., 2008), which is why this was not corrected for in our primary analysis.
2.8. Statistical modeling
Latent growth modeling was used to explore whether brain activation or subjective ratings of anxiety during the task moderated response to medication in predicting changes in drinking over time, or drinking trajectories, with Mplus Version 8 software. PDA was the only outcome variable for which analyses converged, so we chose to run all analyses for Aim 3 with this outcome variable only. We modeled trajectories in PDA over time as quadratic functions (PDA at baseline over the previous 90 days, PDA from 0–2 weeks, PDA from 2–4 weeks and PDA from 4–6 weeks following medication initiation) as outcomes. Predictors were medication condition and one of five variables obtained at the initial scan visit: three imaging variables that emerged from the fMRI analyses described below, subjective anxiety to high threat minus low threat, and subjective anxiety to high threat (total of five analyses performed). An interaction effect (treatment condition*imaging variables) was also included as a predictor. Simple slopes analyses for significant interactions were performed by estimating multiple group latent growth curve models with treatment condition as the grouping variable.
3. Results
3.1. Clinical results
Participants were 50% Caucasian, 23.5% Native American, 2.9% Asian, 14.6% mixed/other, and 8.8% did not report their race; 38.2% were of Hispanic/Latino ethnicity. 14.6% of participants were unemployed and had 14.1 ± 1.9 years of education. 38.2% of participants were smokers.
At the time of the baseline scan, all individuals had a BAC level <0.01, all individuals had a CIWA of less than 4 (0.79 ± 1.07), 6 individuals had a urine positive for THC, and 3 individuals had a urine positive for benzodiazepines. However, all participants stated they had not used any illicit drugs in the 24 h before the scan. Finally, 6 individuals reported drinking alcohol within 24 h of the scan (1, 2, 3, 3.2, 5, and 12.7 standard drinks, respectively). Please see supplemental materials for additional clinical characteristics of the participants.
There were no significant differences between groups on key demographic variables either when they were analyzed for the entire sample (Table 1) or in the subgroup that followed up for the second scan (n = 11 prazosin, n = 12 placebo).
Table 1.
Participant Characteristics by Medication Group [m (SD)].
| Measure | Prazosin (n = 18) | Placebo (n = 16) |
|---|---|---|
| Age | 38.6 (12.4) | 39.9 (10.6) |
| Gender (% male) | 66.7 | 62.5 |
| Years Education | 13.79 (1.69) | 14.41 (2.17) |
| AUDIT | 21.24 (7.60) | 20.44 (6.92) |
| DPDD (90 days pre-Scan 1) | 8.33 (4.46) | 8.47 (4.60) |
| DPW (90 days pre-Scan 1) | 34.54 (25.62) | 27.24 (18.06) |
| PDA (90 days pre-Scan 1) | 37.10 (30.43) | 43.33 (34.03) |
| CIWA (Scan 1) | 0.78 (1.11) | 0.81 (1.05) |
| CIWA (Scan 2) | 0.93 (1.34) | 1.08 (1.31) |
| STAI Trait | 36.17 (10.63) | 41.13 (11.51) |
| STAI State (Scan 1) | 31.50 (9.59) | 34.88 (11.12) |
| STAI State (Scan 2) | 29.93 (9.16) | 33.33 (9.70) |
| BDI (Scan 1) | 7.89 (7.75) | 10.63 (6.71) |
| ALS | 27.56 (10.15) | 27.75 (9.84) |
| PROMIS Anxiety (Scan 1) | 14.61 (6.66) | 16.19 (5.55) |
| PROMIS Anxiety (Scan 2) | 12.47 (4.64) | 13.08 (3.80) |
| PROMIS Depression (Scan 1) | 12.83 (5.00) | 16.00 (7.43) |
| PROMIS Depression (Scan 2) | 10.40 (3.00) | 13.17 (6.21) |
| PROMIS Anger (Scan 1) | 16.44 (5.98) | 16.88 (5.73) |
| PROMIS Anger (Scan 2) | 15.53 (5.82) | 15.25 (3.82) |
| High Heat Threshold ( °C) | 46.90 (2.88) | 48.02 (2.55) |
| Threat Shape (number circle) | 8 | 7 |
| Scan 1 HT Anxiety | 2.44 (0.98) | 2.56 (1.08) |
| Scan 2 HT Anxiety | 1.86 (1.16) | 2.87 (0.96) |
| Scan 1 LT Anxiety | 1.33 (0.54) | 1.38 (0.56) |
| Scan 2 LT Anxiety | 1.18 (0.34) | 1.42 (0.51) |
| Scan 1 high heat Pain | 2.90 (1.17) | 3.38 (1.20) |
| Scan 2 high heat Pain | 2.41 (1.28) | 3.17 (0.94) |
| Scan 1 low heat Pain | 1.19 (0.39) | 1.44 (0.91) |
| Scan 2 low heat Pain | 1.18 (0.34) | 1.29 (0.45) |
AUDIT = Alcohol Use Disorders Identification Test, PDA = percent days abstinent, DPW = drinks per week, DPDD = drinks per drinking day, BDI = Beck Depression Inventory, ALS = Afffective Lability Scale, STAI = State-Trait Anxiety Index, HT = high-threat, LT = low-threat, CIWA = Clinical Institute Withdrawal Assessment of Alcohol Scale.
Note: When analyses of baseline differences were limited to the n = 23 that followed up for the second scan, there were still no significant differences between the groups for any of the demographic or behavioral variables at baseline. Dropouts did not significantly differ from individuals who followed up (Table S4).
3.2. Behavioral results
Anxiety ratings are summarized in Table 1 and demonstrated no significant differences between the prazosin and placebo groups during Scan 1. Two 2 × 2 ANOVAs were performed. One for self-reported pain [Self-reported pain factors: Pain (high-heat versus low heat) and Condition (prazosin versus placebo)] and another for self-reported anxiety [Self-reported anxiety factors: Anxiety (high-threat versus low-threat) and Condition (prazosin versus placebo)]. For neither of the analyses were the interaction terms or condition significant. However, both the Anxiety and Pain factors were significant (p = 0.000). Post hoc tests revealed that greater levels of anxiety were observed during high-threat (mean 2.44, SD 0.98) compared to low-threat (mean 1.33, SD 0.54) stimuli (p <0.001, T 7.72) and pain during high-heat (mean 2.90, SD 1.17) compared to low-heat (mean 1.19, SD 0.39) stimuli (p<0.001, T 9.453).
3.3. Aim 1 results: brain areas showing a significant difference in activation between high-threat and low-threat stimulus
No significant effects of threat stimulus type on bold signal were found during the early phase (2–6 s post-stimulus onset) using whole brain analyses. During the middle phase (6–10 s post stimulus onset), deactivation (Fig. 3a–c) for high-threat relative to low-threat was observed within the posterior cingulate cortex and precuneus/cuneus (herein referred to as PCC); BAs 29,18,31,7; cluster size 6541 µl) (mean high-threat PSC −0.153, SD 0.187; mean low-threat PSC −0.015, SD 0.176) and in right dorsolateral prefrontal cortex (dlPFC); right middle and superior frontal gyrus, BA 8,6; cluster size 2457 µl) (mean high-threat PSC −0.081, SD 0.157; mean low-threat PSC 0.014, SD 0.150).
Fig. 3.

a. Baseline (Scan 1) Imaging Results (Aim 1). During the middle phase (6–10 s post stimulus onset), deactivation for high-threat relative to low-threat was observed within the posterior cingulate cortex and precuneus/cuneus (PCC; BAs 29,18,31,7; cluster size 6541 µl) (mean high-threat PSC −0.153, SD 0.187; mean low-threat PSC −0.015, SD 0.176) and in right dorsolateral prefrontal cortex and right middle and superior frontal gyrus (dlPFC; BAs 8,6; cluster size 2457 µl) (mean high-threat PSC −0.081, SD 0.157; mean low-threat PSC 0.014, SD 0.150). Slice coordinates are given in Talairach space.
b. Box plots depicting PSC for high-threat (HT), low-threat (LT) and the difference between them (HT-LT) for the dlPFC and PCC during the middle phase for all participants at Scan 1. The center line depicts the median. Circles represent outliers with values between 1.5 and 3 times the interquartile range.
c. Mean impulse response function graphs for PCC for all participants at Scan 1.
d. Mean impulse response function graphs for dlPFC for all participants at Scan 1.
Since there were null results in the vmPFC, post-hoc ROI analyses of anatomic vmPFC regions were performed using a binary mask from the FSL Harvard-Oxford Atlas as described in the methods (Fig. 2, Table S1). The vmPFC-AL early phase signal showed deactivation for high-threat and activation to low-threat and a significant difference between the two stimuli (mean high-threat PSC −0.133, SD 0.697; mean low-threat PSC 0.162, SD 0.798; T=−3.805, p = 0.001). During the early phase, within vmPFC-BL, deactivation for high-threat and activation to low-threat and a significant difference between the two stimuli was also observed (mean high-threat PSC −0.136, SD 0.857; mean low-threat PSC 0.236, SD 0.824; T=−2.411, p = 0.022). Because we performed 8 tests (an early and middle phase for 4 vmPFC ROI's), we only considered the effects in vmPFC-AL to be significant (Bonferroni correction of 0.00625), and therefore carried only this region forward of the vmPFC regions for Aims 2 and 3 (Fig. 4a,b).
Fig. 4.

a. Box plots depicting PSC for high-threat (HT), low-threat (LT) and the difference between them (HT-LT) for the percent signal change in left ventromedial PFC during the early phase (vmPFC-AL; yellow region in Fig. 2) for all participants at Scan 1. The center line depicts the median. Circles represent outliers with values between 1.5 and 3 times the interquartile range. Stars represent outliers with values more than 3 times the interquartile range.
b. Mean impulse response function graphs for vmPFC-AL for all participants at Scan 1.
3.4. Aim 2 results: effects of prazosin on identified clusters/regions of interest during threat and in-scan subjective anxiety measures
Twelve of the individuals assigned to placebo and 11 of those assigned to prazosin had a second fMRI scan (Scan 2). To determine effects of prazosin on subjective anxiety during the anticipatory anxiety task and BOLD signal to high-threat relative to low-threat (HT-LT) in PCC, dlPFC and vmPFC-AL, we performed a series of 2 × 2 repeated measures ANOVAs with Scan (1 vs. 2) as a within subjects factor, and Condition (prazosin vs. placebo) as a between subjects factor. Given the group baseline differences in PSC in some of the ROIs in these ANOVAs, we also performed a series of simple regressions, using Scan 2 PSC (HT-LT) during the scan as the dependent variable, and Scan 1 PSC (HT-LT) during the scan and condition (prazosin vs. placebo) as predictors. We did a similar series of analyses for subjective anxiety to high-threat or to HT-LT during the scan.
Prazosin reduced the subjective experience of anxiety to high-threat compared to placebo (beta=−0.354, p = 0.041), but there were no significant effects of prazosin on brain activation (HT-LT) in any of our regions of interest by regression or ANOVA. (Table 2, Fig. 5, Figure S1).
Table 2.
Table showing effects of prazosin versus placebo on brain activation and subjective anxiety during the anticipatory anxiety task.
| Repeated Measures ANOVA |
Regression | |||||
|---|---|---|---|---|---|---|
| Placebo Scan 1 | Placebo Scan 2 | Prazosin Scan 1 | Prazosin Scan 2 | |||
| Fac*Cond F/p | Mean (SE) | Mean (SE) | Mean (SE) | Mean (SE) | Cond β/p | |
| PCC HT-LT | 3.386/0.080 | −0.065 (0.047) | −0.116 (0.071) | −0.233 (0.049) | −0.053 (0.074) | 0.052/0.671 |
| dlPFC HT-LT | 1.818/0.192 | −0.052 (0.028) | −0.021 (0.039) | −0.132 (0.029) | −0.011 (0.040) | 0.015/0.810 |
| vmPFC HT-LT | 1.849/0.188 | −0.204 (0.115) | −0.154 (0.197) | −0.336 (0.120) | 0.092 (0.206) | 0.242/0.264 |
| Anxiety HT | 2.870/0.105 | 2.708 (0.304) | 2.875, (0.306) | 2.364 (0.317) | 1.864 (0.320) | −0.354/0.041 |
| Anxiety HT-LT | 2.949/0.101 | 1.250 (0.258) | 1.458 (0.298) | 1.136 (0.270) | 0.682 (0.311) | −0.332/0.072 |
SE = standard error, HT = high-threat, LT = low-threat, HT-LT = high threat minus low threat, PCC = percent signal change in the posterior cingulate cortex, dlPFC = percent signal change in the right dorsolateral prefrontal cortex, vmPFC = percent signal change in the left ventromedial prefrontal cortex (yellow region, Fig. 2), Anxiety = in-scan subjective ratings of anxiety to task stimuli.
Fig. 5.

This figure depicts effects of prazosin on the subjective experience of anxiety to high-threat during the anticipatory anxiety task. Statistical values for an ANOVA and regression are presented (see Table 2).
3.5. Aim 3 results: moderators of treatment outcome to prazosin
Latent growth curve modeling was utilized to probe for moderators of prazosin treatment outcome trajectories (PDA over time during treatment). Five analyses were run with the following variables (obtained at baseline) probed as moderators: vmPFC-AL HT-LT, dlPFC HT-LT, PCC HT-LT, subjective anxiety to high-threat, subjective anxiety to high-threat minus low-threat. A significant condition (prazosin vs. placebo)*baseline variable interaction term for vmPFC-AL (p = 0.005) and subjective anxiety to high-threat (p = 0.028) was observed (Figs. 6,7; model fit statistics in Table S2), indicating that both of these variables were moderators of treatment outcome.
Fig. 6.

This figure depicts drinking trajectories in percent days abstinent over six weeks, to explore the significant interaction effect for condition (prazosin vs. placebo)*subjective anxiety ratings (Anx) during high-threat. High versus Low Anx is defined by a median split.
Fig. 7.

a. This figure depicts drinking trajectories in percent days abstinent over six weeks, to explore the significant interaction effect for condition (prazosin vs. placebo)*percent signal change in left ventromedial PFC during the early phase (vmAL; yellow region in Fig. 2) during high-threat relative to low-threat stimuli. High versus Low vmAL is defined by a median split.
b. Mean impulse response function graphs for vmPFC-AL for the 17 participants with the highest vmPFC-AL PSC values at Scan 1.
c. Mean impulse response function graphs for vmPFC-AL for the 17 participants with the lowest vmPFC-AL PSC values at Scan 1.
Simple slopes analyses indicated that there was a significant positive effect of subjective anxiety to high-threat on the slope of PDA in the prazosin group (B(SE) = 6.04 (2.86), p = 0.035). Thus, higher reactivity to threat was associated with more days abstinent on prazosin, whereas lower reactivity to threat was associated with less days abstinent on prazosin. In the placebo group there was no relation between subjective anxiety to high threat and the slope of PDA (B(SE) = −4.60 (2.83), p = 0.10). (Fig. 6)
Simple slopes analyses also indicated that there was also a significant positive effect of activation in vmPFC-AL on the slope of PDA in the prazosin group (B(SE) = 11.72 (4.86), p = 0.016). Thus higher deactivation to threat was associated with less days abstinent on prazosin, whereas lower deactivation to threat was associated with more days abstinent on prazosin. In the placebo group, there was a negative effect of activation in vmPFC-AL on the slope of PDA in the placebo group (B(SE) = −12.37 (6.12), p = 0.043) indicating that higher deactivation to threat was associated with more days abstinent on prazosin, by contrast. (Fig. 7)
In summary, those with lower subjective experience of anticipatory anxiety and those with more deactivation to high-threat relative to low threat were less likely to improve on prazosin over six weeks of treatment.
3.6. Cerebral blood flow results
To explore whether the effects of prazosin on BOLD signal might be confounded by changes in baseline cerebral blood flow, we ran a series of repeated measures ANOVAs with Scan (1 vs. 2) as a within subjects factor, and Condition (prazosin vs. placebo) as a between subjects factor for CBF within the three ROI's of interest (Table 3). These analyses indicated that prazosin reduced CBF within the PCC, but increased CBF within dlPFC and vmPFC-AL.
Table 3.
Table showing effects of prazosin versus placebo on cerebral blood flow.
| Effects prazosin on CBF | Repeated Measures ANOVA |
Regression | ||||
|---|---|---|---|---|---|---|
| Placebo Scan 1 | Placebo Scan 2 | Prazosin Scan 1 | Prazosin Scan 2 | |||
| Fac*Cond F/p | Mean (SE) | Mean (SE) | Mean (SE) | Mean (SE) | Cond B/p | |
| PCC | 6.367/0.020 | 43.997 (5.009) | 50.716 (4.388) | 50.652 (5.232) | 45.773 (4.583) | −0.322/0.034 |
| dlPFC | 4.674/0.042 | 24.611 (3.927) | 23.739 (3.670) | 24.975 (4.101) | 30.796 (3.833) | 0.267/0.031 |
| vmPFC-AL | 7.060/0.015 | 40.538 (2.064) | 32.588 (2.787) | 39.067 (2.155) | 42.385 (2.910) | 0.497/0.016 |
Having observed that there was an effect of prazosin on CBF, post-hoc analyses (2 × 2 repeated measures ANOVA and regression to examine effects of prazosin on PSC) were conducted using change in CBF as a covariate (Scan 2 minus Scan 1; Table 4). These analyses indicated that the sizes of effects and directionality of effects of prazosin on BOLD signal in PCC to high-threat were still not significant.
Table 4.
Effects of prazosin on PSC using change in CBF as a covariate.
| CBF Scan 2 minus Scan 1 as a covariate | Repeated Measures ANOVA |
Regression | ||||
|---|---|---|---|---|---|---|
| Placebo Scan 1 | Placebo Scan 2 | Prazosin Scan 1 | Prazosin Scan 2 | |||
| Fac*Cond F/p | Mean (SE) | Mean (SE) | Mean (SE) | Mean (SE) | Cond B/p | |
| PCC HT-LT | 1.845/0.190 | −0.075 (0.051) | −0.110 (0.078) | −0.222 (0.054) | −0.059 (0.082) | 0.042/0.756 |
| dlPFC HT-LT | 2.923/0.103 | −0.049 (0.030) | −0.035 (0.040) | −0.136 (0.032) | 0.005 (0.042) | 0.0184/0.499 |
| vmPFC-AL HT-LT | 2.186/0.155 | −1.61 (0.125) | −0.161 (0.218) | −0.383 (0.131) | 0.099 (0.229) | 0.296/0.255 |
4. Discussion
In summary, we observed several key findings. The first was that, in line with previous work in AUD (Yang et al., 2013) a conditioned stimulus predicting onset of an uncertain possibly painful stimulus (high-threat) was associated with greater deactivation in PCC and vmPFC relative to a low-threat stimulus. Greater deactivation to uncertain threat in right dlPFC was also observed in our sample. Second, prazosin was associated with a reduction in subjective levels of anticipatory anxiety during the task to the high-threat stimulus over three weeks of prazosin treatment. However, our original hypotheses that prazosin treatment would be associated with “normalization” of brain circuitry as represented by less deactivation to high threat relative to low threat was not supported. Third, and perhaps most importantly, we observed that lower levels of subjective anxiety to high-threat and greater deactivation to high threat relative to low threat in ventromedial prefrontal cortex prior to treatment initiation predicted a poor treatment response to prazosin relative to placebo over six weeks of treatment.
That high threat resulted in deactivation in PCC and vmPFC replicates findings from previous work using a similar task is notable (Yang et al., 2013). These regions are both considered to be key nodes of the default mode network (DMN) (Fox and Raichle, 2007) which tends to be deactivated during executive control, and during attention-demanding tasks, but activated during introspection and mind-wandering. Deactivation in DMN to high-threat could be due to engagement of top-down cognitive control processes, induced by preoccupation about the upcoming unconditioned stimulus. Previous work which included healthy controls showed that deactivation in these regions was unique to AUD (Yang et al., 2013; 2012). Other work has shown that greater deactivation to stressful stimuli (using a personalized stress script) in vmPFC is associated with greater risk of relapse in AUD (Seo et al., 2013). Much of the work in AUD and other substance use disorders (SUD) has shown greater activation throughout the brain to stressful stimuli compared to neutral stimuli in several prefrontal cortical regions (Elton et al., 2015; Wilcox et al., 2016), which contradicts with our results, but the design of many of these tasks involved exposure to aversive stimuli, which is quite different from our task, which elicited anticipatory anxiety. Deactivation in right DLPFC to high-threat stimuli, relative to low-threat was also observed, and similar findings have been observed in other work as well (Qin et al., 2009). However, this finding is challenging to interpret, as this was not observed in the previous study in AUD using an anticipatory anxiety task (Yang et al., 2013), and is somewhat contradictory in light of the fact that this region is usually considered part of the executive control network and usually activation in this region is observed during deactivation of the DMN (e.g. one would expect opposite patterns, not similar ones) (Fox and Raichle, 2007, Qin et al., 2009).
Greater deactivation to threat and other stress-inducing or aversive stimuli has also been observed in controls and other related psychiatric disorders. For example, individuals with post-traumatic stress disorder have greater deactivation to stressful relative to neutral stimuli in medial PFC (Ke et al., 2016) and greater deactivation in vmPFC during anticipation of unpredictable threatening compared to non-threatening stimuli (Grupe et al., 2019) (the latter of which was also related to hyperarousal). Several studies have been done with the Montreal Imaging Stress Task (MIST) task, and deactivation to stressful stimuli has been observed in limbic areas, vmPFC (medio-orbitofrontal cortex), and ACC in healthy controls (Albert et al., 2015; Dedovic et al., 2009), in several limbic areas in nicotine users (Dagher et al., 2009) and in limbic regions, striatum and some frontal areas in individuals with schizotypy (Soliman et al., 2011).
Norepinephrine is released into the PFC during stress (Nakane et al., 1994), which, when excessive, could enhance reward processing and dopamine release in the striatum (Nicniocaill and Gratton, 2007) and impair cognitive functioning mediated by the prefrontal cortex (Arnsten, 2009, Berridge and Spencer, 2016, Jett and Morilak, 2013, Zhang et al., 2013). Especially relevant to our study, excessive release could also cause elevations in anxiety and negative affect (Arnsten et al., 2015). All of these effects could have negative impacts on addictive behaviors (Nicniocaill and Gratton, 2007, Wilcox et al., 2014, Wilcox et al., 2016). Prazosin, an alpha 1 antagonist which shows some evidence of efficacy in AUD and other addictive disorders (Haass-Koffler et al., 2017; Kenna et al., 2016; Wilcox et al., 2018a) could be reducing drinking by any of these mechanisms. We hypothesized that prazosin would normalize the subjective experience of threat, and the magnitude of the brain's response to threatening stimuli in AUD. In line with our hypotheses, prazosin reduced subjective anxiety in anticipation of the high-threat stimulus. However, prazosin did not affect brain activity patterns. One possible explanation for this is that prazosin acts on a different circuit in AUD to reduce drinking than the one we were probing with the anticipatory anxiety task (either a brain region or network which is involved in processing stress or negative affect but which was not activated by this particular task such as the amygdala, or a region or network that is not involved in processing stress or negative affect at all, such as the cognitive control network, or the cue-reactivity network).
Brain activity patterns were, however, useful in predicting who would be more likely to respond to prazosin. Specifically, greater deactivation to high-threat relative to low threat predicted clinical deterioration on prazosin. The mechanism by which deactivation in this area may increase an individual's chance of doing poorly during prazosin treatment is unknown. One possibility is that prazosin causes deterioration in some other neural system which is protective against relapse. In those who don't have high levels of reactivity in the vmPFC (e.g. in individuals with less deactivation in that region), this negative effect of the medication is not excessively problematic, perhaps because their vmPFC is still functioning at an optimal level. However, those with high reactivity (those with greater deactivation to high threat relative to low threat), are more susceptible to this negative side effect. If this finding was replicated in future work, this may serve as a useful marker for identifying people more or less likely to benefit from prazosin for AUD relapse prevention (i.e. those with lower deactivation to high-threat relative to low-threat would be more likely to benefit from prazosin).
There were several limitations, the most important of which was this was a small sample which limited our power to detect effects. For the latent growth curve analyses, model fit statistics were poor, except for the model with vmPFC-AL, and further work in this area would benefit from larger sample sizes. Moreover, the sample was too small to adequately investigate additional subgroups. For example, exposure to childhood trauma (Grimm et al., 2014; Yang et al., 2015), or diastolic blood pressure (Kenna et al., 2016; Wilcox et al., 2018a) which could affect or mark (respectively) levels of baseline noradrenergic tone could have been explored as moderators of the relationship between clinical severity measures and brain activation and the effect of prazosin on brain circuitry. Also a larger sample, or including a group of healthy controls in future work could to try to look at hypotheses based on the “Inverted U” model (Cools and D'Esposito, 2011) may have improved our ability to interpret these findings. That said, our findings are promising, especially for the potential value of vmPFC-AL region as a moderator of treatment outcome to prazosin, and could be replicated in larger samples.
5. Conclusion
In conclusion, our findings are important in that we replicated previous work showing deactivation in PCC and vmPFC to high threat relative to low threat stimuli in AUD. Furthermore, prazosin reduced subjective anxiety to the high threat stimulus, but did not affect brain activation during an anticipatory anxiety task. Third, subjective levels of anxiety and brain activation in ventromedial prefrontal cortex predicted treatment outcomes in individuals with AUD undergoing treatment with prazosin during a clinical trial. The results raise interesting questions which could inform future research into identifying clinically useful moderators of treatment outcome on prazosin.
Funding
This study was funded by K23AA021156, from NIAAA.
CRediT authorship contribution statement
Claire E. Wilcox: Conceptualization, Data curation, Formal analysis, Funding acquisition, Investigation, Methodology, Project administration, Supervision, Validation, Writing - review & editing. Bryon Adinoff: Conceptualization, Funding acquisition, Investigation, Resources, Writing - review & editing. Joshua Clifford: Data curation, Formal analysis, Investigation, Methodology, Project administration, Supervision, Validation, Writing - review & editing. Josef Ling: Conceptualization, Data curation, Formal analysis, Investigation, Methodology, Writing - review & editing. Katie Witkiewitz: Formal analysis, Methodology, Writing - review & editing. Andrew R. Mayer: Conceptualization, Funding acquisition, Investigation, Methodology, Resources, Software, Writing - review & editing. Kylar M. Boggs: Writing - review & editing. Matthew Eck: Writing - review & editing. Michael Bogenschutz: Conceptualization, Funding acquisition, Supervision, Writing - review & editing.
Declaration of Competing Interest
None.
Footnotes
Supplementary material associated with this article can be found, in the online version, at doi:10.1016/j.nicl.2020.102162.
Appendix. Supplementary materials
References
- Albert K., Pruessner J., Newhouse P. Estradiol levels modulate brain activity and negative responses to psychosocial stress across the menstrual cycle. Psychoneuroendocrinology. 2015;59:14–24. doi: 10.1016/j.psyneuen.2015.04.022. [DOI] [PMC free article] [PubMed] [Google Scholar]
- Alvarez R.P., Chen G., Bodurka J., Kaplan R., Grillon C. Phasic and sustained fear in humans elicits distinct patterns of brain activity. Neuroimage. 2011;55:389–400. doi: 10.1016/j.neuroimage.2010.11.057. [DOI] [PMC free article] [PubMed] [Google Scholar]
- Anton R., O'Malley S., Ciraulo D., Cisler R., Couper D., Donovan D. Jama. 2006. Combined pharmacotherapies and behavioral interventions for alcohol dependence: the combine study: a randomized controlled trial; pp. 2003–2017. [DOI] [PubMed] [Google Scholar]
- Arnsten A.F. Stress signalling pathways that impair prefrontal cortex structure and function. Nat. Rev. Neurosci. 2009;10:410–422. doi: 10.1038/nrn2648. [DOI] [PMC free article] [PubMed] [Google Scholar]
- Arnsten A.F., Raskind M.A., Taylor F.B., Connor D.F. The effects of stress exposure on prefrontal cortex: translating basic research into successful treatments for post-traumatic stress disorder. Neurobiol. Stress. 2015;1:89–99. doi: 10.1016/j.ynstr.2014.10.002. [DOI] [PMC free article] [PubMed] [Google Scholar]
- Ashare R.L., Lerman C., Cao W., Falcone M., Bernardo L., Ruparel K. Nicotine withdrawal alters neural responses to psychosocial stress. Psychopharmacology (Berl.) 2016;233:2459–2467. doi: 10.1007/s00213-016-4299-5. [DOI] [PMC free article] [PubMed] [Google Scholar]
- Babor T.F., Higgins-Biddle J.C., Saunders J.B., Monteiro M.G. World Health Organization; Geneva: 2011. AUDIT The Alcohol Use Disorders Identification Test: Guidelines for Use in Primary Health Care. CH-1211. [Google Scholar]
- Berking M., Margraf M., Ebert D., Wupperman P., Hofmann S.G., Junghanns K. Deficits in emotion-regulation skills predict alcohol use during and after cognitive-behavioral therapy for alcohol dependence. J. Consult Clin. Psychol. 2011;79:307–318. doi: 10.1037/a0023421. [DOI] [PMC free article] [PubMed] [Google Scholar]
- Berridge C.W., Spencer R.C. Differential cognitive actions of norepinephrine a2 and a1 receptor signaling in the prefrontal cortex. Brain Res. 2016;1641:189–196. doi: 10.1016/j.brainres.2015.11.024. [DOI] [PMC free article] [PubMed] [Google Scholar]
- Blackford J.U., Avery S.N., Shelton R.C., Zald D.H. Amygdala temporal dynamics: temperamental differences in the timing of amygdala response to familiar and novel faces. BMC Neurosci. 2009;10:145. doi: 10.1186/1471-2202-10-145. [DOI] [PMC free article] [PubMed] [Google Scholar]
- Charney D.A., Zikos E., Gill K.J. Early recovery from alcohol dependence: factors that promote or impede abstinence. J. Subst. Abuse Treat. 2010;38:42–50. doi: 10.1016/j.jsat.2009.06.002. [DOI] [PubMed] [Google Scholar]
- Cools R., D’Esposito M. Inverted-U-shaped dopamine actions on human working memory and cognitive control. Biol. Psychiatry. 2011;69:e113–e125. doi: 10.1016/j.biopsych.2011.03.028. [DOI] [PMC free article] [PubMed] [Google Scholar]
- Cox R.W. AFNI: software for analysis and visualization of functional magnetic resonance neuroimages. Comput. Biomed. Res. 1996;29:162–173. doi: 10.1006/cbmr.1996.0014. [DOI] [PubMed] [Google Scholar]
- Dagher A., Tannenbaum B., Hayashi T., Pruessner J.C., McBride D. An acute psychosocial stress enhances the neural response to smoking cues. Brain Res. 2009;1293:40–48. doi: 10.1016/j.brainres.2009.07.048. [DOI] [PMC free article] [PubMed] [Google Scholar]
- Dale A.M., Fischl B., Sereno M.I. Cortical surface-based analysis. I. Segmentation and surface reconstruction. Neuroimage. 1999;9:179–194. doi: 10.1006/nimg.1998.0395. [DOI] [PubMed] [Google Scholar]
- Dedovic K., Rexroth M., Wolff E., Duchesne A., Scherling C., Beaudry T. Neural correlates of processing stressful information: an event-related fMRI study. Brain Res. 2009;1293:49–60. doi: 10.1016/j.brainres.2009.06.044. [DOI] [PubMed] [Google Scholar]
- Desikan R.S., Segonne F., Fischl B., Quinn B.T., Dickerson B.C., Blacker D. An automated labeling system for subdividing the human cerebral cortex on MRI scans into gyral based regions of interest. Neuroimage. 2006;31:968–980. doi: 10.1016/j.neuroimage.2006.01.021. [DOI] [PubMed] [Google Scholar]
- Elton A., Smitherman S., Young J., Kilts C.D. Effects of childhood maltreatment on the neural correlates of stress- and drug cue-induced cocaine craving. Addict. Biol. 2015;20:820–831. doi: 10.1111/adb.12162. [DOI] [PMC free article] [PubMed] [Google Scholar]
- Feenstra M.G., Klompmakers A., Figee M., Fluitman S., Vulink N., Westenberg H.G. Prazosin addition to fluvoxamine: a preclinical study and open clinical trial in OCD. Eur. Neuropsychopharmacol. 2016;26:310–319. doi: 10.1016/j.euroneuro.2015.12.008. [DOI] [PubMed] [Google Scholar]
- Forcehimes A.A., Tonigan J.S., Miller W.R., Kenna G.A., Baer J.S. Psychometrics of the drinker inventory of consequences (DrInC) Addict. Behav. 2007;32:1699–1704. doi: 10.1016/j.addbeh.2006.11.009. [DOI] [PubMed] [Google Scholar]
- Fox H.C., Anderson G.M., Tuit K., Hansen J., Kimmerling A., Siedlarz K.M. Prazosin effects on stress- and cue-induced craving and stress response in alcohol-dependent individuals: preliminary findings. Alcohol Clin. Exp. Res. 2012;36:351–360. doi: 10.1111/j.1530-0277.2011.01628.x. [DOI] [PMC free article] [PubMed] [Google Scholar]
- Fox M.D., Raichle M.E. Spontaneous fluctuations in brain activity observed with functional magnetic resonance imaging. Nat. Rev. Neurosci. 2007;8:700–711. doi: 10.1038/nrn2201. [DOI] [PubMed] [Google Scholar]
- Goldstein J.M., Seidman L.J., Makris N., Ahern T., O’Brien L.M., Caviness V.S., Jr. Hypothalamic abnormalities in schizophrenia: sex effects and genetic vulnerability. Biol. Psychiatry. 2007;61:935–945. doi: 10.1016/j.biopsych.2006.06.027. [DOI] [PubMed] [Google Scholar]
- Grimm S., Pestke K., Feeser M., Aust S., Weigand A., Wang J. Early life stress modulates oxytocin effects on limbic system during acute psychosocial stress. Soc. Cogn. Affect. Neurosci. 2014;9:1828–1835. doi: 10.1093/scan/nsu020. [DOI] [PMC free article] [PubMed] [Google Scholar]
- Grupe D.W., Imhoff-Smith T., Wielgosz J., Nitschke J.B., Davidson R.J. A common neural substrate for elevated PTSD symptoms and reduced pulse rate variability in combat-exposed veterans. Psychophysiology. 2019 doi: 10.1111/psyp.13352. e13352. [DOI] [PMC free article] [PubMed] [Google Scholar]
- Haass-Koffler C.L., Goodyear K., Zywiak W.H., Magill M., Eltinge S.E., Wallace P.M. Higher pretreatment blood pressure is associated with greater alcohol drinking reduction in alcohol-dependent individuals treated with doxazosin. Drug Alcohol Depend. 2017;177:23–28. doi: 10.1016/j.drugalcdep.2017.03.016. [DOI] [PMC free article] [PubMed] [Google Scholar]
- Haller S., Rodriguez C., Moser D., Toma S., Hofmeister J., Sinanaj I. Acute caffeine administration impact on working memory-related brain activation and functional connectivity in the elderly: a BOLD and perfusion MRI study. Neuroscience. 2013;250:364–371. doi: 10.1016/j.neuroscience.2013.07.021. [DOI] [PubMed] [Google Scholar]
- Jennings J.R., Muldoon M.F., Whyte E.M., Scanlon J., Price J., Meltzer C.C. Brain imaging findings predict blood pressure response to pharmacological treatment. Hypertension. 2008;52:1113–1119. doi: 10.1161/HYPERTENSIONAHA.108.120196. [DOI] [PMC free article] [PubMed] [Google Scholar]
- Jett J.D., Morilak D.A. Too much of a good thing: blocking noradrenergic facilitation in medial prefrontal cortex prevents the detrimental effects of chronic stress on cognition. Neuropsychopharmacology. 2013;38:585–595. doi: 10.1038/npp.2012.216. [DOI] [PMC free article] [PubMed] [Google Scholar]
- Ke J., Zhang L., Qi R., Li W., Hou C., Zhong Y. A longitudinal fMRI investigation in acute post-traumatic stress disorder (PTSD) Acta Radiol. 2016;57:1387–1395. doi: 10.1177/0284185115585848. [DOI] [PubMed] [Google Scholar]
- Kenna G.A., Haass-Koffler C.L., Zywiak W.H., Edwards S.M., Brickley M.B., Swift R.M. Role of the alpha1 blocker doxazosin in alcoholism: a proof-of-concept randomized controlled trial. Addict Biol. 2016;21:904–914. doi: 10.1111/adb.12275. [DOI] [PMC free article] [PubMed] [Google Scholar]
- Khalili-Mahani N., van Osch M.J., de Rooij M., Beckmann C.F., van Buchem M.A., Dahan A. Spatial heterogeneity of the relation between resting-state connectivity and blood flow: an important consideration for pharmacological studies. Hum. Brain Mapp. 2014;35:929–942. doi: 10.1002/hbm.22224. [DOI] [PMC free article] [PubMed] [Google Scholar]
- Kodl M.M., Fu S.S., Willenbring M.L., Gravely A., Nelson D.B., Joseph A.M. The impact of depressive symptoms on alcohol and cigarette consumption following treatment for alcohol and nicotine dependence. Alcohol Clin. Exp. Res. 2008;32:92–99. doi: 10.1111/j.1530-0277.2007.00556.x. [DOI] [PubMed] [Google Scholar]
- Koob G. A role for brain stress systems in addiction. Neuron. 2008;59:11–34. doi: 10.1016/j.neuron.2008.06.012. [DOI] [PMC free article] [PubMed] [Google Scholar]
- Kranzler H.R., Kadden R.M., Babor T.F., Tennen H., Rounsaville B.J. Validity of the SCID in substance abuse patients. Addiction. 1996;91:859–868. [PubMed] [Google Scholar]
- Liau J., Perthen J.E., Liu T.T. Caffeine reduces the activation extent and contrast-to-noise ratio of the functional cerebral blood flow response but not the BOLD response. Neuroimage. 2008;42:296–305. doi: 10.1016/j.neuroimage.2008.04.177. [DOI] [PMC free article] [PubMed] [Google Scholar]
- Look A.E., Flory J.D., Harvey P.D., Siever L.J. Psychometric properties of a short form of the Affective Lability Scale (ALS-18) Pers. Individ. Dif. 2010;49:187–191. doi: 10.1016/j.paid.2010.03.030. [DOI] [PMC free article] [PubMed] [Google Scholar]
- Makris N., Goldstein J.M., Kennedy D., Hodge S.M., Caviness V.S., Faraone S.V. Decreased volume of left and total anterior insular lobule in schizophrenia. Schizophr Res. 2006;83:155–171. doi: 10.1016/j.schres.2005.11.020. [DOI] [PubMed] [Google Scholar]
- Nakane H., Shimizu N., Hori T. Stress-induced norepinephrine release in the rat prefrontal cortex measured by microdialysis. Am. J. Physiol. 1994;267:R1559–R1566. doi: 10.1152/ajpregu.1994.267.6.R1559. [DOI] [PubMed] [Google Scholar]
- Nicniocaill B., Gratton A. Medial prefrontal cortical alpha1 adrenoreceptor modulation of the nucleus accumbens dopamine response to stress in Long-Evans rats. Psychopharmacology (Berl.) 2007;191:835–842. doi: 10.1007/s00213-007-0723-1. [DOI] [PubMed] [Google Scholar]
- O'Daly O.G., Trick L., Scaife J., Marshall J., Ball D., Phillips M.L. Withdrawal-associated increases and decreases in functional neural connectivity associated with altered emotional regulation in alcoholism. Neuropsychopharmacology. 2012;37:2267–2276. doi: 10.1038/npp.2012.77. [DOI] [PMC free article] [PubMed] [Google Scholar]
- Ogoh S., Tzeng Y.C., Lucas S.J., Galvin S.D., Ainslie P.N. Influence of baroreflex-mediated tachycardia on the regulation of dynamic cerebral perfusion during acute hypotension in humans. J. Physiol. 2010;588:365–371. doi: 10.1113/jphysiol.2009.180844. [DOI] [PMC free article] [PubMed] [Google Scholar]
- Qin S., Hermans E.J., van Marle H.J., Luo J., Fernandez G. Acute psychological stress reduces working memory-related activity in the dorsolateral prefrontal cortex. Biol. Psychiatry. 2009;66:25–32. doi: 10.1016/j.biopsych.2009.03.006. [DOI] [PubMed] [Google Scholar]
- Regier P.S., Monge Z.A., Franklin T.R., Wetherill R.R., Teitelman A., Jagannathan K. Emotional, physical and sexual abuse are associated with a heightened limbic response to cocaine cues. Addict. Biol. 2017;22:1768–1777. doi: 10.1111/adb.12445. [DOI] [PMC free article] [PubMed] [Google Scholar]
- Reus V.I., Fochtmann L.J., Bukstein O., Eyler A.E., Hilty D.M., Horvitz-Lennon M. The American psychiatric association practice guideline for the pharmacological treatment of patients with alcohol use disorder. Am. J. Psychiatry. 2018;175:86–90. doi: 10.1176/appi.ajp.2017.1750101. [DOI] [PubMed] [Google Scholar]
- Richter P., Werner J., Heerlein A., Kraus A., Sauer H. On the validity of the Beck Depression Inventory. A review. Psychopathology. 1998;31:160–168. doi: 10.1159/000066239. [DOI] [PubMed] [Google Scholar]
- Roepke S., Danker-Hopfe H., Repantis D., Behnia B., Bernard F., Hansen M.L. Doxazosin, an alpha-1-adrenergic-receptor antagonist, for nightmares in patients with posttraumatic stress disorder and/or borderline personality disorder: a chart review. Pharmacopsychiatry. 2017;50:26–31. doi: 10.1055/s-0042-107794. [DOI] [PubMed] [Google Scholar]
- Salmeron B.J., Stein E.A. Pharmacological applications of magnetic resonance imaging. Psychopharmacol. Bull. 2002;36:102–129. [PubMed] [Google Scholar]
- Schalet B.D., Pilkonis P.A., Yu L., Dodds N., Johnston K.L., Yount S. Clinical validity of promis depression, anxiety, and anger across diverse clinical samples. J. Clin. Epidemiol. 2016;73:119–127. doi: 10.1016/j.jclinepi.2015.08.036. [DOI] [PMC free article] [PubMed] [Google Scholar]
- Seo D., Lacadie C.M., Sinha R. Neural correlates and connectivity underlying stress-related impulse control difficulties in alcoholism. Alcohol Clin. Exp. Res. 2016;40:1884–1894. doi: 10.1111/acer.13166. [DOI] [PMC free article] [PubMed] [Google Scholar]
- Seo D., Lacadie C.M., Tuit K., Hong K.I., Constable R.T., Sinha R. Disrupted ventromedial prefrontal function, alcohol craving, and subsequent relapse risk. JAMA Psychiatry. 2013;70:727–739. doi: 10.1001/jamapsychiatry.2013.762. [DOI] [PMC free article] [PubMed] [Google Scholar]
- Simpson T.L., Malte C.A., Dietel B., Tell D., Pocock I., Lyons R. A pilot trial of prazosin, an alpha-1 adrenergic antagonist, for comorbid alcohol dependence and posttraumatic stress disorder. Alcohol Clin. Exp. Res. 2015;39:808–817. doi: 10.1111/acer.12703. [DOI] [PMC free article] [PubMed] [Google Scholar]
- Simpson T.L., Saxon A.J., Meredith C.W., Malte C.A., McBride B., Ferguson L.C. A pilot trial of the alpha-1 adrenergic antagonist, prazosin, for alcohol dependence. Alcohol Clin. Exp. Res. 2009;33:255–263. doi: 10.1111/j.1530-0277.2008.00807.x. [DOI] [PubMed] [Google Scholar]
- Singh B., Hughes A.J., Mehta G., Erwin P.J., Parsaik A.K. Efficacy of prazosin in posttraumatic stress disorder: a systematic review and meta-analysis. Prim. Care Companion CNS Disord. 2016;18 doi: 10.4088/PCC.16r01943. [DOI] [PubMed] [Google Scholar]
- Sinha R. How does stress lead to risk of alcohol relapse? Alcohol Res. 2012;34:432–440. doi: 10.35946/arcr.v34.4.07. [DOI] [PMC free article] [PubMed] [Google Scholar]
- Sobell L.C., Sobell M.B., Litten R.Z., Allen J.P. Measuring alcohol consumption: Psychosocial and biochemical methods. 1992. Timeline follow-back: a technique for assessing self-reported alcohol consumption; pp. 41–72. [Google Scholar]
- Soliman A., O’Driscoll G.A., Pruessner J., Joober R., Ditto B., Streicker E. Limbic response to psychosocial stress in schizotypy: a functional magnetic resonance imaging study. Schizophr. Res. 2011;131:184–191. doi: 10.1016/j.schres.2011.05.016. [DOI] [PubMed] [Google Scholar]
- Spielberger C.D., Gorsuch R.L. and Suchene R.E. (1970). Manual for the state-trait anxiety inventory. Consulting Psychologists Press: Palo Alto, CA.
- Sullivan J., Sykora K., Schneiderman J., Naranjo C., Sellers E. Assessment of alcohol withdrawal: the revised clinical institute withdrawal assessment for alcohol scale (CIWA-Ar) Br. J. Addict. 1989;84:1353–1357. doi: 10.1111/j.1360-0443.1989.tb00737.x. [DOI] [PubMed] [Google Scholar]
- Viviani R., Abler B., Seeringer A., Stingl J.C. Effect of paroxetine and bupropion on human resting brain perfusion: an arterial spin labeling study. Neuroimage. 2012;61:773–779. doi: 10.1016/j.neuroimage.2012.03.014. [DOI] [PubMed] [Google Scholar]
- Waldstein S.R., Lefkowitz D.M., Siegel E.L., Rosenberger W.F., Spencer R.J., Tankard C.F. Reduced cerebral blood flow in older men with higher levels of blood pressure. J. Hypertens. 2010;28:993–998. doi: 10.1097/hjh.0b013e328335c34f. [DOI] [PMC free article] [PubMed] [Google Scholar]
- Wang J., Licht D., Jahng G., Liu C., Rubin J., Haselgrove J. Pediatric perfusion imaging using pulsed arterial spin labeling. J. Magn. Reson. Imag. 2003:404–413. doi: 10.1002/jmri.10372. [DOI] [PubMed] [Google Scholar]
- Wang Z.X., Zhang J.X., Wu Q.L., Liu N., Hu X.P., Chan R.C. Alterations in the processing of non-drug-related affective stimuli in abstinent heroin addicts. Neuroimage. 2010;49:971–976. doi: 10.1016/j.neuroimage.2009.08.020. [DOI] [PubMed] [Google Scholar]
- Wilcox C.E., Clifford J., Ling J., Mayer A.R., Bigelow R., Bogenschutz M.P. Stroop-related cerebellar and temporal activation is correlated with negative affect and alcohol use disorder severity. Brain Imag. Behav. 2019 doi: 10.1007/s11682-019-00126-3. [DOI] [PMC free article] [PubMed] [Google Scholar]
- Wilcox C.E., Dekonenko C.J., Mayer A.R., Bogenschutz M.P., Turner J.A. Cognitive control in alcohol use disorder: deficits and clinical relevance. Rev. Neurosci. 2014:1–24. doi: 10.1515/revneuro-2013-0054. [DOI] [PMC free article] [PubMed] [Google Scholar]
- Wilcox C.E., Pommy J.M., Adinoff B. Neural circuitry of impaired emotion regulation in substance use disorders. Am. J. Psychiatry. 2016 doi: 10.1176/appi.ajp.2015.15060710. [DOI] [PMC free article] [PubMed] [Google Scholar]
- Wilcox C.E., Tonigan J.S. Changes in depression mediate the effects of AA attendance on alcohol use outcomes. Am. J. Drug Alcohol Abuse. 2016;44:103–112. doi: 10.1080/00952990.2016.1249283. [DOI] [PMC free article] [PubMed] [Google Scholar]
- Wilcox C.E., Tonigan J.S., Bogenschutz M.P., Clifford J., Bigelow R., Simpson T. A randomized, placebo-controlled, clinical trial of prazosin for the treatment of alcohol use disorder. J. Addict. Med. 2018;12:339–345. doi: 10.1097/ADM.0000000000000413. [DOI] [PMC free article] [PubMed] [Google Scholar]
- Wilcox C.E., Tonigan J.S., Bogenschutz M.P., Clifford J., Bigelow R., Simpson T.L. A randomized, placebo-controlled, clinical trial of prazosin for the treatment of alcohol use disorder. J. Addict. Med. 2018;12:339–345. doi: 10.1097/ADM.0000000000000413. [DOI] [PMC free article] [PubMed] [Google Scholar]
- Wu W.C., Lien S.H., Chang J.H., Yang S.C. Caffeine alters resting-state functional connectivity measured by blood oxygenation level-dependent MRI. NMR Biomed. 2014;27:444–452. doi: 10.1002/nbm.3080. [DOI] [PMC free article] [PubMed] [Google Scholar]
- Yang H., Devous M.D., Briggs R.W., Spence J.S., Xiao H., Kreyling N. Altered neural processing of threat in alcohol-dependent men. Alcohol Clin. Exp. Res. 2013;37:2029–2038. doi: 10.1111/acer.12187. [DOI] [PMC free article] [PubMed] [Google Scholar]
- Yang H., Spence J.S., Briggs R.W., Rao U., North C., Devous M.D., Sr. Interaction between early life stress and alcohol dependence on neural stress reactivity. Addict. Biol. 2015;20:523–533. doi: 10.1111/adb.12135. [DOI] [PMC free article] [PubMed] [Google Scholar]
- Yang H., Spence J.S., Devous M.D., Sr., Briggs R.W., Goyal A., Xiao H. Striatal-limbic activation is associated with intensity of anticipatory anxiety. Psychiatry Res. 2012;204:123–131. doi: 10.1016/j.pscychresns.2012.10.001. [DOI] [PMC free article] [PubMed] [Google Scholar]
- Zhang Z., Cordeiro Matos S., Jego S., Adamantidis A., Seguela P. Norepinephrine drives persistent activity in prefrontal cortex via synergistic alpha1 and alpha2 adrenoceptors. PLoS ONE. 2013;8:e66122. doi: 10.1371/journal.pone.0066122. [DOI] [PMC free article] [PubMed] [Google Scholar]
Associated Data
This section collects any data citations, data availability statements, or supplementary materials included in this article.