

This study examines the link between implementation of Strategies to Enhance Practice (STEPs) and outcomes. Twenty after-school programs (ASPs) participated in an intervention to increase children’s accumulation of 30 minutes/day of moderate to vigorous physical activity (MVPA) and quality of snacks served during program time. Outcomes were measured via accelerometer (MVPA) and direct observation (snacks). STEPs implementation data were collected via document review and direct observation. Based on implementation data, ASPs were divided into high/low implementers. Differences between high/low implementers’ change in percentage of boys accumulating 30 minutes/day of MVPA were observed. There was no difference between high/low implementers for girls. Days fruits and/or vegetables and water were served increased in the high/low implementation groups, while desserts and sugar-sweetened beverages decreased. Effect sizes (ES) for the difference in changes between the high and low group ranged from low (ES = 0.16) to high (ES = 0.97). Higher levels of implementation led to increased MVPA for boys, whereas girls MVPA benefited from the intervention regardless of high/low implementation. ESs of the difference between high/low implementers indicate that increased implementation of STEPs increases days healthier snacks are served. Programs in the high-implementation group implemented a variety of STEPs strategies, suggesting local adoption/adaptation is key to implementation.
INTRODUCTION
Implementation of health promotion programs varies in school and after-school settings (Dusenbury, Brannigan, Falco, & Hansen, 2003; McGraw et al., 2000; Weaver, Beets, Hutto, et al., 2015). Intervention complexity (Viadro, Earp, & Altpeter, 1997), motivation and skill of implementers (McGraw et al., 1996), community-level factors, provider characteristics, and organizational capacity (Durlak & DuPre., 2008) contribute to this variability. It is essential, therefore, to measure the implementation of key intervention components through process evaluation (Ballew, Brownson, Haire-Joshu, Heath, & Kreuter, 2010). Implementation information allows for the identification of who (i.e., sites, schools) is adopting which and how much of each intervention component. Although process evaluation is essential, an often overlooked aspect is the linkage of implementation data to intervention outcomes (Gray, Contento, & Koch, 2015; McKenzie et al., 1994; Saunders, Ward, Felton, Dowda, & Pate, 2006). Consequently, not only is process evaluation emphasized as a key component of public health interventions (Durlak & DuPre, 2008; Dusenbury et al., 2003), its linkage to outcomes is increasingly common (Gray et al., 2015; McKenzie et al., 1994; Saunders et al., 2006).
Strategies to Enhance Practice (STEPs) for Healthy Eating and Physical Activity (HEPA) is a multicomponent, adaptable framework for after-school programs (ASPs) that guides the modification of program components (e.g., creating a quality snack menu/activity schedule, scheduling sufficient activity time, training staff to model and promote HEPA) to increase children’s physical activity and the quality of foods and beverages served (Beets et al., 2014). The STEPs framework is similar to Maslow’s (1943) hierarchy of needs in psychology where basic physiological needs must be met prior to achieving higher order needs like self-actualization. When this theoretical lens is applied to the ASP setting, program components are divided into foundational and quality components. Foundational components are essential to program operation and must be addressed to ensure that an ASP is able to function properly. Once foundational components are in place, resources can be devoted to addressing quality components related to HEPA. For example, programs require a schedule of programming and daily snack menu to function. When ASPs fail to create or follow a daily schedule or snack menu, site leaders and staff must devote their resources to occupying children’s attention and providing a snack during the ASP. This leaves little to no time for addressing issues related to the quality of the HEPA environment such as modeling and encouraging healthy behaviors. A detailed description of the STEPs framework can be found in Beets et al. (2014).
A recent multiyear intervention used STEPs collaboratively with ASP staff to target ASP components for modification (Beets et al., 2014). It was hypothesized that modifying foundational program components, followed by quality components via the STEPs framework, would lead to increases in the percentage of children accumulating 30 minutes of moderate to vigorous physical activity (MVPA) during program time (California Department of Education, 2009) and in the number of days/week a fruit or vegetable and water were served, and reduce the number of days a sugar-sweetened food or beverage and artificially flavored foods were served (Wiecha, Hall, Gannett, & Roth, 2011). This hypothesis was supported as programs randomized to implement STEPs successfully increased the quality of snacks served (Beets, Weaver, Turner-McGrievy, Huberty, Ward, Freedman, et al., 2015) and the percentage of boys and girls accumulating 30 minutes/day of MVPA (Beets, Weaver, Turner-McGrievy, Huberty, Ward, Pate, et al., 2015).
Process evaluation is essential therefore to understand how and why STEPs successfully increased HEPA in participating ASPs. Process evaluations of HEPA interventions in ASPs are limited. Previous interventions have focused on the adoption of fixed program components that change the structure of the program, such as adopting a physical activity curricula. Program leaders and staff have indicated that this is challenging as staff do not have the skills to deliver curricula, and children do not like the games (Hastmann, Bopp, Fallon, Rosenkranz, & Dzewaltowski, 2013; Sharpe, Forrester, & Mandigo, 2011). Furthermore, ASP leaders have indicated that incorporating healthy snacks into snack menus is challenging because serving healthy snacks is not a priority of ASPs, and there is a perceived additional cost (Hastmann et al., 2013; Mozaffarian et al., 2010). Only one study to date has evaluated an intervention to increase HEPA in ASPs across multiple years. This study found that gains made in the first year of intervention declined during the second year (Dzewaltowski et al., 2010). These declines could be attributable to high rates of staff turnover from year to year, a barrier to implementing HEPA interventions in ASPs (Hastmann et al., 2013; Kelder et al., 2005). Furthermore, activity levels of children in control programs varied greatly from year to year. Therefore, it is essential for interventions in ASPs to monitor implementation beyond one year to ensure that strategies are sustainable over time. The first year of process evaluation of STEPs showed that programs successfully implemented STEPs and that increasing implementation led to increased MVPA (Weaver, Beets, Hutto, et al., 2015). However, it is unclear if these gains can be maintained over multiple years. Also, the study was designed with a delayed treatment group where 10 programs received STEPs support for 2 years and 10 programs received support for 1 year only. This design allows for exploration of a second year of implementation of STEPs effects, as well as the examination of the STEPs on a second group of programs (i.e., the delayed group).
The purpose of this study, therefore, was to (1) assess implementation of foundational and quality STEPs at the program level across the 20 participating programs, (2) determine if an extra year of support affects implementation of STEPs, and (3) explore the relationship between implementation of STEPs and primary study outcomes during the final year of intervention.
METHOD
Intervention
Making HEPA Policy Practice was a 20-site, delayed-treatment, group randomized controlled trial (Beets, Weaver, Turner-McGrievy, Huberty, Ward, Freedman, et al., 2015; Beets et al., 2014; Beets, Weaver, Turner-McGrievy, Huberty, Ward, Pate, et al., 2015). ASPs were recruited in the fall of 2012 to participate in an intervention (August 2013-May 2015) to increase children’s MVPA and the quality of snacks served during program time. The intervention was founded on STEPs (Beets et al., 2014).
The STEPs process begins by directing programs to address foundational elements (i.e., having a detailed program schedule, daily snack menu), then, once foundational items are in place, programs receive support to implement the quality elements, such as staff professional development training for physical activity. Foundational and quality elements are presented in Appendix A and described in detail elsewhere (Beets et al., 2014).
Data Collection Procedures and Intervention Schedule
Process and outcome data were collected in the spring of each year from 2013 to 2015 (Beets, Weaver, Turner-McGrievy, Huberty, Ward, Freedman, et al., 2015; Beets, Weaver, Turner-McGrievy, Huberty, Ward, Pate, et al., 2015; Weaver, Beets, Hutto, et al., 2015). Following data collection in spring 2013, all programs were randomized into the immediate (n = 10) or delayed (n = 10) group. The immediate group received support based on the STEPs framework in Years 2 and 3 (2 years of intervention), while the delayed group continued routine practice for an additional year and received support in Year 3 (1 year of intervention).
Process Data Collection
Data were collected concurrently with outcome data during each measurement period via document review, observation, and the System for Observing Staff Promotion of Activity and Nutrition (Weaver, Beets, Huberty, et al., 2015; see Appendix A).
Outcome Data Collection
Children’s data on accelerometer-derived MVPA and snacks served were collected during each measurement period (spring 2013-2015) via established protocols (Beets, Tilley, Kim, & Webster, 2011; Beets, Weaver, Turner-McGrievy, Huberty, Ward, Freedman, et al., 2015; Mozaffarian et al., 2010). A trained observer recorded snack options served on each observation day. Snack options were categorized as: fruit or vegetables, water, artificially flavored foods, desserts, and sugar-sweetened beverages (Beets et al., 2011; Beets, Weaver, Turner-McGrievy, Huberty, Ward, Freedman, et al., 2015).
Children’s physical activity was measured via an ActiGraph GT3X+ accelerometer (Shalimar, FL; Beets, Beighle, Bottai, Rooney, & Tilley, 2012; Beets et al., in press; Beets, Wallner, & Beighle, 2010). Children were fitted with an accelerometer at the beginning of the program day and returned the accelerometer prior to leaving. Accelerometers were affixed to children’s waist via an elastic belt. Children participated in their normally scheduled activities throughout the program day. Accelerometer data was distilled using 5-second epochs (Bailey et al., 1995; Baquet, Stratton, Van Praagh, & Berthoin, 2007; Vale, Santos, Silva, Soares-Miranda, & Mota, 2009) and cut-point thresholds were applied to estimate activity intensity levels (Evenson, Catellier, Gill, Ondrak, & McMurray, 2008).
STEPs Implementation Score Creation
Foundational and quality of HEPA implementation scores, as outlined in Appendix A, were assigned to all ASPs in three stages (Weaver, Beets, Hutto, et al., 2015).
In the first stage, programs were assigned a score and color code for each STEPs component by implementation level. Programs were assigned red (implementation score = 0) for no implementation, yellow for partial implementation (implementation score = 1), and green for full implementation (implementation score = 2). All ASPs were assigned an implementation score for each of the 16 physical activity and 10 healthy eating STEPs components, every measurement year.
In Stage 2, an implementation score for each of the foundational and quality components was created. This was accomplished by summing baseline (spring 2013—immediate group, spring—2014 delayed group), outcome (spring 2015), and implementation change score (change = outcome score – baseline score). The possible range of implementation scores for any individual STEPs component was 0 to 4.
In the third stage, each program received an overall implementation score for HEPA, separately, by summing all STEPs components’ implementation scores from Stage 2. For physical activity, the possible range of scores for a single program was 0 to 64. For healthy eating, the possible range of scores was 0 to 40.
Including baseline and outcome scores exclusively created comparable overall implementation scores across the delayed and immediate groups. The overall implementation score was unbiased toward programs that had high or low implementation scores prior to receiving the intervention because change from baseline to outcome was included.
Following the creation of overall implementation scores, programs were classified as high or low implementers. Overall implementation scores were inspected to identify natural breaks in the data (McNeil, Wilson, Siever, Ronca, & Mah, 2009; Saunders et al., 2006). Since HEPA outcomes are not related to one another, (i.e., a program could serve healthy snacks and not provide children 30 minutes/day of MVPA), this process was done separately for HEPA.
Statistical Analysis
All analyses were completed at the program level (n = 20). For physical activity, the relationship between high and low implementation and the change in percentage of children accumulating 30 minutes of MVPA from baseline to outcome was evaluated using two-sample t tests adjusting for unequal variances. Models were estimated separately for boys and girls. Similarly, for healthy eating, two-sample t tests adjusting for unequal variances tested the relationship of high and low implementers to the number of days fruits or vegetables, water, artificially flavored foods, desserts, or sugar-sweetened beverages were served. Because of the small sample size, Hedges’s g was calculated for the difference in change between high and low implementation using comprehensive meta-analysis for both HEPA outcomes (Durlak, 2009). An effect size below 0.50 was considered small, between 0.51 and 0.80 medium, and above 0.81 large (Durlak, 2009).
RESULTS
Implementation of STEPs Across All Programs
Programs’ implementation of STEPs are presented in Figure 1. Overall implementation scores ranged from 22 to 46, for physical activity. In both the immediate and delayed programs, green and yellow STEPs components increased from baseline to outcome by 8.1 percentage points (33.4%—baseline vs. 41.5%—outcome) and 6.3 percentage points (30.0%—baseline vs. 36.3%—outcome), respectively. This increase corresponded with a 14.4 percentage point decrease (36.6%—baseline vs. 22.2%—outcome) of red elements. For healthy eating, overall implementation scores ranged from 12 to 28. There was a 17.8 percentage point increase (16.1%—baseline vs. 33.9%—outcome) of green elements from baseline to outcome for both the immediate and delayed programs, while there was a 2.8 percentage point (52.8%—baseline vs. 50.0%—outcome) and 15.0 percentage point (31.1%—baseline vs. 16.1%—outcome) decrease of yellow and red elements, respectively (see Figure 2).
FIGURE 1. STEPs Physical Activity Implementation Scores Graphically Represented.
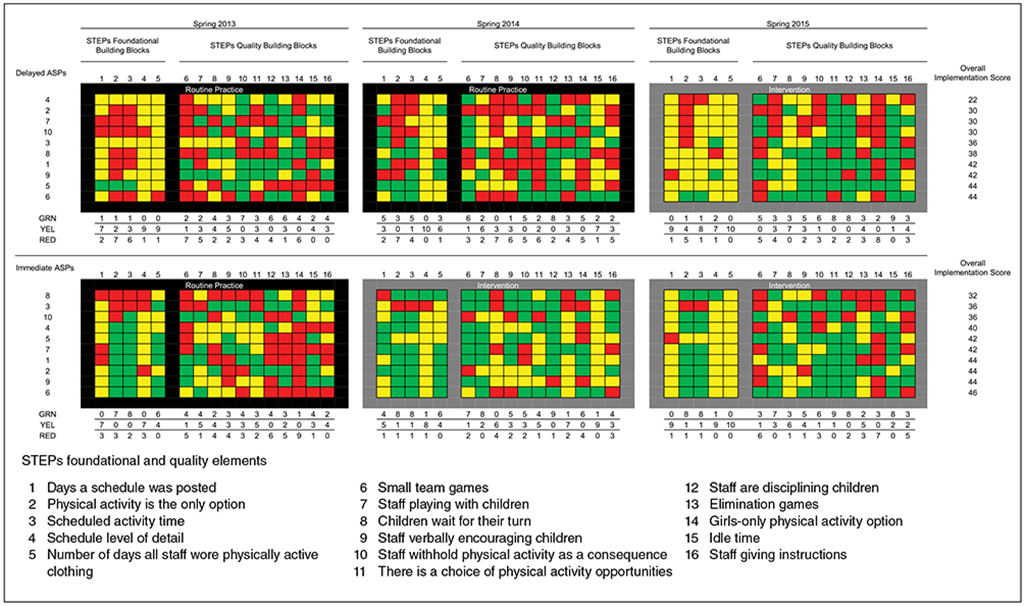
NOTE: STEPs = Strategies to Enhance Practice; ASPs = after-school programs; GRN = green; YEL = yellow; RED = red.
FIGURE 2. STEPs Healthy Eating Implementation Scores Graphically Represented.
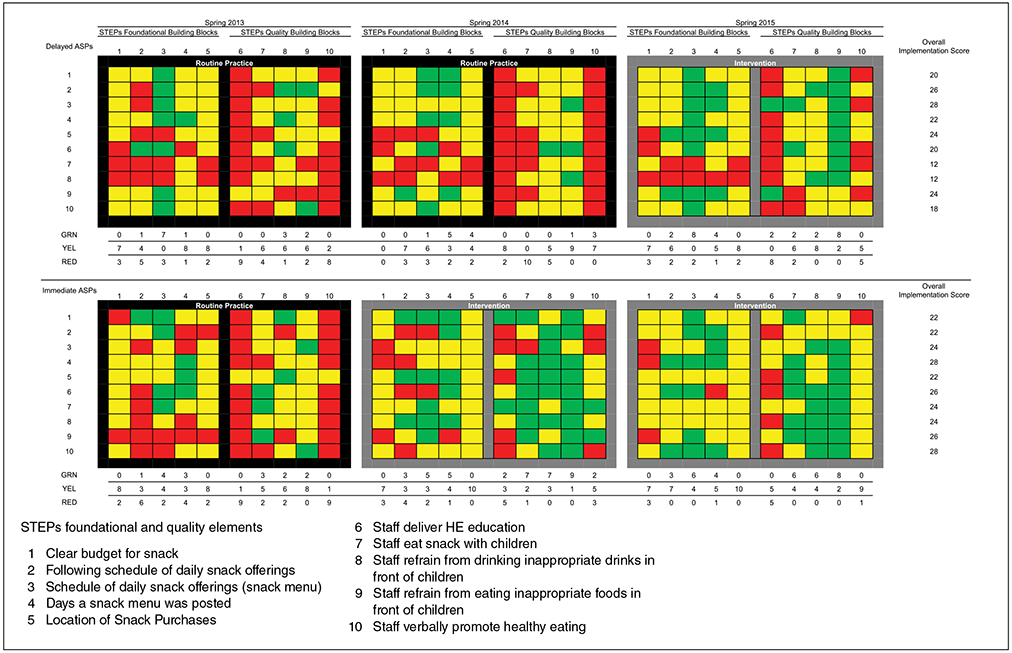
NOTE: STEPs = Strategies to Enhance Practice; ASPs = after-school programs; HE = healthy eating; GRN = green; YEL = yellow; RED = red.
Implementation of STEPs for Immediate and Delayed Groups
For the immediate group, full implementation (green) of the physical activity elements increased by 11.9 percentage points (34.4%—baseline vs. 46.3%—outcome) from baseline to outcome, while partial implementation (yellow) increased by 4.4 percentage points (30.0%—baseline vs. 34.4%—outcome). The delayed group saw similar but smaller changes in implementation from baseline to outcome. Full implementation of physical activity elements increased by 4.4 percentage points (32.5%—baseline vs. 36.9%—outcome), while partial implementation increased by 8.1 percentage points (30.0%—baseline vs. 38.1%—outcome).
Similar patterns were observed for healthy eating from baseline to outcome in the immediate and delayed groups. The immediate group increased full implementation by 20.0 percentage points (16.7%—baseline vs. 36.7%—outcome), and partial implementation by 2.2 percentage points (51.1%—baseline vs. 53.3%—outcome). The delayed group increased full implementation by 15.6 percentage points (15.6%—baseline vs. 31.1%—outcome) while decreasing both partial and no implementation by 7.8 percentage points (54.4%—baseline vs. 46.6%—outcome and 30.0%—baseline vs. 22.2%—outcome, respectively).
STEPs Relationship to HEPA Outcomes
For physical activity, visual inspection of the data determined that high implementers had an overall implementation score of ≥40 (n = 11). High implementers were determined to have an overall implementation score ≥22 for healthy eating. The relationship of high and low implementers to HEPA outcomes is presented in Table 1. High implementers of STEPs for physical activity increased the percentage of boys accumulating 30 minutes of MVPA by 11.0 percentage points (31.2% to 42.2%) from baseline to outcome. Boys in low implementing programs regressed by 1.6 percentage points (28.3% to 26.8%) from baseline to outcome. This represented a statistically significant difference in the change of boys meeting the 30 minutes/day of MVPA guideline. The corresponding effect size for the difference between groups was g = 0.97. For girls, both the high and low implementers increased the percentage of girls accumulating 30 minutes/day of MVPA (low—5.3% increase, high—3.6% increase). The difference was not statistically significant and the effect size was g = 0.16.
TABLE 1.
Changes in Healthy Eating and Physical Activity Outcomes Over Time by High- and Low-Implementation Groups
| Healthy Eating Outcomes |
Measurement Period |
Low Implementation, n = 8 |
High Implementation, n = 12 |
Difference in Change Between High and Low Group |
95% Confidence Interval |
Effect Sizec |
95% Confidence Interval |
||
|---|---|---|---|---|---|---|---|---|---|
| M (SD) | Δ | M (SD) | Δ | ||||||
| Fruit or vegetablea (e.g., fresh, frozen, or dried) | Baseline | 0.8 (1.4) | 1.4 | 0.9 (1.6) | 2.7 | 1.3 | [−0.6, 3.1] | 0.68 | [−0.20, 1.56] |
| Outcome | 2.1 (2.2) | 3.6 (1.7) | |||||||
| Watera (e.g., plain unflavored) | Baseline | 2.8 (1.6) | 0.4 | 2.9 (2.2) | 2.1 | 1.7 | [0.1, 3.4] | 0.79 | [−0.10, 1.68] |
| Outcome | 3.1 (2.1) | 5.0 (0.0) | |||||||
| Artificially flavored foodsa (e.g., Doritos®, Cheez-its®) | Baseline | 2.1 (1.1) | 0.0 | 2.6 (2.0) | −0.6 | −0.6 | [−2.0, 1.0] | −0.34 | [−1.21, 0.52] |
| Outcome | 2.1 (1.3) | 2.0 (1.6) | |||||||
| Dessertsa (e.g., Trix® yogurt, cookies, Pop-Tarts, chocolate, frozen treats) | Baseline | 2.0 (1.7) | −0.4 | 3.5 (1.4) | −2.3 | −1.9 | [−4.0, 0.1] | −0.87 | [−1.76, 0.03] |
| Outcome | 1.6 (1.4) | 1.1 (1.5) | |||||||
| Sugar-sweetened beveragesa (e.g., soda, powered drink mixed, sport drinks, chocolate milk) | Baseline | 1.5 (1.7) | −0.9 | 1.9 (2.1) | −1.9 | −1.0 | [−2.8, 0.8] | −0.48 | [−1.35, 0.39] |
| Outcome | 0.6 (0.9) | 0.0 (0.0) | |||||||
| Physical Activity Outcomes |
Measurement Period |
Low Implementation, n = 9 |
High Implementation, n = 11 |
Difference in Change Between High and Low Group |
95% Confidence Interval |
Effect Sizec |
95% Confidence Interval |
||
| M (SD) | Δ | M (SD) | Δ | ||||||
| Boys Accumulating 30 min/day of MVPAb | Base | 28.3 (14.1) | −1.6 | 31.2 (11.4) | 11.0 | 12.6 | [1.1, 24.0] | 0.97 | [0.08, 1.87] |
| Outcome | 26.8 (13.9) | 42.2 (13.5) | |||||||
| Girls Accumulating 30 min/day of MVPAb | Base | 13.6 (8.3) | 5.3 | 15.9 (8.9) | 3.6 | −1.7 | [−11.8, 8.5] | −0.16 | [0.69, −1.00] |
| Outcome | 18.9 (13.8) | 19.5 (9.8) | |||||||
NOTE: MVPA = moderate to vigorous physical activity.
Number of days per week item served.
Percentage of children accumulating 30 minutes/day of MVPA.
Hedge’s g, effect size adjusted for small sample sizes.
For healthy eating, both high and low implementers experienced changes in the desired direction for all outcomes except artificially flavored foods (no change in number of days for low implementers). In all cases the changes observed for the high implementers were larger than low implementers. However, only one of the differences between high and low implementers reached statistical significance: difference in change of days water was served (1.7 days more in high implementers). Effect sizes ranged from small (0.34 for artificially flavored foods), to medium (0.48 for sugar-sweetened beverages, 0.68 for fruits and vegetables, and 0.79 for water), to large (0.87 for desserts).
DISCUSSION
This article reports the implementation of STEPs and the relationship between implementation and study outcomes during all 3 years of a group randomized controlled trial. This article is among the first to report multiple years of evaluation for an intervention to increase children’s HEPA during ASP time. These findings suggest that targeted support for ASPs and a multicomponent, adaptable intervention are essential elements for achieving HEPA goals in ASPs.
Implementation of STEPs Across All Programs
Findings indicate that targeted support for ASPs to implement STEPs can lead to changes in routine practice. This is evidenced by the increase of green and the decrease of red elements at outcome in both the immediate and delayed groups. Similar to first-year findings (Weaver, Beets, Hutto, et al., 2015), the most common fully implemented STEPs elements were quality elements (see Table 2). This is contrary to how STEPs is conceptualized. STEPs stipulates that programs first put foundational components into place and then work to modify quality elements. Therefore, there may be no clear sequencing to how STEPs must be implemented for programs to experience improvements in HEPA. Furthermore, the current results are important for practice as they suggest that encouraging programs to make improvements where they feel most confident, or where they have the capacity to do so, may be more important than imposing an a priori order to implementation. This could potentially influence acceptability of STEPs and similar programs.
TABLE 2.
Most Commonly Implemented STEPs Elements
| Most Common Healthy Eating Elements |
Most Common Physical Activity Elements |
||
|---|---|---|---|
| Baseline | Outcome | Baseline | Outcome |
| Green | |||
| 1. Days a snack menu was posted [n = 8) | Staff refrain from eating inappropriate foods in front of children (n = 16) | 1. Scheduled activity time [n = 13) | There is a choice of physical activity opportunities [n = 17) |
| 2. Schedule of daily snack offerings (snack menu; n = 5) | Schedule of daily snack offerings (snack menu; n = 14) | 2. Staff are disciplining children [n = 12) | Idle time [n = 17) |
| 3. Location of snack purchases [n = 4) | Days a snack menu was posted; staff refrain from drinking inappropriate drinks in front of children [n = 8) | 3. Physical activity is the only option [n = 10) | Staff are disciplining children (n = 16) |
| Yellow | |||
| 1. Staff refrain from eating inappropriate foods in front of children [n = 17] | Location of snack purchases [n = 18) | 1. Schedule level of detail [n = 17) | Number of days all staff wore physically active clothing (n = 20) |
| 2. Location of Snack Purchases [n = 12) | Clear budget for snack [n = 14) | 2. Staff playing with children [n = 11) | Days a schedule was posted (n = 18) |
| 3. Staff refrain from drinking inappropriate drinks in front of children (n = 11) | Staff verbally promote healthy eating (n = 14) | 3. Days a schedule was posted; number of days all staff wore physically active clothing; idle time [n = 10) | Schedule level of detail (n = 16) |
| Red | |||
| 1. Staff eat snack with children [n = 12) | Staff deliver HE education [n = 13) | 1. Girls-only physical activity option [n = 14) | Girls-only physical activity option [n = 15) |
| 2. Staff deliver HE education [n = 11) | Clear budget for snack [n = 6) | 2. Children wait for their turn [n = 11) | Small team games (n = 11) |
| 3. Following schedule of daily snack offerings (n = 9) | Staff verbally promote healthy eating [n = 6) | 3. Physical activity is the only option; staff verbally encouraging children [n = 10) | Staff giving instructions (n = 8) |
NOTE: STEPs = Strategies to Enhance Practice; HE = healthy eating.
It is unclear why programs more successfully implemented STEPs quality elements than foundational elements. One explanation may be that foundational elements are structural components, whereas quality elements are mostly staff behaviors. While programs struggle to change structural components, like program curricula (Hastmann et al., 2013; Sharpe et al., 2011), research has shown that staff behaviors can be modified quickly through training (Weaver et al., 2014). This finding also indicates that quality components may be more influential for immediate program change than structural components. However, structural components may be more relevant to sustaining change over time especially in the presence of staff turnover, which is common in ASPs (Hastmann et al., 2013; Kelder et al., 2005). Therefore, programs interested in promoting HEPA not only should offer HEPA promotion training for staff to experience immediate changes in HEPA but also must invest in modifying foundational components like creating a program schedule or weekly snack menu if those changes are to be sustained over time.
Implementation of STEPs for the Immediate Group: Did an Extra Year of Support Increase Implementation
One of the key findings of this study is that programs in the immediate group experienced large increases in implementation of STEPs following the first year of intervention, but an extra year of support did not appear to increase implementation (see Figures 1 and 2 and Appendix B). Programs in the immediate group actually regressed toward baseline during the second year of intervention. This regression may be due to programs choosing to implement quality STEPs components dealing with staff skills and neglecting to implement structural STEPs components. Therefore, when staff turnover was experienced from year to year (approximately 36% new staff in Year 2) the skills to promote physical activity were lost. This finding has several implications for promotion of HEPA in ASPs. First, this finding suggests that programs should adopt a mixture of quality (e.g., ongoing trainings) and structural (e.g., adoption of detailed schedules and snack menus) STEPs components to produce desired HEPA changes, and maintain them over time. Second, regression may also have been the result of a reduction in intervention support contacts (i.e., only two follow-up booster training visits during second year compared to four during the first intervention year) for immediate programs. Reducing support contacts was meant to explore if programs maintained gains experienced in the first year with reduced intervention support. This is an important finding for agencies attempting to support ASPs in their pursuit of creating HEPA-friendly environments. In-person support visits are costly and time-intensive, yet appear to be necessary to achieve and maintain HEPA standards. If such visits are necessary, strategies for reducing cost and maximizing effectiveness of these visits are needed.
STEPs Relationship to HEPA Outcomes
Similar to past research, increased implementation of components in the STEPs framework was linked to an increase in the percentage of boys accumulating MVPA (Gray et al., 2015; McKenzie et al., 1994; Saunders et al., 2006). However, no such relationship was evident for girls, as both high- and low-implementing ASPs improved their MVPA. The finding that girls activity levels increased modestly is consistent with past research that has found girls’ activity levels respond modestly or not at all to activity interventions (Baranowski et al., 2003; Pate et al., 2005; Webber et al., 2008), and is encouraging as it suggests that even modest implementation of STEPs can increase girls’ MVPA. The reason for the difference between boys and girls response to STEPs for HEPA is unclear. However, one explanation may be that there is only one girl-specific (provide a girls-only physical activity option) strategy included in STEPs and 15 of 20 programs did not implement this strategy. Future studies should identify the barriers to implementing girls-only physical activity options in addition to identifying further strategies for increasing girls’ MVPA.
For healthy eating, an increase in the number of days water was served was the only outcome that demonstrated a statistically significant greater increase in high implementers when compared to low implementers. However, high implementers saw greater improvements for all healthy eating outcome variables, with four of the five effect sizes for these differences ranging from medium to large. While the difference in improvements between high and low implementers did not meet the criteria for statistical significance, the medium to large effect sizes suggest that greater improvements in healthy eating are achieved with higher levels of STEPs implementation.
Also of note, six programs were high implementers for both HEPA, while four programs were low implementers for both. The remaining 10 programs were classified as high implementers for either healthy eating or physical activity and low implementers for the other. This finding indicates that while some programs excel in both HEPA, the majority of programs may need targeted support for one or the other. This finding highlights the need for developing systems capable of identifying program specific needs related to HEPA. Developing such systems could help support agencies deliver the tailored feedback and support that ASPs need and eventually produce more HEPA-friendly environments.
Additionally, it appears that there was considerable variation in the STEPs programs chose to implement. This finding is consistent with implementation research that indicates successful interventions are adaptable to the constraints of settings in which they are delivered (Durlak & DuPre, 2008; Hawe, Shiell, & Riley, 2004). It appears that programs chose to implement strategies that work in their context and did not fully implement others. The strength of STEPs is that it allows for local tailoring. Furthermore, while high implementers adopted a variety of different STEPs they all experienced increases in HEPA. This is consistent with the idea of equifinality (Cicchetti & Toth, 1998) in developmental theories, where it is possible to arrive at the same outcome via multiple pathways. These findings reinforce a growing body of literature that indicate interventions should be adaptable and locally tailored (Collins, Murphy, & Bierman, 2004; Durlak & DuPre, 2008) if they are to achieve favorable outcomes. Thus, programs to enhance HEPA in ASPs should incorporate strategies similar to the STEPs framework where programs are able to identify program components that they deem modifiable, and tailor strategies to the restraints of their specific context.
This study has several strengths: multiple years of evaluation, an immediate and delayed group design, use of objective process and outcome measures with established validity and reliability, and statistical modeling linking implementation of STEPs and study outcomes. Some limitations of the study include the possibility of reactivity of staff and a relatively small sample size of ASPs. Although reactivity (i.e., programs could have changed HEPA practices due to the fact they were being observed) was a potential limitation of this study, because all visits were conducted on unannounced days, it is unlikely that staff could alter program schedules or snack menus due to limited advanced notice. Still the modeling behaviors of staff (e.g., refraining from eating inappropriate foods, playing with children) could have been affected by observation. Furthermore, the unit of analysis was at the program level resulting in a relatively small sample size (n = 20), limiting power to detect difference between high and low implementers.
In conclusion, this study illustrates that the STEPs framework can be used to guide modifications to key ASP components related to increasing children’s HEPA. These modifications to STEPs components are subsequently related to increases in both boys’ and girls’ MVPA and the quality of snacks served in ASPs. However, some challenges exist that must be addressed if programs are to realize their potential for affecting children’s HEPA. Specifically, variability in routine practice in ASPs and staff turnover are challenges that ASPs and health promotion experts face while attempting to increase HEPA in ASPs. Some key findings from this study that may help address these challenges include the following:
Strategies for increasing HEPA that can be easily incorporated into routine practice are successful. The STEPs framework was designed to help practitioners identify modifiable levers for program change that require limited input of resources. This study indicates that programs were able to incorporate the strategies in STEPs and experienced increases in HEPA in their programs as a result.
ASPs need ongoing support to incorporate strategies to promote HEPA. Due to the high rates of staff and program leader turnover, and the varying implementation of HEPA promotion strategies from year to year, ongoing and tailored feedback and support are required if ASPs are to meet their potential for promoting HEPA.
ASPs should incorporate a combination of foundational and quality STEPs changes. It appears that programs incorporated more quality STEPs strategies than foundational strategies. These changes lead to increases in HEPA during the first year of implementation but were not sustained during a second year. Structural components like creating and following an activity-friendly schedule may be necessary if changes are to be sustained over time.
ASPs require tailored and specific support and feedback related to increasing HEPA. While some programs excelled at increase children’s MVPA, others excelled at increasing the quality of snacks; few excelled at both. Furthermore, the STEPs that high-implementing ASPs chose to implement varied by program. These findings suggest that programs need support that is adaptable to the restraints that are specific the context in which they operate.
Acknowledgments
Authors’ Note: Research reported in this publication was supported by the National Heart, Lung, and Blood Institute of the National Institutes of Health under Award No. R01HL112787. The content is solely the responsibility of the authors and does not necessarily represent the official views of the National Institutes of Health. Author Justin B. Moore was at the University of South Carolina when he completed this study.
Appendix
APPENDIX A.
Data Source, Definition, and Index Coding Procedures for the STEPs for Physical Activity Promotion Variables
| Index Score Coding Procedure |
|||||
|---|---|---|---|---|---|
| Variable | Data source | Definition | Green (Full Implementation) |
Yellow (Partial Implementation) |
Red (No Implementation) |
| STEPs physical activity foundational index score Schedule level of detail | Document review of schedule | Detailed schedules define activity type (snack, homework, physical activity), location, staff roles, and materials; limited-detail schedules define at least one of the items above, and none indicates the site has no schedule | Detailed schedule | Limited detail | None |
| Scheduled activity time | Document review of schedule | Total number of minutes dedicated to physical activity opportunities on the after-school programs’ schedule | More than 60 minutes | 60 minutes | Less than 60 minutes |
| Physical activity is the only option | Document review of schedule | Total number of minutes dedicated exclusively to physical activity (i.e., children must choose a physical activity) | More than 60 minutes | 60 minutes | Less than 60 minutes |
| Number of days all staff wore physically active clothing | Direct observation | Active clothing defined as clothes that would not restrict staff from participating in activity with children (e.g., tennis shoes) | Every day | Some days | No days |
| Days a schedule was posted | Direct observation | Schedule posted in plain sight of parents at the program | Every day | Some days | No days |
| STEPs physical activity quality index score Staff giving instructions | SOSPANa | Staff are giving instructions (i.e., other than PA instructions) to children | Observed rarelyb | Observed sometimesb | Observed mostb |
| Staff disciplining children | SOSPANa | Children are being disciplined by staff | Observed rarelyb | Observed sometimesb | Observed mostb |
| Idle time | SOSPANa | Children are not engaged in any specific activity and are awaiting instructions from staff | Observed rarelyb | Observed sometimesb | Observed mostb |
| Staff withholding PA | SOSPANa | Staff member removes a child from physical activity (i.e., present or future) or threatens to remove a child from physical activity (i.e., present or future) as a consequence for behavior | Observed rarelyb | Observed sometimesb | Observed mostb |
| Children wait for their turn | SOSPANa | Children waiting their turn to play/participate | Observed rarelyb | Observed sometimesb | Observed mostb |
| Elimination games | SOSPANa | Physical activity eliminates children from physical activity opportunities as it progresses | Observed rarelyb | Observed sometimesb | Observed most b |
| Small team games | SOSPANa | Children are divided into several small games (no more than 5 per team) instead of one large game | Observed mostb | Observed sometimesb | Observed rarelyb |
| Staff playing with children | SOSPANa | Staff member is participating in physical activity with the children | Observed mostb | Observed sometimesb | Observed rarelyb |
| Staff verbally encouraging children | SOSPANa | Staff member verbally promotes physical activity (e.g., keep going, awesome job, good effort) | Observed mostb | Observed sometimesb | Observed rarelyb |
| Choice provided | SOSPANa | Children have a choice of PAs in which to participate (i.e., NOT do this or sit) | Observed mostb | Observed sometimesb | Observed rarelyb |
| Girls-only physical activity option | SOSPANa | There is a physical activity opportunity in which only girls participate | Observed mostb | Observed sometimesb | Observed rarelyb |
| STEPs healthy eating foundational index score Schedule of daily snack offerings (snack menu) | Direct Observation | The site has a snack menu for the week that the observation took place | Everyday | Some days | No days |
| Days a snack menu was posted | Direct Observation | Snack menu posted in plain sight of parents at the program | Every day | Some days | No days |
| Following schedule of daily snack offerings | Direct Observation | The site served what was on the menu the day of the observation | Everyday | Some days | No days |
| Snack cost | Document review of program receipts | The program leader is aware of the snack budget | Clear snack budget | N/A | Unclear/no snack budget |
| Location of snack purchases | Document review of program receipts | The program purchases snacks from one or several vendors on a regular basis | One or several vendors | N/A | No consistent vendor |
| STEPs healthy eating quality index score | |||||
| Staff eat snacks with children | SOSPANa | Staff eat provided snack with the children during snack time | Everyday | Some days | No days |
| Staff verbally promote healthy eating | SOSPANa | Staff verbally encourage children to eat the healthy snack | Everyday | Some days | No days |
| Staff refrain from eating inappropriate foods in front of children | SOSPANa | Staff do not eat other foods in front of children during program time | Everyday | Some days | No days |
| Staff refrain from drinking inappropriate drinks in front of children | SOSPANa | Staff drink only water in front of children during program time | Everyday | Some days | No days |
| Staff deliver healthy eating education | SOSPANa | Staff deliver healthy eating education (e.g., healthy eating coloring sheets/crosswords/word searches, trivia, etc.) to children | More than one observation day | One observation day | No days |
NOTE: STEPs = Strategies to Enhance Practice; PA = physical activity.
System for Observing Staff Promotion of Physical Activity and Nutrition.
Observed rarely defined as program is in the lower tertile—lower 33% in relation to other programs at baseline; observed sometimes defined as program in the middle tertile—middle 33% in relation to other programs at baseline; and observed most is defined as program in upper tertile—upper 33% in relation to other programs at baseline.
APPENDIX B. IMPLEMENTATION OF STEPS BY YEAR.
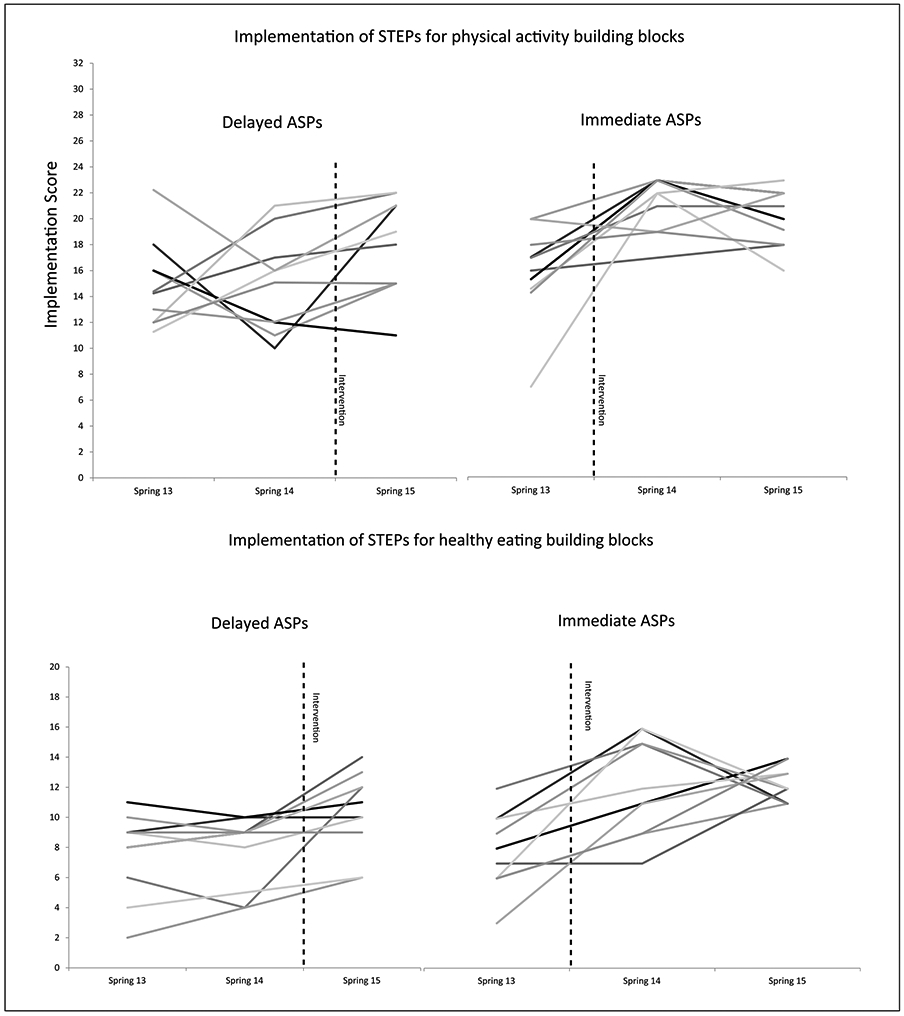
NOTE: ASPs = after-school programs; STEPs = Strategies to Enhance Practice. Each line represents one program.
REFERENCES
- Bailey RC, Olson J, Pepper SL, Porszaz J, Barstow TJ, & Cooper DM (1995). The level and tempo of children’s physical activities: An observational study. Medicine & Science in Sports & Exercise, 27, 1033–1041. [DOI] [PubMed] [Google Scholar]
- Ballew P, Brownson RC, Haire-Joshu D, Heath GW, & Kreuter MW (2010). Dissemination of effective physical activity interventions: Are we applying the evidence? Health Education Research, 25, 185–198. [DOI] [PMC free article] [PubMed] [Google Scholar]
- Baquet G, Stratton G, Van Praagh E, & Berthoin S (2007). Improving physical activity assessment in prepubertal children with high-frequency accelerometry monitoring: A methodological issue. Preventive Medicine, 44, 143–147. [DOI] [PubMed] [Google Scholar]
- Baranowski T, Baranowski JC, Cullen KW, Thompson DI, Nicklas T, Zakeri IE, & Rochon J (2003). The Fun, Food, and Fitness Project (FFFP): The Baylor GEMS pilot study. Ethnicity & Disease, 13(1 Suppl. 1), S30–39. [PubMed] [Google Scholar]
- Beets MW, Beighle A, Bottai M, Rooney L, & Tilley F (2012). Pedometer-determined step count guidelines for after-school programs. Journal of Physical Activity & Health, 9, 71–77. [DOI] [PubMed] [Google Scholar]
- Beets MW, Tilley F, Kim Y, & Webster C (2011). Nutritional policies and standards for snacks served in after-school programmes: A review. Public Health Nutrition, 14, 1882–1890. doi: 10.1017/S1368980011001145 [DOI] [PubMed] [Google Scholar]
- Beets MW, Wallner M, & Beighle A (2010). Defining standards and policies for promoting physical activity in afterschool programs. Journal of School Health, 80, 411–417. doi: 10.1111/j.1746-1561.2010.00521.x [DOI] [PubMed] [Google Scholar]
- Beets MW, Weaver RG, Turner-McGrievy G, Huberty J, Ward DS, Freedman D, … Beighle A (2015). Making healthy eating policy practice: A group randomized controlled trial on changes in snack quality, costs, and consumption in afterschool programs. American Journal of Health Promotion. Advance online publication. [DOI] [PMC free article] [PubMed] [Google Scholar]
- Beets MW, Weaver RG, Turner-McGrievy G, Huberty J, Ward DS, Freedman D, … Moore JB (2014). Making healthy eating and physical activity policy practice: The design and overview of a group randomized controlled trial in after-school programs. Contemporary Clinical Trials, 38, 291–303. [DOI] [PMC free article] [PubMed] [Google Scholar]
- Beets MW, Weaver RG, Turner-McGrievy G, Huberty J, Ward DS, Pate RR, … Beighle A (2015). Making policy practice in afterschool programs: A randomized controlled trial on physical activity changes. American Journal of Preventive Medicine, 48, 694–706. [DOI] [PMC free article] [PubMed] [Google Scholar]
- Beets MW, Weaver RG, Turner-McGrievy G, Huberty J, Ward DS, Pate RR, … Beighle A (in press). Making physical activity policy practice: A group randomized controlled trial on changes in moderate-to-vigorous physical activity in after-school programs. American Journal of Preventive Medicine. [DOI] [PMC free article] [PubMed] [Google Scholar]
- California Department of Education. (2009). California after school physical activity guidelines. Retrieved from http://www.cde.ca.gov/ls/ba/as/documents/paguidelines.pdf#search=physical%20activity&view=FitH&pagemode=none
- Cicchetti D, & Toth SL (1998). The development of depression in children and adolescents. American Psychologist, 53, 221–241. [DOI] [PubMed] [Google Scholar]
- Collins LM, Murphy SA, & Bierman KL (2004). A conceptual framework for adaptive preventive interventions. Prevention Science, 5, 185–196. [DOI] [PMC free article] [PubMed] [Google Scholar]
- Durlak JA (2009). How to select, calculate, and interpret effect sizes. Journal of Pediatric Psychology, 34, 917–928. [DOI] [PubMed] [Google Scholar]
- Durlak JA, & DuPre EP (2008). Implementation matters: A review of research on the influence of implementation on program outcomes and the factors affecting implementation. American Journal of Community Psychology, 41, 327–350. doi: 10.1007/s10464-008-9165-0 [DOI] [PubMed] [Google Scholar]
- Dusenbury L, Brannigan R, Falco M, & Hansen WB (2003). A review of research on fidelity of implementation: Implications for drug abuse prevention in school settings. Health Education Research, 18, 237–256. doi: 10.1093/her/18.2.237 [DOI] [PubMed] [Google Scholar]
- Dzewaltowski DA, Rosenkranz RR, Geller KS, Coleman KJ, Welk GJ, Hastmann TJ, & Milliken GA (2010). HOP’N after-school project: An obesity prevention randomized controlled trial. International Journal of Behavioral Nutrition and Physical Activity, 7(1), 90. doi: 10.1186/1479-5868-7-90 [DOI] [PMC free article] [PubMed] [Google Scholar]
- Evenson KR, Catellier DJ, Gill K, Ondrak KS, & McMurray RG (2008). Calibration of two objective measures of physical activity for children. Journal of Sports Science, 26, 1557–1565. doi: 10.1080/02640410802334196 [DOI] [PubMed] [Google Scholar]
- Gray HL, Contento IR, & Koch PA (2015). Linking implementation process to intervention outcomes in a middle school obesity prevention curriculum, “Choice, Control and Change.” Health Education Research, 30, 248–261. doi: 10.1093/her/cyv005 [DOI] [PMC free article] [PubMed] [Google Scholar]
- Hastmann TJ, Bopp M, Fallon EA, Rosenkranz RR, & Dzewaltowski DA (2013). Factors influencing the implementation of organized physical activity and fruit and vegetable snacks in the HOP’N after-school obesity prevention program. Journal of Nutrition Education and Behavior, 45, 60–68. [DOI] [PubMed] [Google Scholar]
- Hawe P, Shiell A, & Riley T (2004). Complex interventions: How “out of control” can a randomised controlled trial be? British Medical Journal, 328, 1561–1563. doi: 10.1136/bmj.328.7455.1561 [DOI] [PMC free article] [PubMed] [Google Scholar]
- Kelder S, Hoelscher DM, Barroso CS, Walker JL, Cribb P, & Hu S (2005). The CATCH Kids Club: A pilot after-school study for improving elementary students’ nutrition and physical activity. Public Health Nutrition, 8, 133–140. [DOI] [PubMed] [Google Scholar]
- Maslow AH (1943). A theory of human motivation. Psychological Review, 50, 370–396. [Google Scholar]
- McGraw SA, Sellers DE, Stone EJ, Bebchuk J, Edmundson EW, Johnson CC, … Luepker RV (1996). Using process data to explain outcomes: An illustration from the Child and Adolescent Trial for Cardiovascular Health (CATCH). Evaluation Review, 20, 291–312. [DOI] [PubMed] [Google Scholar]
- McGraw SA, Sellers DE, Stone EJ, Resnicow KA, Kuester S, Fridinger F, & Wechsler H (2000). Measuring implementation of school programs and policies to promote healthy eating and physical activity among youth. Preventive Medicine, 31, S86–S97. doi: 10.1006/pmed.2000.0648 [DOI] [Google Scholar]
- McKenzie TL, Strikmiller PK, Stone EJ, Woods SE, Ehlinger SS, Romero KA, & Budman ST (1994). CATCH: Physical activity process evaluation in a multicenter trial. Health Education Quarterly, 1994(Suppl. 2), S73–S89. [DOI] [PubMed] [Google Scholar]
- McNeil DA, Wilson BN, Siever JE, Ronca M, & Mah JK (2009). Connecting children to recreational activities: Results of a cluster randomized trial. American Journal of Health Promotion, 23, 376–387. [DOI] [PubMed] [Google Scholar]
- Mozaffarian RS, Wiecha JL, Roth BA, Nelson TF, Lee RM, & Gortmaker SL (2010). Impact of an organizational intervention designed to improve snack and beverage quality in YMCA after-school programs. American Journal of Public Health, 100, 925–932. doi: 10.2105/ajph.2008.158907 [DOI] [PMC free article] [PubMed] [Google Scholar]
- Pate RR, Ward DS, Saunders RP, Felton G, Dishman RK, & Dowda M (2005). Promotion of physical activity among high-school girls: A randomized controlled trial. American Journal of Public Health, 95, 1582–1587. [DOI] [PMC free article] [PubMed] [Google Scholar]
- Saunders RP, Ward D, Felton GM, Dowda M, & Pate RR (2006). Examining the link between program implementation and behavior outcomes in the lifestyle education for activity program (LEAP). Evaluation and Program Planning, 29, 352–364. doi: 10.1016/j.evalprogplan.2006.08.006 [DOI] [PubMed] [Google Scholar]
- Sharpe EK, Forrester S, & Mandigo J (2011). Engaging community providers to create more active after-school environments: Results from the Ontario CATCH Kids Club implementation project. Journal of Physical Activity & Health, 8(Suppl. 1), S26–S31. [DOI] [PubMed] [Google Scholar]
- Vale S, Santos R, Silva P, Soares-Miranda L, & Mota J (2009). Preschool children physical activity measurement: Importance of epoch length choice. Pediatric Exercise Science, 21, 413–420. [DOI] [PubMed] [Google Scholar]
- Viadro CI, Earp JAL, & Altpeter M (1997). Designing a process evaluation for a comprehensive breast cancer screening intervention: Challenges and opportunities. Evaluation and Program Planning, 20, 237–249. [Google Scholar]
- Weaver RG, Beets MW, Huberty J, Freedman D, Turner-Mcgrievy G, & Ward D (2015). Physical activity opportunities in afterschool programs. Health Promotion Practice, 16, 371–382. [DOI] [PMC free article] [PubMed] [Google Scholar]
- Weaver RG, Beets MW, Hutto B, Saunders RP, Moore JB, Turner-McGrievy G, … Freedman D (2015). Making healthy eating and physical activity policy practice: Process evaluation of a group randomized controlled intervention in afterschool programs. Health Education Research, 30, 849–865. [DOI] [PMC free article] [PubMed] [Google Scholar]
- Weaver RG, Beets MW, Saunders RP, Beighle A, & Webster C (2014). A comprehensive professional development training’s effect on afterschool program staff behaviors to promote healthy eating and physical activity. Journal of Public Health Management and Practice, 20(4), E6–E14. [DOI] [PMC free article] [PubMed] [Google Scholar]
- Webber LS, Catellier DJ, Lytle LA, Murray DM, Pratt CA, Young DR, … Pate RR (2008). Promoting physical activity in middle school girls: Trial of Activity for Adolescent Girls. American Journal of Preventive Medicine, 34, 173–184. doi: 10.1016/j.amepre.2007.11.018 [DOI] [PMC free article] [PubMed] [Google Scholar]
- Wiecha J, Hall G, Gannett E, & Roth B (2011). National after-school association standards for healthy eating and physical activity in out-of-school time programs. Retrieved from http://www.niost.org/pdf/host/Healthy_Eating_and_Physical_Activity_Standards.pdf [DOI] [PubMed]