Abstract
Ontogeny describes the emergence of complex multicellular organisms from single totipotent cells. In mammals, this field is particularly challenging due to the indeterminate relationship between self-renewal and differentiation, variation of progenitor field sizes, and internal gestation. Here, we present a flexible, high information, multi-channel molecular recorder with a single cell (sc) readout and apply it as an evolving lineage tracer to define a mouse cell fate map from fertilization through gastrulation. By combining lineage information with scRNA-seq profiles, we recapitulate canonical developmental relationships between different tissue types and reveal the nearly complete transcriptional convergence of endodermal cells from extra-embryonic and embryonic origins. Finally, we apply our cell fate map to estimate the number of embryonic progenitor cells and their degree of asymmetric partitioning during specification. Our approach enables massively parallel, high-resolution recording of lineage and other information in mammalian systems to facilitate a quantitative framework for understanding developmental processes.
Development of a multicellular organism from a single cell is an astonishing process. Classic lineage tracing experiments using C. elegans revealed surprising outcomes, including deviations between lineage and functional phenotype, but nonetheless benefited from the highly deterministic nature of this organism’s development1. Alternatively, more complex species generate larger, more elaborate structures that progress through multiple transitions, raising questions regarding the coordination between specification and commitment to ensure faithful recapitulation of an exact body plan2,3. Single cell RNA-sequencing (scRNA-seq) has permitted unprecedented explorations into cell type heterogeneity, producing profiles of developing flatworms4,5, frogs6, zebrafish7,8, and mice9,10. More recently, CRISPR-Cas9-based technologies have been applied to record cell lineage11–13, and combined with scRNA-seq to generate fate maps in zebrafish14–16. However, these technologies include only one or two bursts of barcode diversity generation, which may be limiting for other applications or organisms.
An ideal molecular recorder for these questions would possess the following characteristics: 1) minimal impact on cellular phenotype; 2) high information content to account for hundreds of thousands of cells; 3) a single cell readout for simultaneous profiling of functional state14–16; 4) flexible recording rates that can be tuned to a broad temporal range; and 5) continuous generation of diversity throughout the experiment. The last point is especially relevant for mammalian development, where spatial plans are gradually and continuously specified and may originate from small, transient progenitor fields. Moreover, scRNA-seq has revealed populations of cells with a continuous spectrum of phenotypes, implying that differentiation does not occur instantaneously, further motivating the need for an evolving recorder17.
Here, we generated and validated a method for simultaneously reporting cellular state and lineage history in mice. Our CRISPR-Cas9-based recorder is capable of high information content and multi-channel recording with readily tunable mutation rates. We employ the recorder as a continuously evolving lineage tracer to observe the fate map underlying embryogenesis through gastrulation, recapitulating canonical paradigms and illustrating how lineage information may facilitate the identification of novel cell types.
Results
A transcribed and evolving recorder
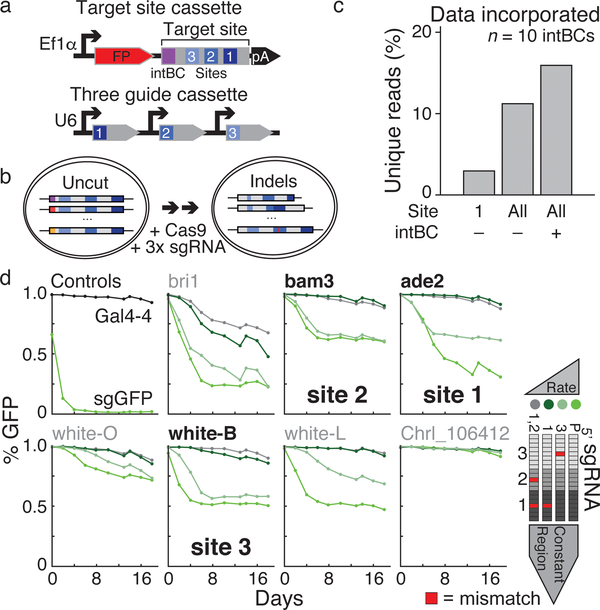
To achieve our goal of a tunable, high information content molecular recorder, we utilized Cas9 to generate insertions or deletions (indels) upon repair of double-stranded breaks, which are inherited in the next generation of cells11–16. We record within a 205 base pair, synthetic DNA “target site” containing three “cut sites” and a static 8 base pair “integration barcode” (intBC), which are delivered in multiple copies via piggyBac transposition (Fig. 1a, b). We embedded this sequence into the 3’UTR of a constitutively transcribed fluorescent protein to enable profiling from the transcriptome. A second cassette encodes three independently transcribed and complementary guide RNAs to permit recording of multiple, distinct signals (Fig. 1a, b)18.
Figure 1: Optimization of a multi-purpose molecular recorder.
a. Target site (top) and three guide (bottom) cassettes. The target site consists of an integration barcode (intBC) and three cut sites for Cas9-based recording. Three different single guide RNAs (sgRNAs) are each controlled by independent promoters (in this study, mU6, hU6, and bU6).
b. Molecular recording principle. Each cell contains multiple genomic, intBC-distinguishable target site integrations. sgRNAs direct Cas9 to cognate cut sites to generate insertion (red) or deletion mutations. Here, Cas9 is either ectopically delivered or induced by doxycycline.
c. Percentage of uniquely marked reads recovered after recording within a K562 line with 10 intBCs for 6 days using the following information: site 1 only with intBCs masked, sites 1–3 (All) with intBCs masked, and sites 1–3 (All) with intBCs considered. Information content scales with number of sites and presence of the intBC.
d. sgRNA mismatches alter mutation rate. Seven protospacers were integrated into the coding sequence of a GFP reporter to infer mutation rate by the fraction of positive cells over a 20 day time course. Single or dual mismatches were made in guides according to proximity to the PAM: region 1 (proximal), region 2, and region 3 (distal). Guides against Gal4–4 and the GFP coding sequence act as negative and positive controls. Bold sequences were incorporated into the target site.
Our system is capable of high information storage due to the diversity of heritable repair outcomes, and the large number of targeted sites, which can be distinguished by the intBC (Fig. 1c). DNA repair generates hundreds of unique indels, and the distribution for each cut site is different and nonuniform: some produce highly biased outcomes while others create a diverse series (Fig. 1c, Extended Data Fig. 1)19–21. To identify sequences that can tune the mutation rate of our recorder for timescales that are not pre-defined, and may extend from days to months, we screened several guide RNA series containing mismatches to their targets22 by monitoring their activity on a GFP reporter over a 20-day timecourse and selected those that demonstrated a broad dynamic range (Fig. 1d). Slower cutting rates may improve viability in vivo, as frequent Cas9-mediated double-strand breaks can cause cellular toxicity23,24. To demonstrate information recovery from single cell transcriptomes, we stably transduced K562 cells with our technology and generated a primary, cell-barcoded cDNA pool via the 10x Genomics platform, allowing us to assess global transcriptomes and specifically amplify mutated target sites (Extended Data Fig. 1c).
Tracing cell lineages during development
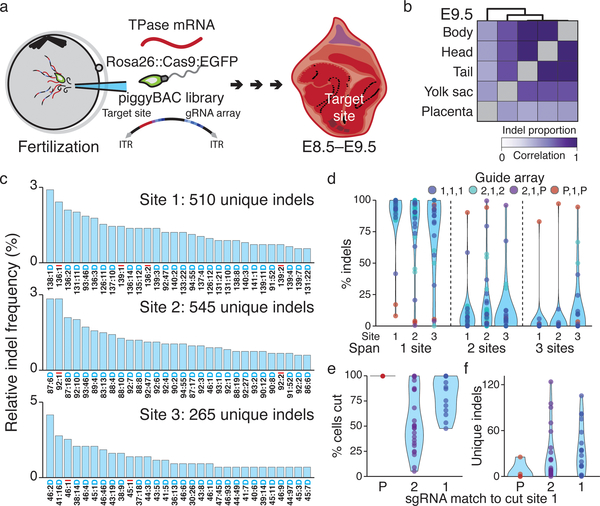
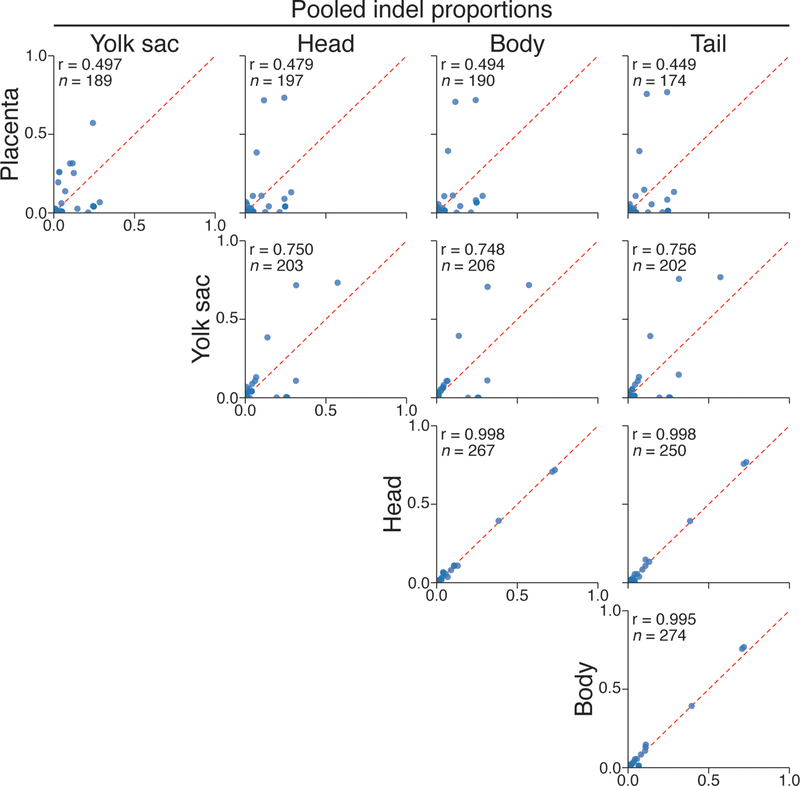
We next applied our technology to map cell fates during mouse early development from totipotency onwards. We integrated multiple target sites into the genome, delivered constitutive Cas9-GFP encoding sperm into oocytes to initiate cutting, and isolated embryos for analysis at ~embryonic day (E)8.5 or E9.5 (Fig. 2a, Methods). To confirm our lineage tracing capability, we amplified the target site from bulk placenta, yolk sac, and three embryonic fractions from an E9.5 embryo and recapitulated their expected relationships using the similarity of their indel proportions (Fig. 2b, Extended Data Figure 2).
Figure 2: Lineage tracing in mouse from fertilization through gastrulation.
a. Lineage tracing in mouse experiments. The target site (within mCherry’s 3’UTR) and the three guide cassettes are encoded into a single piggyBac transposon vector (ITRs, inverted terminal repeats). The vector, transposase mRNA, and Rosa26::Cas9:EGFP sperm are injected into oocytes to ensure early integration and tracing in all subsequent cells after zygotic genome activation. Transferred embryos are then recovered after gastrulation.
b. Pearson correlation coefficient heatmap of indel proportions recovered from bulk tissue of an E9.5 embryo (see also Extended Data Figure 2).
c. Indel frequency distribution estimated from 40 independent target sites from all embryos. Each site produces hundreds of outcomes for high information encoding. See Extended Data Figure 4 and Methods for frequency calculation. The indel code along the x-axis is as follows: “Alignment Coordinate: Indel Size Indel type (Insertion or Deletion).”
d. Proportion of indels that span one, two, or three sites, shown per site. Each dot denotes one of 40 independent intBCs and sums to one across site-spanning indels. Colors indicate the guide array: P = no mismatches; 1 = mismatch in region 1; 2 = mismatch in region 2.
e. Percentage of cells with mutations according to guide complementarity. Indel proportions within one mouse depend on timing: mutations that happen earlier in development are propagated to more cells. Dots represent site 1 measurements from independent intBCs; N = 4, 24, and 18 for P, 2, and 1 region mismatches.
f. Indel diversity is inversely related to cutting efficiency for site 1 as in e. Early mutations due to fast cutting are propagated to more cells, leading to smaller numbers of unique indels.
Following this in vivo proof of principle, we generated single cell data from additional embryos (Extended Data Figure 3). We collected scRNA-seq data for 7,364 – 12,990 cells from 7 embryos (~15.8% – 61.4% of the total cell count) and recovered 167 – 2,461 unique lineage identities (≥1 target site recovered for 15% – 75% of cells from 3 to 15 intBCs, Fig. 2c, Extended Data Figure 4). Many target sites are either lowly or heterogeneously represented, which we improved by changing the promoter from a truncated form of Ef1α to an intron-containing version (see embryo 7, Extended Data Figure 4)25.
We estimated the indel likelihood distribution by combining data from all seven embryos. Many indels are shared with K562 cells, though their likelihoods differ, suggesting that cell type or developmental status may influence repair outcomes (Fig. 2d, Extended Data Figure 1, 4f)19. Our ability to independently measure and control the rate of cutting across the target site is preserved in vivo, with minimal interference between cut sites except when using combinations of the fastest guides that may lead to end-joining between simultaneous double strand breaks (Fig. 2e). The fastest cutters result in higher proportions of cells with identical indels, indicating earlier mutations in development, which correspondingly reduce indel diversity (Fig. 2f, g). Importantly, the lineage tracer retains additional recording capacity beyond the temporal interval studied here, as most embryos still have unmodified cut sites (Fig. 2f).
Simultaneous scRNA-seq to assign state
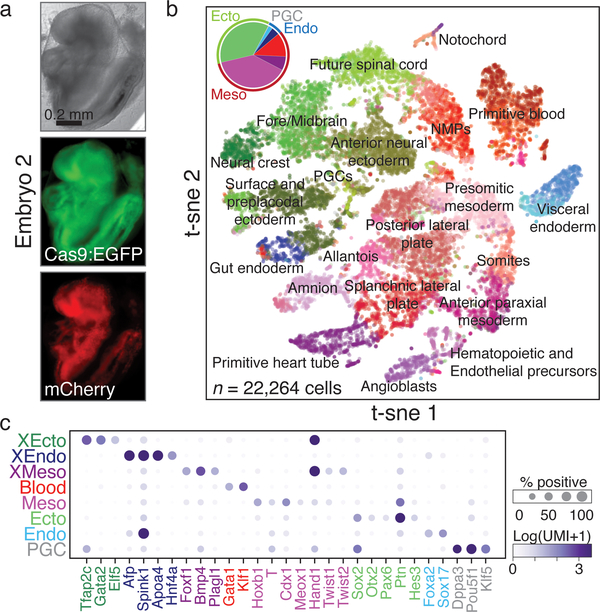
Next, to ascertain cell function, we utilized annotations from a compendium of wild-type mouse gastrulation (E6.5 – E8.5). We assigned cells from lineage-traced embryos by their proximity to each cell state expression signature and aged each embryo by their tissue proportions compared to each stage (Fig. 3a-c)26. We proceeded with six of our seven embryos, as they appeared to be morphologically normal and included every expected tissue type: two mapped most closely to E8.5, and the remaining four mapped to E8.0 (Extended Data Fig. 5). Placenta was not specifically isolated, but is present in four of six embryos, serving as a valuable outgroup to establish our ability to track transitions to the earliest bifurcation.
Figure 3: Assigning cellular phenotype by scRNA-seq.
a. Images of a lineage-traced E8.5 embryo (embryo 2 of 7 for which single cell data was collected, see Extended Data Figure 3), including for Cas9:EGFP and the mCherry:target site.
b. t-sne plot of scRNA-seq from embryo in a. Only large or spatially distinct clusters are labeled. (Inset) Pie chart of germ layers. Lighter and darker shades represent embryonic and extra-embryonic components, respectively. Mesoderm is further separated to include blood (red). See Extended Data Figure 5b for additional embryos.
c. Dot plot of canonical tissue-specific markers. Grouping clusters of diverse tissue types into germ layers reduces the fraction of marker positive cells, but the specificity to their respective states remains high, especially when considered combinatorially. Size: fraction of marker-positive cells, color intensity: normalized expression (cluster mean). XEcto, extra-embryonic ectoderm/placenta; XEndo, extra-embryonic endoderm/yolk sac; PGC, primordial germ cell; Endo, embryonic endoderm; Ecto, embryonic ectoderm; Meso, embryonic mesoderm; XMeso, extra-embryonic mesoderm.
We also developed breeder mice that would enable facile exploration of all stages of development by injecting target sites into Cas9 negative backgrounds. This approach substantially increases the number of stably integrated target sites (~20). Resulting mice can be crossed with Cas9 expressing strains to yield viable Cas9+ F1 litters that maintain continuous, stochastic indel generation into adulthood, demonstrating that cutting does not noticeably interfere with normal animal development (Extended Data Fig 6).
Single cell lineage reconstruction
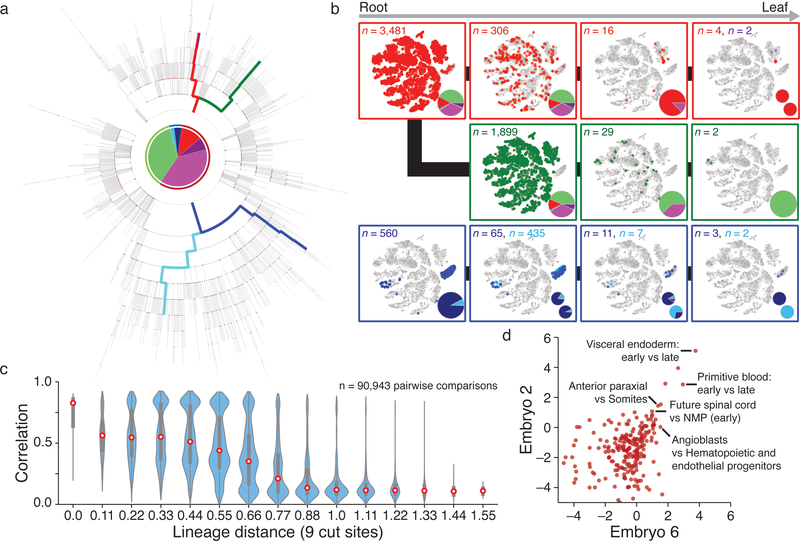
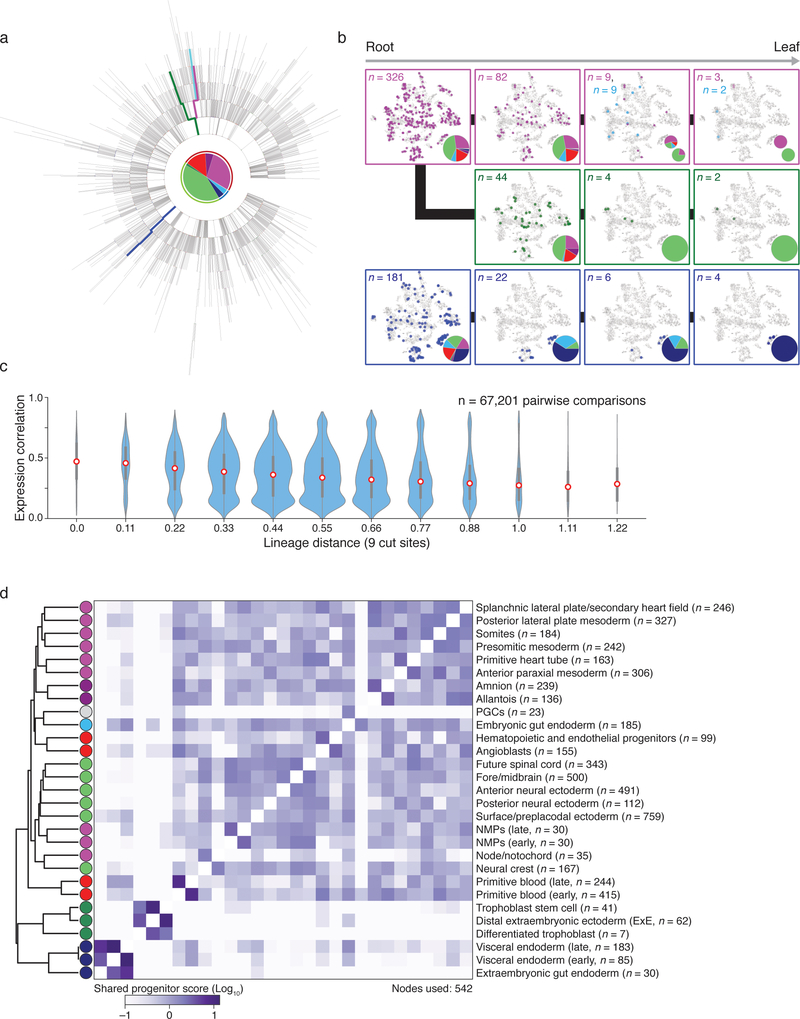
We developed phylogenetic reconstruction strategies to specifically exploit the characteristics of our lineage tracer, namely categorical indels, irreversibility of mutations, and presence of missing values (Extended Data Figure 7, Methods). We determined the best reconstruction by summing the log-likelihoods for all indels that appear in the tree using likelihoods estimated from embryo data (Extended Data Figures 4 and 7). When cell type identity from scRNA-seq is overlaid onto the tree, we observe functional restriction during development, with fewer cell types represented as we move from root to leaves (Fig. 4a, b, Extended Data Figure 8).
Figure 4: Single cell lineage reconstruction of mouse embryogenesis.
a. Reconstructed lineage tree comprised of 1,732 nodes for embryo 2 with three lineages highlighted. Each branch represents an indel generation event.
b. Example paths from tree in a highlighted by color. Cells for each node in the path are overlaid onto the plot from Figure 3b, with tissue proportions as a pie chart. Tissue representation decreases with increased tree depth, indicating functional restriction. Bifurcating sublineages are included for the top and bottom paths. In the top (red) path, this bifurcation occurs within the final branch after primitive blood specification. In the bottom (blue) path, bifurcation happens early within bipotent cells that become either gut or visceral endoderm.
c. Violin plots of the pairwise relationship between lineage and expression for single cells. Lineage distance uses a modified Hamming distance normalized to the number of shared cut sites. Pearson correlation decreases with increasing lineage distance, showing that closely related cells are more likely to share function. Red dot highlights the median, edges the interquartile range, and whiskers the full range.
d. Comparison of shared progenitor scores (log2-transformed) between our two most information-dense embryos (Embryo 2, n = 1,400 alleles; Embryo 6, n = 2,461 alleles). Cells from closely related transcriptional clusters (ex. primitive blood or visceral endoderm, which have early and late states) derive from common progenitors and score as highly related in both embryos. We also observe a close link between mesoderm and ectoderm that may reflect shared heritage between neuromesodermal progenitors (NMPs) and more posterior neural ectodermal tissues, such as the future spinal cord42.
scRNA-seq-based strategies for ordering cells, such as trajectory inference, typically assume that functional similarity reflects close lineage17. To investigate this question directly, we used a modified Hamming distance to measure pairwise lineage distance and compared them to RNA-seq correlation. Generally, cells separated by a smaller lineage distance have more similar transcriptional profiles, though this relationship is clearer for some embryos than others (Fig. 4c, Extended Data Figure 9). This result is consistent with the notion of continuous restriction of potency as cells differentiate into progressively differentiated types.
We also developed a shared progenitor score that estimates the degree of common ancestry between different tissues by evaluating the number and specificity of shared nodes in the tree (Methods). Despite the stochastic timing of indel formation, this approach can reproducibly recover emergent tissue relationships, such as possible shared origins between anterior somites and paraxial mesoderm or neuromesodermal progenitors and the future spinal cord (Fig. 4d). The full map of shared progenitor scores can be clustered to create a comprehensive picture of tissue relationships during development (Extended Data Fig. 8d).
State and lineage do not always conform
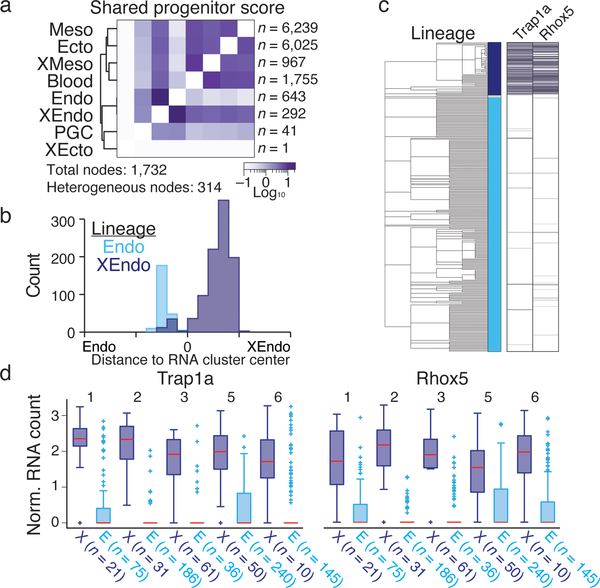
While our reconstructed tissue relationships generally recapitulate canonical knowledge, extra-embryonic and embryonic endoderm display consistent and unexpectedly close ancestry despite their independent origins from the hypoblast and embryo-restricted epiblast (Fig. 5a, Extended Data Figure 9). Manual inspection of the trees revealed a subpopulation of cells that appear transcriptionally as embryonic endoderm but that lineage analysis places within extra-embryonic branches (Fig 4c, blue). Consistent with this finding, an earlier, targeted study using marker-directed lineage tracing identified latent extra-embryonic contribution to the developing hindgut during gastrulation, although it was not possible to broadly evaluate their transcriptomes27.
Figure 5: Disparities between transcriptional identity and lineage history within the extra-embryonic endoderm.
a. Shared progenitor score heatmap for embryo 2 reconstructs expected relationships. The number of nodes that include cells from different lineages is highlighted (Heterogeneous nodes). See Extended Data Figure 9 for additional embryos.
b. For cells from embryo 2, the relative distance from the mean expression profile of either the endoderm or the extra-embryonic endoderm cluster according to origin (Endo or XEndo).
c. Endoderm cell lineage tree from embryo 2 with expression heatmap for two extra-embryonic marker genes. Middle bar indicates lineage: dark blue, extra-embryonic; light blue, embryonic; grey, ambiguous.
d. Expression boxplots for Trap1a and Rhox5 confirms consistent differential expression across lineage-traced embryos according to their embryonic or extra-embryonic ancestry. Red line highlights median, edges the interquartile range, whiskers the Tukey Fence, and crosses outliers. N’s, the number of recovered XEndo origin cells of either embryonic (E) or Extraembryonic (X) function per embryo.
Here, scRNA-seq profiles collected in tandem with the lineage readout allow us to assess the degree of convergence towards a functional endoderm signature and identify distinguishing genes. Endoderm-classified cells derived from extra-embryonic origin are most similar to the endoderm cell type, but do share slightly higher similarity with yolk sac that is not apparent within the t-sne projection of the full embryo (Fig. 5b, Extended Data Figure 10). Given these independent origins, we might expect a subtle, but persistent, transcriptional signature reflecting their developmental history. Strikingly, when we separate endoderm cells according to their lineage, we identify two X-linked genes, Trap1a and Rhox5, general markers for extra-embryonic tissue28,29 that are consistently upregulated in the extra-embryonic origin endoderm across embryos (K–S test, Bonferroni corrected P-value <0.05, Fig. 5d, e). Notably, in other RNA-seq studies, these relationships are not captured by whole embryo clustering, and are only found by specific examination of the hindgut (Extended Data Figure 10) 9,30. These observations confirm that our lineage tracer can successfully pinpoint instances of convergent transcriptional regulation.
Towards a quantitative fate map
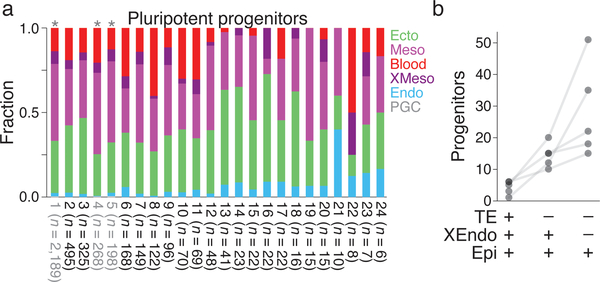
Simultaneous single cell lineage tracing with phenotype provides the unique opportunity to infer the cellular potency and specification biases of ancestral cells as reconstructed by our fate map31,32. Each node within the tree represents a unique lineage identity stemming from a single reconstructed progenitor cell, allowing us to estimate lower boundaries of their field size (Methods). We investigated the founding number of progenitors during the earliest transitions in cellular potential. We defined totipotency as a node that gives rise to both embryonic and extra-embryonic ectodermal/placental cell types and tiered pluripotency into “early” and “late” according to the presence of extra-embryonic endoderm (Fig. 6a)33. The contributions of these founders to extant lineages are asymmetric, suggesting that even though a progenitor may be biased towards a specific fate, it retains the ability to generate other cell types. Lower bound estimates from our data suggest a range of 1–6 totipotent cells, 10–20 early, and 18–51 late pluripotent progenitors (Fig. 6b). The variable number of multipotent cells at these stages may reflect an encoded robustness that ensures successful assembly of the functioning organism, particularly given that a single pluripotent cell can generate all somatic lineages in an embryo34. Future studies using more replicates generated by breeding may enable statistical approaches to evaluate these organism-scale developmental considerations.
Figure 6: Lineage bias and estimated size of progenitor pools.
a. Relative tissue distribution of cells descended from reconstructed or profiled pluripotent progenitor cells for embryo 2. “Profiled” is a unique lineage identity of multiple cells directly observed in the data. Pluripotent cells form all germ layers, but show asymmetric propensities towards different cell fates, possibly reflecting positional biases. Nodes highlighted in grey with asterisk overlasy give rise to primordial germ cells (lineages 1, 4, and 5 include 9, 1, and 1 PGCs each). Color assignments as in Figures 3.
b. Estimated progenitor field sizes for three types of early developmental potency. Totipotent cells give rise to all cells of the developing embryo, including trophectodermal (TE) lineages. Pluripotent progenitors are partitioned into early and late by generation of extra-embryonic endoderm (XEndo) in addition to epiblast (Epi). Dots represent single embryos; solid grey line connects estimates from the same embryo.
Discussion
In this study, we present cell fate maps underlying mammalian gastrulation using a technology for high information and continuous recording. Several key ideas have emerged, including the transformative nature of CRISPR-Cas9-directed mutation with a single cell RNA-seq readout14–16, how information about a cell’s history recorded by this technology can complement RNA-seq profiles to characterize cell type, and an early framework for quantitatively understanding stochastic transitions during mammalian development.
The modularity of our recorder allows for substitutions that will increase its breadth of applications. Here, we use three constitutively expressed guide RNAs to record continuously over time, but future modifications could employ environmentally-responsive promoters that sense stress, neuronal action potentials, or cell-to-cell contacts35, or combine these approaches for multifactorial recording. Similarly, Cas9-derived base editors36, including those that create diverse mutations37 could allow for content-recording in cells that are particularly sensitive to nuclease-directed DNA double strand breaks23,24.
Our cell fate map identifies phenotypic convergence of independent cell lineages, showcasing the power of unbiased organism-wide lineage tracing to separate populations that appear similar in scRNA-seq alone. Specifically, we substantiate the extra-embryonic origin of a subset of cells that resemble embryonic endoderm. While the initial specification of these lineages are known to rely on redundant regulatory programs, they are temporally separated by several days, emerge from transcriptionally and epigenetically distinct progenitors, and form terminal cell types with highly divergent functions. The identification of highly predictive markers that segregate by origin, such as Trap1a, provides a clear outline for further exploration through spatial transcriptomics38,39,40. More generally, our approach can be used to investigate other convergent processes or to discriminate heterogeneous cell states that represent persistent signatures of a cell’s past, which will be critical for the assembly of a comprehensive cell atlas41. The scope of transdifferentiation within mammalian ontogenesis remains largely unexplored, but can be practically inventoried using our system.
Ultimately, our technology is designed to quantitatively address previously opaque questions in ontogenesis. Higher order issues of organismal regulation, such as the location, timing, and stringency of developmental bottlenecks, as well as the corresponding likelihoods of state transitions to different cellular phenotypes, can be modeled from the assembly of historical relationships. Our hope is that characterization of these attributes will lead to new insights that connect large-scale developmental phenomena to the molecular regulation of cell fate decision-making.
Extended Data
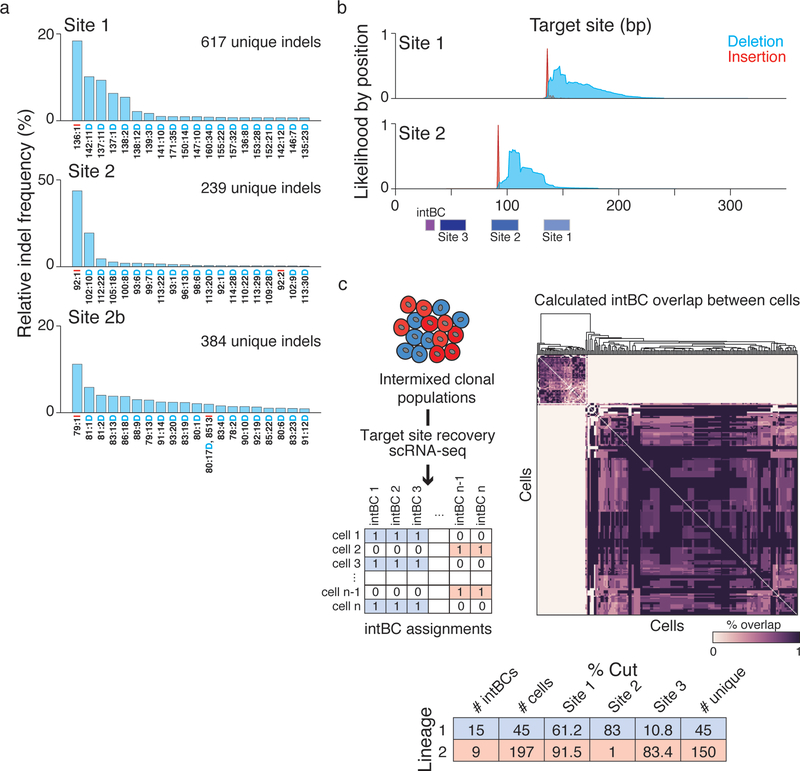
Extended Data Figure 1: Target site indel likelihoods from in vitro experiments.
a. Histograms for the relative indel frequency for protospacer sites 1, 2, and 2b within the target region. In this experiment, single guide RNA expressing vectors respective to each position were delivered into K562 cells. Repair outcomes and frequencies are different for each site, but every site produces hundreds of discrete outcomes. The top 20 most frequent indels for each site are shown. The indel code along the x-axis is as follows: “Alignment Coordinate: Indel Size Indel type (Insertion or Deletion).” Site 3 was not profiled in this experiment.
b. Histograms representing the likelihood that any specific base in the target site is deleted (blue) or has an insertion (red) which begins at that position, for sites 1 and 2, respectively. The position of the integration barcode (intBC) and protospacer sequences (sites) within the target site is represented as a schematic along the bottom, with the PAM for each site proximal to the intBC. Indels, specifically insertions, start at the double strand break point 3-bases upstream of the PAM sequence.
c. Simultaneous and continuous molecular recording of multiple clonal populations in K562 cells. We transduced K563 cells with a high complexity library of unique intBCs, sorted them into wells of 10 cells each and propagated them for 18 days. At the end of the experiment, we detected two populations by their intBCs, implying that only two clonal lineages expanded from the initial population of 10, and confirmed generation of target site mutations. (Left) Strategy for partitioning a multi-clonal population into their clonal populations. Target sites are amplified from a single cell barcoded cDNA library and the intBCs in each cell is identified as present or absent. (Middle) Heatmap of the percent overlap of intBCs between all cells. The cells segregate into two populations representing the descendants of two progenitor cells from the beginning of the experiment. (Right) Table summarizing results of the experiment, including the generation of indels over the experiment duration. These data additionally showcase our ability to combine dynamic recording with tracing based on traditional static barcodes.
Extended Data Figure 2: Capturing early differentiation by pooled sequencing of indels generated within an E9.5 embryo.
Scatterplots of indel proportions from dissected, bulk tissue of an E9.5 embryo. Placenta is the most distantly related from embryonic tissues, followed by the yolk sac, with the three embryonic compartments sharing the highest similarity.
Extended Data Figure 3: Experimental overview.
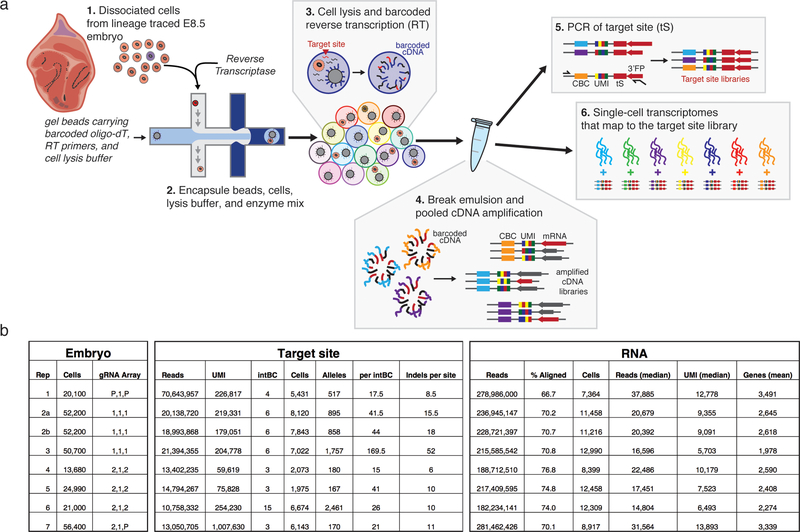
a. Schematic of platform used for generation of single cell RNA-seq libraries and corresponding target site amplicon libraries, adapted from Adamson et al., 2016 (Ref 18). The barcoded and amplified cDNA library is split into two fractions prior to shearing: one fraction is used to generate a global transcription profile and the other is used to specifically amplify the target site.
b. Summary table of lineage traced embryos detailing the type of guides used, the sampling proportion, and sequencing results. Embryo 4 was omitted from further analysis due to the absence of cells identified as primitive heart tube.
Extended Data Figure 4: Target site capture in mouse embryos.
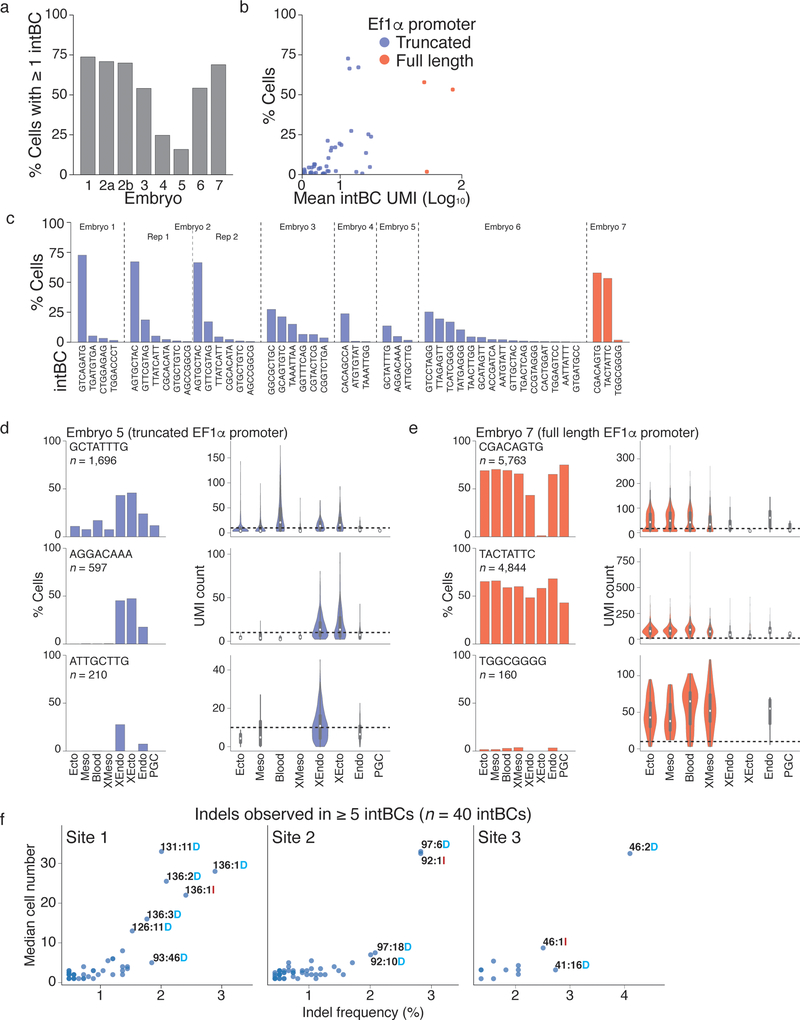
a. Percentage of cells with at least one target site captured.
b. Scatterplot showing the relationship between the mean number of unique molecular identifiers (UMIs, a proxy for expression level) sequenced per target site and the percentage of cells in which the target site is detected, which we refer to as “target site capture.” Generally, as the mean number of UMIs increases, the percentage of cells also increases. Using a fullx length, intron-containing Ef1a promoter in mouse embryos leads to a higher number of UMIs, which generally results in better target site capture.
c. Percent of cells for which a given integration barcode (intBC) is detected across all seven embryos profiled in this study.
d. Target site capture and expression level across tissues for Embryo 5, which utilizes a truncated Ef1a promoter to direct transcription of the target site. Each row corresponds to a different intBC, indicated in the top left of the histogram. (Left) The percentage of cells in each tissue for which the target site is captured. (Right) Violin plots represented the distribution of UMIs for the target site in each tissue. Dashed line refers to a 10 UMI threshold. The target site may be expressed at different levels in a tissue-specific manner, leading to higher likelihoods of capture in certain tissues. Examples such as the target sequences carrying the intBCs AGGACAAA and ATTGCTTG may also be explained by mosaic integration after the first cell cycle, as these follow a developmental logic and are preferentially expressed in extraembryonic tissues. White dot indicates the median UMI count for cells from a given germ layer, edges the interquartile range, and whiskers the full range of the data.
e. Target site capture and expression level across tissues for embryo 7, which drives the target site expression from a full length Ef1a promoter. Each row corresponds to a different intBC, indicated in the top left of the histogram. (Left) The percentage of cells in each tissue for which the target site is captured. (Right) Violin plots represented the distribution of UMIs for the target site in each tissue as in d. Dashed line is a visual threshold for 10 UMIs. While tissue specific expression may explain some discrepancy in target site capture, high expression (as estimated from number of UMIs) may still correspond to low capture rates, as observed for the intBC TGGCGGGG. One possibility is that certain indels may destabilize the transcript and lead to either poor expression or capture.
f. Scatterplots showing the relationship between estimated relative indel frequency and the median number of cells that carry the indel. Since the indel frequency within a mouse is dependent on the timing of the mutation, we cannot calculate the underlying indel frequency distribution using the fraction of cells within embryos that carry a given indel. Instead, we estimate this frequency by the presence or absence of an indel using all of the target site integrations across mice, which reduces biases from cellular expansion but still assumes that any given indel occurs only once in the history of each intBC. Since the number of integrations is small (<50), we might expect our estimates to be poor. Here we see that the number of cells marked with an indel increases with indel frequency, suggesting that our frequency estimates are under-estimated for particularly frequent indels. This is likely due to the fact that we cannot distinguish between identical indels in the same target site that may have resulted from multiple repair outcomes (convergent indels). The most frequent insertions are of a single base and tend to be highly biased towards a single nucleotide (eg. 92:1I is uniformly an “A” in 5 out of 7 embryos and never < 88%).
Extended Data Figure 5: single cell RNA-seq tissue assignment and wild type comparison.
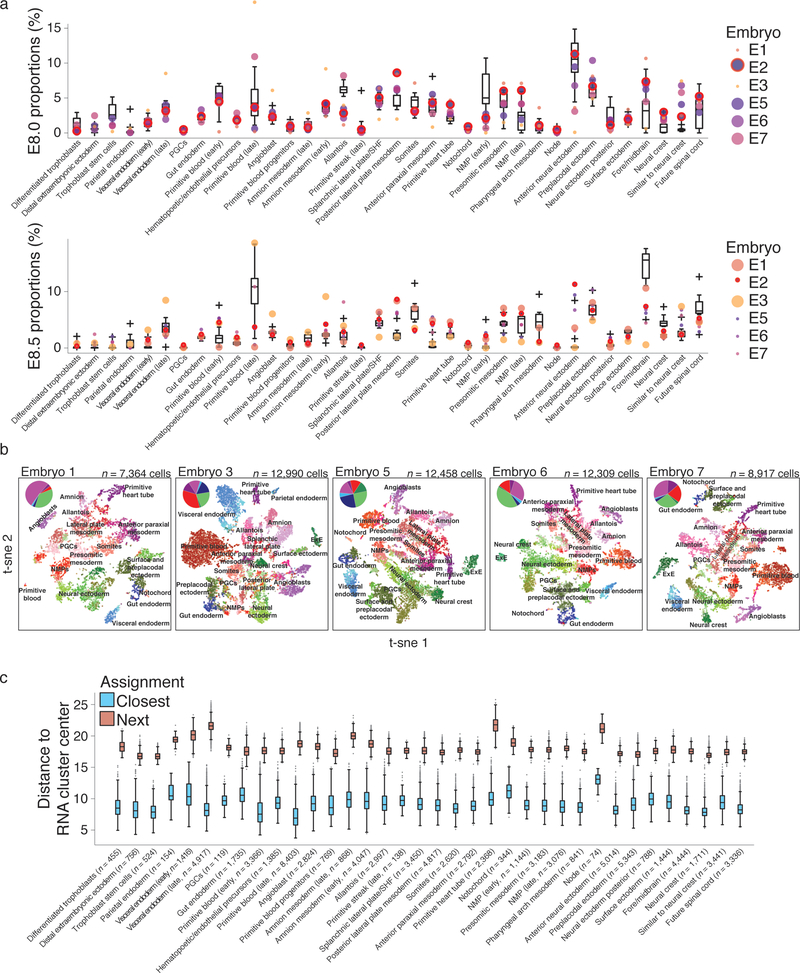
a. Boxplots representing tissue proportions from E8.0 (top) and E8.5 (bottom) wild type embryos (n = 10 each) with lineage-traced embryos mapping to each state overlaid as dots. Wild type embryos display large variance in the proportions of certain tissues and our lineage-traced embryos generally fall within the range of those recovered from wild type. Large circles indicate embryos that were scored as either E8.0 or E8.5, respectively, and the bold red overlay highlights embryo 2, which is used throughout the text. Note that many processes are continuous or ongoing between E8.0 to E8.5, such as somitogenesis and neural development. For example, from E8.0 to E8.5, the embryonic proportions of anterior neural ectoderm and fore/midbrain are inversely correlated as one cell type presumably matures into the other. Many of our embryos scored as E8.0 exhibit intermediate proportions for both tissue types, supporting the possibility that these embryos are somewhat less developed than E8.5 but more developed than E8.0. For boxplots, center line indicates the median, edges the interquartile range, whiskers the Tukey Fences, and crosses the outliers.
b. Plots (t-sne) of single cell RNA-seq with corresponding tissue annotations for the six lineage traced embryos used in this study. (Inset) Pie chart of the relative proportions for different germ layers. Mesoderm is further separated to include blood (red). While 36 different states are observed during this developmental interval, only broad classifications of certain groups (eg. “neural ectoderm” or “lateral plate mesoderm”) are overlaid to provide a frame of reference. In general, the relative spacing and coherence of different cell states are consistent across different embryos.
c. Boxplots of the Euclidean distance between single cell transcriptomes and the average transcriptional profile of their assigned cluster (cluster center) in comparison to their distance from the average of the next closest possible assignment. Comparison is to the same 712 informative marker genes used to assign cells to states and includes all cells used in this study. Middle bar highlights the median, edges the interquartile range, whiskers the Tukey Fences, and grey dots the outliers. N’s refer to the cumulative number of cells assigned to each state across all 7 embryos for which single cell data was collected, including for embryo 4.
Extended Data Figure 6: Continuous indel generation by breeding.
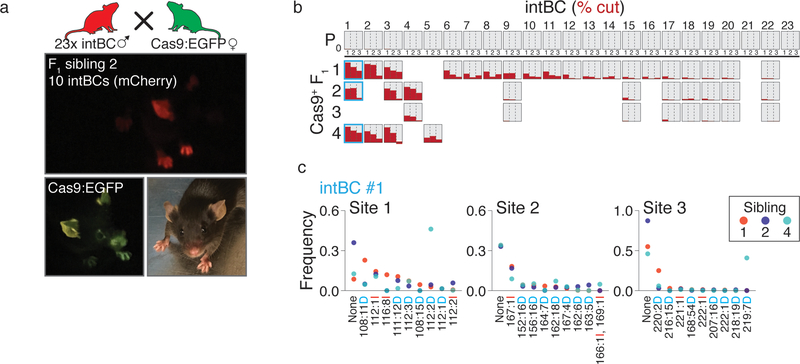
a. Strategy for generating lineage traced mice through breeding. The target site and guide array cassette are integrated into mouse zygotes as in Figure 2a using C57Bl/6J sperm to generate P0 breeder mice, which are capable of transmitting high copy genomic integrations of the technology. Then, P0 animals are crossed with homozygous, constitutively expressing Cas9 transgenic animals to enable continuous cutting from fertilization onwards in F1 progeny. Shown is Sibling 2 of a cross between a P0 male and a Cas9:EGFP female.
b. Bar charts showing the degree of mutation (% cut, red) for a P0 male (top row) and 4 F1 offspring generated by breeding with a Cas9:EGFP female prior to weaning (21 days post partum). Each row represents a mouse and each column represents a target site. Each sibling inherits its own subset of the 23 parental target site integrations, and demonstrates different levels of mutation throughout gestation and maturation.
c. Indel frequencies for the 10 most frequent indels from 3 siblings in a common target site integration (column 1 in b). Each mouse shows a large diversity of indels and the different frequencies observed in each animal demonstrates an independent mutational path.
Extended Data Figure 7: Performance of tree building algorithms used on embryonic data.
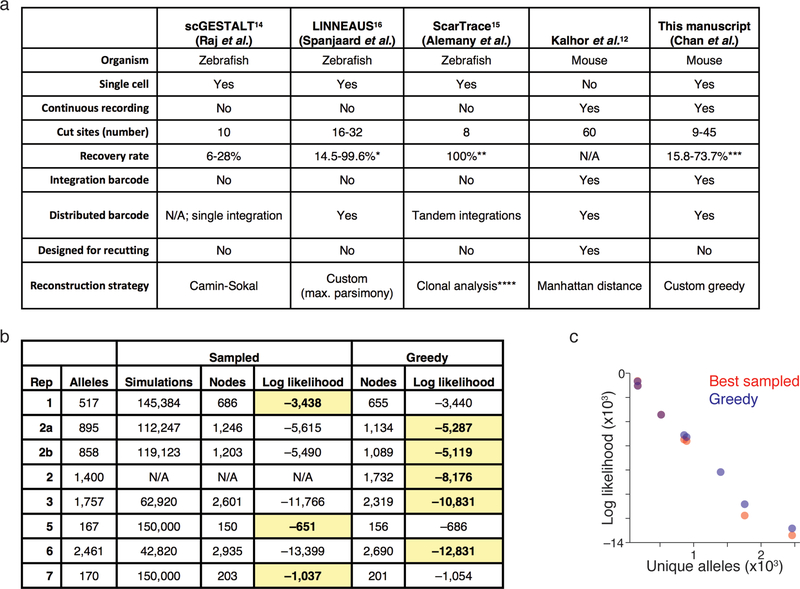
a. Table summarizing contemporary Cas9-based lineage tracers that have been applied to vertebrate development highlighting attributes that differ between the studies. Refer to Methods for a more detailed overview of key characteristics of our technology. * Study reports the average fraction recovered by tissue for integrations that cannot be distinguished, such that percentages reported here are effectively equivalent to our “≥1 intBC” metric. ** Reports a plate-based DNA-sequencing approach that can be applied to all methods to improve target site recovery. *** Range of cells where at least one intBC is confidently detected and scored. **** Presents a tree reconstruction method, but results predominantly on clonal analysis.
b. Table of allele complexity, number of nodes, and log-likelihood scores for embryos. Tree likelihoods are calculated using indel frequencies estimated from all embryo data (see Extended Data Figure 5 and Methods). Bold scores indicate the reconstruction algorithm selected for each embryo (see Figure 4, and Extended Data Figures 8 and 9).
c. Log likelihood of trees generated using either the greedy or biased sampling approach as a function of complexity, which is measured as the number of unique alleles. There is near equivalent performance of the two algorithms for low complexity embryos, but the greedy algorithm produces higher likelihood trees for embryos with larger numbers of unique alleles.
Extended Data Figure 8: Single cell lineage reconstruction of early mouse development for embryo 6.
a. Reconstructed lineage tree comprised of 2,690 nodes generated from our most information-dense embryo (embryo 6), which we used to compare shared progenitor scores with embryo 2 in Figure 4d. Each branch represents an independent indel generation event, and each node contains a pie chart of the germ layer proportions for the cells contained within it (colors are as in Figure 3b).
b. Example paths from root to leaf from the selected tree (highlighted by color). Cells for each node in the path are overlaid onto the t-sne representation in Extended Data Figure 5, with the tissue proportion at each node in the tree included as a pie chart. In the top most path (pink), the lineage bifurcates into two independently fated progenitors that either generate mesoderm (secondary heart field/splanchnic plate mesoderm and primitive heart tube) or neural ectoderm (anterior neural ectoderm and neural crest). Note that the middle path (green) also represents an earlier bifurcation from the same tree and eventually produces neural ectoderm (neural crest and future spinal cord). These paths begin with a pluripotent node that can generate visceral endoderm but subsequently lose this potential. Alternatively, the bottom path (dark blue) begins in an equivalently pluripotent state but becomes restricted towards the extraembryonic visceral endoderm fate.
c. Violin plots representing the relationship between lineage and expression for individual pairs of cells as calculated for embryo 2 in Figure 4c. Expression Pearson correlation decreases with increasing lineage distance, showing that closely related cells are more likely to share function. Red dot highlights the median, edges the interquartile range, and whiskers the full range.
d. Comprehensive clustering of shared progenitor scores for Embryo 6, which has the greatest number of unique alleles and samples multiple extraembryonic tissues. Shared progenitor score is calculated as the sum of shared nodes between cells from two tissues normalized by the number of additional tissues that are also produced (a shared progenitor score is calculated as 2−(n−1) where n is the number of clusters present within that node). In general, extraembryonic tissues that are specified before implantation, such as extraembryonic endoderm or ectoderm, co-cluster away from embryonic tissues and within their own groups, while the amnion and allantois of the extraembryonic mesoderm cluster with other mesodermal products of the posterior primitive streak. The co-clustering of anterior paraxial mesoderm and somites may reflect the continuous nature of somitogenesis from presomitic mesoderm during this period, with production of only the most anterior somites by E8.5. Note that the gut endoderm cluster has been further portioned according to embryonic or extra embryonic lineage (see Figure 5).
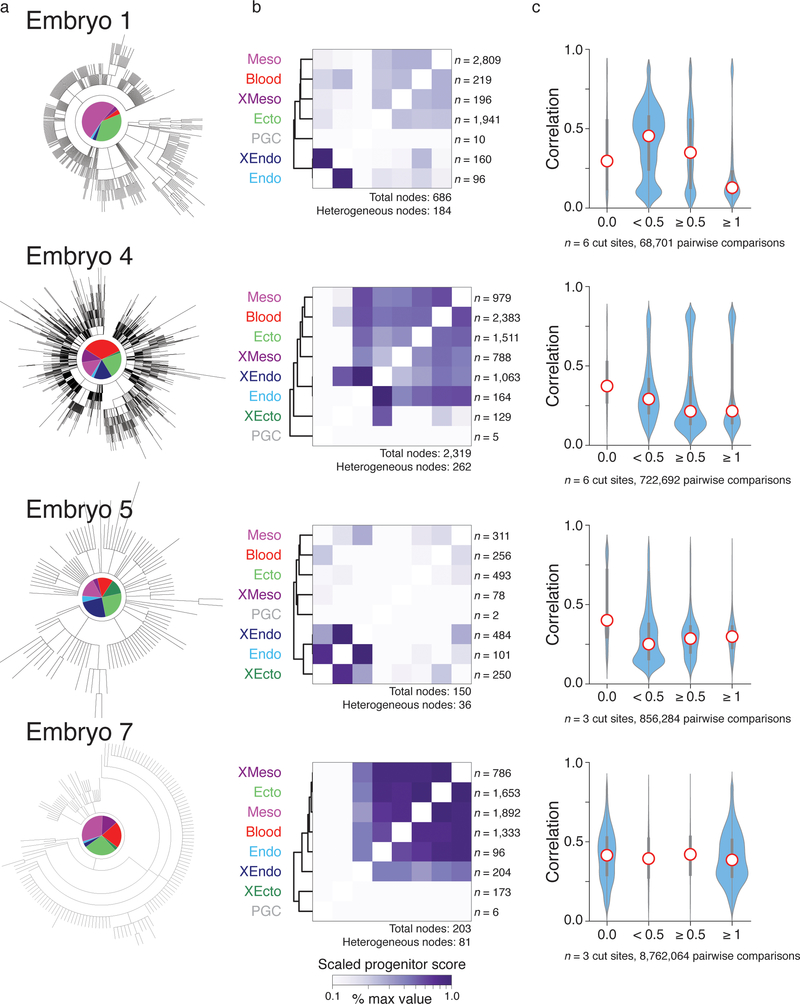
Extended Data Figure 9: Summary of results from additional mouse embryos.
Representative highest likelihood tree analyses for additional embryos, including:
a. Reconstructed trees as shown in Figure 4a.
b. Shared progenitor score heatmaps as shown in Figure 5a, normalized to the highest score for each embryo to account for differences in total node numbers. Here, the shared progenitor score is calculated as the number of nodes that are shared between tissues scaled by the number of number of tissues within each node (a shared score is calculated as 2−(n−1) where n is the number of clusters present within that node). In general, clustering of shared progenitors is recapitulated across embryos, with mesoderm and ectoderm sharing the highest relationship and either extra-embryonic ectoderm or extra-embryonic endoderm representing the most deeply rooted and distinct outgroup, though these scores are sensitive to the number of target sites and the rate of cutting. By shared progenitor, PGCs are also frequently distant from other embryonic tissues, but this often reflects the rarity of these cells, which restricts them to only a few branches of the tree in comparison to more represented germ layers. The number of heterogeneous nodes from which scores are derived is included for each heatmap.
c. Violin plots representing the pairwise relationship between lineage distance and transcriptional profile as shown for embryo 2 in Figure 4c. Lineage distance is calculated using a modified Hamming distance and transcriptional similarity by Pearson correlation. The exact dynamic range for lineage distance depends on the number of intBCs included and the cutting rate of the three guide array. Here, distances are binned into perfect (0), close (0 > x >0.5), intermediate ( 0.5 ≤ x < 1), and distant (x ≥ 1) relationships for all cells containing either 3 or 6 cut sites, depending on the embryo. As lineage distance increases, transcriptional similarity decreases, consistent with functional restriction over development. Red dot highlights the median, edges the interquartile range, and whiskers the full range.
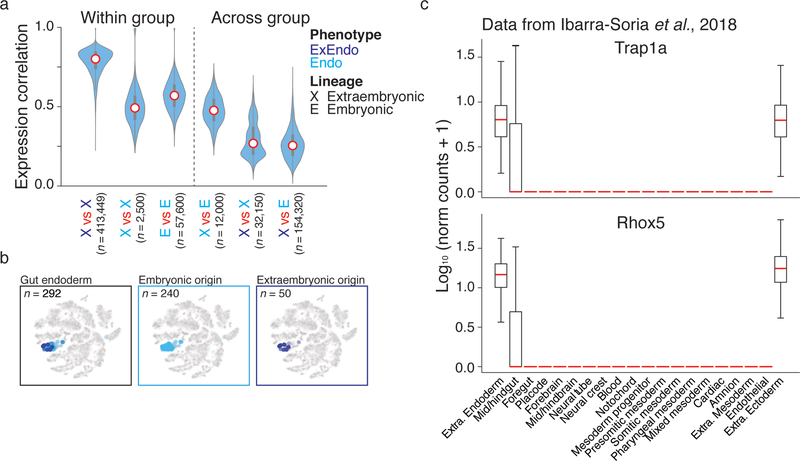
Extended Data Figure 10: Expression characteristics of extra-embryonic and embryonic endoderm.
a. Violin plots representing the pairwise scRNA-seq Pearson correlation coefficients for within or across group comparisons according to lineage (X, extra-embryonic; E, embryonic) and cluster assignment (light blue, gut endoderm; dark blue, visceral endoderm). Within group comparisons for cells with the same lineage and transcriptional cluster identity are shown on the left, while across group comparisons are presented on the right. Notably, extraembryonic cells with gut endoderm identities show higher pairwise correlations to embryonic cells with gut endoderm identities (column 4) than they do to visceral endoderm cells, with which they share a closer lineage relationship (column 5). Red dot highlights the median, edges the interquartile range, and whiskers the full range.
b. Plots (t-sne) of scRNA-seq data for embryo 2, with gut endoderm cells highlighted. Endoderm cells segregate from the rest of the embryo, and cannot be distinguished by embryonic (light blue) or extraembryonic (dark blue) origin.
c. Expression boxplots for the extra-embryonic markers Trap1a and Rhox5 from an independent single cell RNA-seq survey of E8.25 embryos (Ibarra-Soria et al., 2018, Ref 9). Both genes are heterogeneously present in cells identified as mid/hindgut but uniformly present in canonical extra-embryonic tissues, consistent with a subpopulation of cells of extra-embryonic origin residing within this otherwise embryonic cluster. Red lines highlights the median, edges the interquartile range, and whiskers the Tukey Fence. Outliers were removed for clarity.
Supplementary Material
Acknowledgments
We would like to thank members of the Weissman, Meissner, and Yosef labs, particularly J. Charlton and A. Arczewska for assistance with animal imaging, A. Kumar for explorations of extraembryonic endoderm, and L. Gilbert and M. Horlbeck for guidance on technology design, as well as Eric Chow and Derek Bogdanoff from the UCSF Center for Advanced Technology for sequencing. This work was funded by National Institutes of Health Grants R01 DA036858 and 1RM1 HG009490-01 (J.S.W.), P50 HG006193 and R01 HD078679 (A.M.), F32 GM116331 (M.J.), and F32 GM125247 (J.J.Q), and Chan-Zuckerberg Initiative 2018-184034. J.S.W. is a Howard Hughes Medical Institute Investigator. M.M.C. is a Gordon and Betty Moore fellow of the Life Sciences Research Foundation. T.M.N. is a fellow of the Damon Runyon Cancer Research Foundation. S.G., H.K., and A.M. are supported by the Max Planck Society.
Footnotes
The authors declare no competing interests.
Code availability
The greedy reconstruction algorithm (Cassiopeia) is available on Github (https://github.com/YosefLab/Cassiopeia). Other code will be shared upon request.
References
- 1.Sulston JE, Schierenberg E, White JG & Thomson JN The embryonic cell lineage of the nematode Caenorhabditis elegans. Developmental Biology 100, 64–119 (1983). [DOI] [PubMed] [Google Scholar]
- 2.Pijuan-Sala B, Guibentif C. & Göttgens B. Single-cell transcriptional profiling: a window into embryonic cell-type specification. Nat. Rev. Mol. Cell Biol 19, 399–412 (2018). [DOI] [PubMed] [Google Scholar]
- 3.Zernicka-Goetz M. Patterning of the embryo: the first spatial decisions in the life of a mouse. Development 129, 815–829 (2002). [DOI] [PubMed] [Google Scholar]
- 4.Fincher CT, Wurtzel O, de Hoog T, Kravarik KM & Reddien PW Cell type transcriptome atlas for the planarian Schmidtea mediterranea. Science 360, eaaq1736 (2018). [DOI] [PMC free article] [PubMed] [Google Scholar]
- 5.Plass M. et al. Cell type atlas and lineage tree of a whole complex animal by single-cell transcriptomics. Science 360, eaaq1723 (2018). [DOI] [PubMed] [Google Scholar]
- 6.Briggs JA et al. The dynamics of gene expression in vertebrate embryogenesis at single-cell resolution. Science 360, eaar5780 (2018). [DOI] [PMC free article] [PubMed] [Google Scholar]
- 7.Farrell JA et al. Single-cell reconstruction of developmental trajectories during zebrafish embryogenesis. Science 360, eaar3131 (2018). [DOI] [PMC free article] [PubMed] [Google Scholar]
- 8.Wagner DE et al. Single-cell mapping of gene expression landscapes and lineage in the zebrafish embryo. Science 360, 981–987 (2018). [DOI] [PMC free article] [PubMed] [Google Scholar]
- 9.Ibarra-Soria X. et al. Defining murine organogenesis at single-cell resolution reveals a role for the leukotriene pathway in regulating blood progenitor formation. Nat. Cell Biol 20, 127–134 (2018). [DOI] [PMC free article] [PubMed] [Google Scholar]
- 10.Han X. et al. Mapping the Mouse Cell Atlas by Microwell-Seq. Cell 172, 1091–1107.e17 (2018). [DOI] [PubMed] [Google Scholar]
- 11.Perli SD, Cui CH & Lu TK Continuous genetic recording with self-targeting CRISPR-Cas in human cells. Science 353, aag0511–aag0511 (2016). [DOI] [PubMed] [Google Scholar]
- 12.Kalhor R. et al. Developmental barcoding of whole mouse via homing CRISPR. Science 361, eaat9804 (2018). [DOI] [PMC free article] [PubMed] [Google Scholar]
- 13.Frieda KL et al. Synthetic recording and in situ readout of lineage information in single cells. Nature 541, 107–111 (2017). [DOI] [PMC free article] [PubMed] [Google Scholar]
- 14.Raj B. et al. Simultaneous single-cell profiling of lineages and cell types in the vertebrate brain. Nat. Biotechnol 36, 442–450 (2018). [DOI] [PMC free article] [PubMed] [Google Scholar]
- 15.Alemany A, Florescu M, Baron CS, Peterson-Maduro J. & van Oudenaarden A. Whole-organism clone tracing using single-cell sequencing. Nature 556, 108–112 (2018). [DOI] [PubMed] [Google Scholar]
- 16.Spanjaard B. et al. Simultaneous lineage tracing and cell-type identification using CRISPR-Cas9-induced genetic scars. Nat. Biotechnol 36, 469–473 (2018). [DOI] [PMC free article] [PubMed] [Google Scholar]
- 17.Tanay A. & Regev A. Scaling single-cell genomics from phenomenology to mechanism. Nature 541, 331–338 (2017). [DOI] [PMC free article] [PubMed] [Google Scholar]
- 18.Adamson B. et al. A Multiplexed Single-Cell CRISPR Screening Platform Enables Systematic Dissection of the Unfolded Protein Response. Cell 167, 1867–1882.e21 (2016). [DOI] [PMC free article] [PubMed] [Google Scholar]
- 19.van Overbeek M. et al. DNA Repair Profiling Reveals Nonrandom Outcomes at Cas9-Mediated Breaks. Mol. Cell 63, 633–646 (2016). [DOI] [PubMed] [Google Scholar]
- 20.Schimmel J, Kool H, van Schendel R. & Tijsterman M. Mutational signatures of non-homologous and polymerase theta-mediated end-joining in embryonic stem cells. EMBO J. 36, 3634–3649 (2017). [DOI] [PMC free article] [PubMed] [Google Scholar]
- 21.Lemos BR et al. CRISPR/Cas9 cleavages in budding yeast reveal templated insertions and strand-specific insertion/deletion profiles. Proc. Natl. Acad. Sci. U.S.A 115, E2040–E2047 (2018). [DOI] [PMC free article] [PubMed] [Google Scholar]
- 22.Gilbert LA et al. Genome-Scale CRISPR-Mediated Control of Gene Repression and Activation. Cell 159, 647–661 (2014). [DOI] [PMC free article] [PubMed] [Google Scholar]
- 23.Ihry RJ et al. p53 inhibits CRISPR-Cas9 engineering in human pluripotent stem cells. Nat. Med 337, 816 (2018). [DOI] [PubMed] [Google Scholar]
- 24.Haapaniemi E, Botla S, Persson J, Schmierer B. & Taipale J. CRISPR-Cas9 genome editing induces a p53-mediated DNA damage response. Nat. Med 19, 1 (2018). [DOI] [PubMed] [Google Scholar]
- 25.Kim S-Y, Lee J-H, Shin H-S, Kang H-J & Kim Y-S The human elongation factor 1 alpha (EF-1 alpha) first intron highly enhances expression of foreign genes from the murine cytomegalovirus promoter. J. Biotechnol 93, 183–187 (2002). [DOI] [PubMed] [Google Scholar]
- 26.Butler A, Hoffman P, Smibert P, Papalexi E. & Satija R. Integrating single-cell transcriptomic data across different conditions, technologies, and species. Nat. Biotechnol 36, 411–420 (2018). [DOI] [PMC free article] [PubMed] [Google Scholar]
- 27.Kwon GS, Viotti M. & Hadjantonakis A-K The endoderm of the mouse embryo arises by dynamic widespread intercalation of embryonic and extraembryonic lineages. Dev. Cell 15, 509–520 (2008). [DOI] [PMC free article] [PubMed] [Google Scholar]
- 28.Eakin GS & Hadjantonakis A-K Sex-specific gene expression in preimplantation mouse embryos. 7, 205 (2006). [DOI] [PMC free article] [PubMed] [Google Scholar]
- 29.Li C-S et al. Trap1a is an X-linked and cell-intrinsic regulator of thymocyte development. Cell. Mol. Immunol 14, 685–692 (2017). [DOI] [PMC free article] [PubMed] [Google Scholar]
- 30.Pijuan-Sala B. et al. A single-cell molecular map of mouse gastrulation and early organogenesis. Nature 566, 490–495 (2019). [DOI] [PMC free article] [PubMed] [Google Scholar]
- 31.Soriano P. & Jaenisch R. Retroviruses as probes for mammalian development: allocation of cells to the somatic and germ cell lineages. Cell 46, 19–29 (1986). [DOI] [PubMed] [Google Scholar]
- 32.Jaenisch R. Mammalian neural crest cells participate in normal embryonic development on microinjection into post-implantation mouse embryos. Nature 318, 181–183 (1985). [DOI] [PubMed] [Google Scholar]
- 33.Nichols J. & Smith A. Naive and primed pluripotent states. Cell Stem Cell 4, 487–492 (2009). [DOI] [PubMed] [Google Scholar]
- 34.Wang Z. & Jaenisch R. At most three ES cells contribute to the somatic lineages of chimeric mice and of mice produced by ES-tetraploid complementation. Developmental Biology 275, 192–201 (2004). [DOI] [PubMed] [Google Scholar]
- 35.Baeumler TA, Ahmed AA & Fulga TA Engineering Synthetic Signaling Pathways with Programmable dCas9-Based Chimeric Receptors. Cell Rep 20, 2639–2653 (2017). [DOI] [PMC free article] [PubMed] [Google Scholar]
- 36.Komor AC, Kim YB, Packer MS, Zuris JA & Liu DR Programmable editing of a target base in genomic DNA without double-stranded DNA cleavage. Nature 533, 420–424 (2016). [DOI] [PMC free article] [PubMed] [Google Scholar]
- 37.Hess GT et al. Directed evolution using dCas9-targeted somatic hypermutation in mammalian cells. Nat. Methods 13, 1036–1042 (2016). [DOI] [PMC free article] [PubMed] [Google Scholar]
- 38.Hou J. et al. A systematic screen for genes expressed in definitive endoderm by Serial Analysis of Gene Expression (SAGE). BMC Dev. Biol 7, 92 (2007). [DOI] [PMC free article] [PubMed] [Google Scholar]
- 39.Wang G, Moffitt JR & Zhuang X. Multiplexed imaging of high-density libraries of RNAs with MERFISH and expansion microscopy. Sci Rep 8, 4847 (2018). [DOI] [PMC free article] [PubMed] [Google Scholar]
- 40.Shah S, Lubeck E, Zhou W. & Cai L. In Situ Transcription Profiling of Single Cells Reveals Spatial Organization of Cells in the Mouse Hippocampus. Neuron 92, 342–357 (2016). [DOI] [PMC free article] [PubMed] [Google Scholar]
- 41.Regev A. et al. The Human Cell Atlas. Elife 6, 503 (2017). [DOI] [PMC free article] [PubMed] [Google Scholar]
- 42.Tzouanacou E, Wegener A, Wymeersch FJ, Wilson V. & Nicolas J-F Redefining the progression of lineage segregations during mammalian embryogenesis by clonal analysis. Dev. Cell 17, 365–376 (2009). [DOI] [PubMed] [Google Scholar]
Associated Data
This section collects any data citations, data availability statements, or supplementary materials included in this article.


