Abstract
Electron paramagnetic resonance (EPR) has become an important tool to probe conformational changes in nucleic acids. An array of EPR labels for nucleic acids are available, but they often come at the cost of long tethers, are dependent on the presence of a particular nucleotide or can be placed only at the termini. Site directed incorporation of Cu2+-chelated to a ligand, 2,2′dipicolylamine (DPA) is potentially an attractive strategy for site-specific, nucleotide independent Cu2+-labelling in DNA. To fully understand the potential of this label, we undertook a systematic and detailed analysis of the Cu2+-DPA motif using EPR and molecular dynamics (MD) simulations. We used continuous wave EPR experiments to characterize Cu2+ binding to DPA as well as optimize Cu2+ loading conditions. We performed double electron-electron resonance (DEER) experiments at two frequencies to elucidate orientational selectivity effects. Furthermore, comparison of DEER and MD simulated distance distributions reveal a remarkable agreement in the most probable distances. The results illustrate the efficacy of the Cu2+-DPA in reporting on DNA backbone conformations for sufficiently long base pair separations. This labelling strategy can serve as an important tool for probing conformational changes in DNA upon interaction with other macromolecules.
INTRODUCTION
DNA dynamics is an important factor that affects numerous cellular processes mediated by protein–DNA interactions (1–5). Often, upon interaction with a protein at specific sites, structural changes in the DNA such as bending, or twisting are induced within the DNA. The flexibility of the DNA duplex and its ability to adapt its shape are crucial for triggering countless cellular activities such as transcription (6), replication (7) and gene regulation (8). Often due to the large size of protein–DNA complexes, low solubility and timescale of conformational changes, these processes are inaccessible to NMR and crystallographic techniques. On the other hand, electron paramagnetic resonance (EPR) techniques have become an invaluable method to probe conformational changes in such cases. Particularly, when two or more spins are present, pulsed EPR techniques can be employed to obtain point-to-point distances within a macromolecule. Such distance constraints in conjunction with the available structures of the macromolecule can be used to model the conformations of the macromolecule in the different functional states (9–17).
To implement pulsed EPR techniques for distance measurements, one needs to incorporate two or more spin labels at specific sites in the DNA. To this end, a wide variety of spin labels have been developed for nucleic acids (18,19). These methods include modification of the nucleobase (20–28), backbone (29–32) or terminal capping (33,34). Nitroxide based labels, particularly the cytidine analogue, Ç, (35–37) provide extremely rigid distance distributions as well as information on label orientation (38–40). These two pieces of information together have proven to be capable of reporting on inherent DNA motions in even small systems such as the cocaine aptamer (41). Radicals, such as the triarylmethyl (TAM) spin label, often attached at the oligonucleotide termini, have been used to demonstrate distance measurements in nucleic acids at physiological temperatures (42,43). Sterically shielded nitroxide labels, introduced post-synthetically, (32) and non-covalently bonded nitroxide labels, attached to an abasic site (44), that position the label closer to or within the helix have also been developed. Chelation of paramagnetic metal ions such as Gd3+, Mn2+ or Cu2+ (45–48) has been introduced as an alternative labelling methodology. Despite the success of such labelling strategies, there is a need for labelling schemes that are nucleotide independent, can be positioned anywhere within the DNA, and are small enough to reside within the helix.
Recently, we reported a Cu2+ based labelling method as a promising strategy to measure DNA backbone distances (49). The method involves the incorporation of a Cu2+-chelating ligand, a 2,2′-dipicolylamine (DPA) phosphoramidite, at two specific sites in the DNA duplex. This strategy introduces an abasic site (dSpacer) opposing the DPA in the complementary strand. While other methods may require specific secondary structures (45) or use labels with elongated tethers that place the reporter on the exterior of the DNA (50), the DPA-DNA method is structure-independent and positions the probe in close proximity to the DNA backbone. Furthermore, the label is also nucleotide independent and can be positioned anywhere within the DNA molecule. In the initial work, a most probable distance of 2.7 nm was measured with the Cu2+-DPA motifs separated by 8 bp. This distance was in good agreement with both the distance calculated using the known values of base-pair separation for a B-DNA and with corresponding molecular dynamic simulations. This reported distance was resolved using a single measurement without the need of any post-experiment analysis.
In this work, we provide a comprehensive analysis of the Cu2+-DPA motif. First, we performed continuous-wave EPR measurements to analyse the specificity of Cu2+ towards the DPA motif and to rule out any possibility of non-specific binding elsewhere on the DNA molecule. Second, we obtained systematic distance measurements using double electron-electron resonance (DEER) technique to probe the flexibility of the Cu2+-DPA motif. These measurements were performed at both Q-band and X-band frequencies over several magnetic fields to probe any orientation effects. Third, we performed molecular dynamics (MD) simulations on an unmodified DNA sequence to provide insight on how the distance measured using the Cu2+-DPA motif compares to the native DNA backbone. Finally, we used a physical model that depicts the DNA motion, to estimate the flexibility of the Cu2+-DPA label. Together, these efforts show that the Cu2+-DPA motif is a highly promising labelling technique that can be used to probe DNA conformations without the need of any extensive modelling.
MATERIALS AND METHODS
Oligonucleotides
Single-strand oligonucleotides containing 2,2′-dipicolylamine (DPA) were obtained from either Trilink Biotechnologies (duplex with eight base pair separation between DPA sites) or ATDBio Ltd. (duplexes with 9–12 bp separations). The suppliers purified the strands using high performance liquid chromatography and characterized using mass spectrometry (Supplementary Figure S1). The control unmodified DNA duplex was purchased from Integrated DNA Technologies (IDT).
Equal amounts of complementary DNA strands were mixed and CuCl2 were added such that there were slightly less than stoichiometric equivalents of Cu2+ per DPA binding site (∼0.94 equivalents of Cu2+ per DPA). Duplexes were annealed in the presence of CuCl2 to ensure proper formation and efficient Cu2+ chelation, using a GeneAmp PCR System 9700 with the following protocol: 90°C for 1 min, 60°C for 3 min, 50°C for 4 min, 40°C for 4 min, 30°C for 5 min and then progressively cooled to 4°C. All duplexes were subjected to this annealing procedure. After annealing, the concentration of each duplex was again determined spectrophotometrically using absorptivity coefficients calculated by nearest neighbour methods (51–53). Additional details are provided in the Supplementary Information.
EPR measurements
All EPR experiments were performed on either a Bruker ElexSys E580 or ElexSys E680 CW/FT spectrometer equipped with a Bruker ER4118X-MD5 or Bruker ER4118X-MD4 resonator for X-band frequencies, respectively and Bruker ER5106-QT2 resonator for Q-band frequencies. The E680 spectrometer is also equipped with a 300 W amplifier. Experiments were performed at either X-band (∼9.68 GHz) or Q-band (∼35 GHz) frequencies. Experiments were performed at either 20 or 80 K.
X-band samples had a DNA duplex concentration ranging between 150 and 200 μM, with a total sample volume of 120 μl. Q-band sample had a DNA duplex concentration of 80 μM, with a total sample volume of 50 μl. All samples were prepared in 50 mM NEM buffer. The pH of the sample was 7.4 and 20% (v/v) glycerol was included as a cryoprotectant.
All continuous wave (CW) EPR data were acquired at 80 K. Experiments were performed at a center field of 3100 G with a sweep width of 2000 G for a total of 1024 data points. The data was collected using a modulation amplitude of 4 G, a modulation frequency of 100 kHz and a conversion time of 20.48 ms. The spectra were simulated using the EasySpin software (54).
Double electron-electron resonance (DEER) spectroscopy experiments were performed using the four pulse sequence (π/2)ν1 – τ1 – (π)ν1 – τ1+T – (π)ν2 – τ2-T – (π)ν1 – τ2 – echo (55). A 16-step phase cycling was used. For X-band DEER experiments, the observer pulse lengths, (π/2)ν1 and (π)ν1, were 16 and 32 ns respectively while the pump pulse length, (π)ν2, was 16 ns. The delay, T, was incremented using step sizes that varied from 8 up to 28 ns, depending on the DPA base pair separation. The pump frequency was placed at the maximum of the echo detected field swept spectrum, and the observer frequency was offset 100 MHz downfield. To probe orientational selectivity effects at X-band, we also performed DEER experiments with the pump frequency placed at the field corresponding to the g‖ region and the observer frequency was offset by 100 MHz upfield. For Q-band DEER experiments, the observer pulse lengths, (π/2)ν1 and (π)ν1 were 14 and 28 ns respectively and the pump pulse, (π)ν2 was 32 ns. The observer frequency was set 100 MHz higher in frequency than the pump. The delay, T, was incremented with a step size of 24 ns. DEER spectra were acquired from 11220 G to 11820 G at eight different magnetic field values. All DEER data were collected at 20 K. All DEER data were analysed using DeerAnalysis2018 (56).
Molecular dynamics simulations
Molecular dynamics (MD) simulations on the DNA duplex were performed using the AMBER parmbsc1 (bsc1) (57) force field. The Nucleic Acid Builder (NAB) module in the AMBER suite (58) was used to construct the B-DNA helix. The DNA duplex was then solvated in an explicit 12 Å TIP3P water box (59) and neutralized with Na+ and Cl− ions. All simulations were performed using the pmemd program in the AMBER16 software package. The system was optimized, thermalized and pre-equilibrated for 2 ns before being set up for the unrestrained production MD run of 100 ns at 298.15 K. Periodic boundary conditions along with particle mesh ewald (PME) (60) were applied to account for long-range electrostatic interactions under NPT (P = 1 atm) conditions. SHAKE (61) on bonds involving hydrogens was used in conjunction with an integration step of 2 fs. A non-bonded cut-off of 10 Å was applied. All visualizations for simulations were done on VMD (62). From the MD trajectories, distances were measured between the two C4′ as well as the two C3′ carbon atoms of the nucleotides that were replaced by DPA in the experiment.
RESULTS AND DISCUSSION
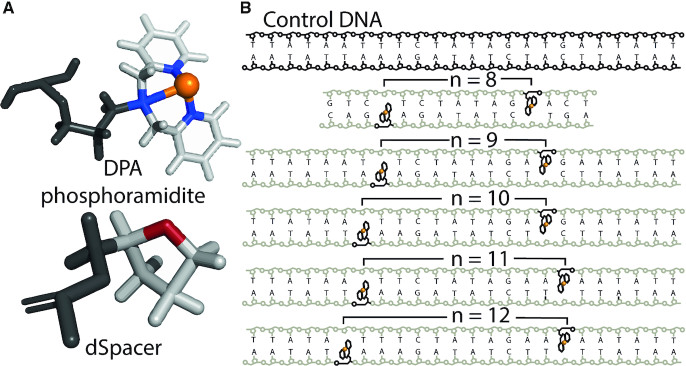
In this work, we examined five DPA-DNA duplexes. The structures of Cu2+-DPA and dSpacer and the sequences of the DNA duplexes are shown in Figure 1. Each DNA duplex has two DPA phosphoramidites incorporated within the helix, one on each strand. A dSpacer (tetrahydrofuranyl residue mimicking the sugar phosphate backbone without a base) opposes the DPA on the complementary strand. The separation of the DPA motifs is monotonically increased in each DNA duplex by increasing the base pair separation (n) between them. All DNA constructs are heteroduplexes formed from single strands with non-palindromic sequences to prevent the chance of base-pairing within the same DNA strand.
Figure 1.
(A) Structures of the Cu2+ incorporated DPA phosphoramidite and the dSpacer. (B) Sequences of the control DNA and the DPA-DNA duplexes with different base pair separation, n.
Results have been previously reported for a 15-nucleotide DNA duplex with a base pair separation, n of 8 (49), between the DPA sites. In the n = 8 duplex, as shown in Figure 1B, the Cu2+-binding site was flanked by only three bases. Because of the occurrence of slight unwinding at the ends of DNA duplexes, such unwinding proximal to the DPA-motif can increase the distribution of distances reported by the DPA-motif. In this paper, the DPA motifs are flanked by at least 6 bp, thus reducing influence from terminal unwinding. Circular dichroism measurements of DPA–DNA and melting temperatures have previously shown that incorporation of the DPA motif inside the DNA duplex does not perturb the native helical structure of the DNA, nor does it influence the helical stability (49). Thus, the Cu2+-DPA motif is suitable for probing intra-DNA distances.
Characterization of Cu2+ bound to DPA-DNA
To promote full solvent accessibility of the Cu2+ ion to the DPA chelating site, we annealed the individual strands of the DNA in the presence of Cu2+. The temperature of the samples was raised to 95°C and incrementally brought down to 4°C as described in the Experimental section. Cu2+ shows high binding affinity to a DPA ligand with an apparent association constant, Ka of (5.0 ± 2.0) × 106 M−1 in NEM buffer at pH of 7.4 (63). On the other hand, Cu2+ also shows affinity towards native DNA with a Ka of 2.4 × 10⁴ M−1 (64) and particularly to the purine bases adenine and guanine, with a Ka of 1.7 × 10³ M−1 (49,65). We, therefore, added a slightly sub-stoichiometric equivalent of Cu2+ (∼0.94 equivalents of Cu2+ per DPA) to maximize loading of the DPA sites without causing non-specific binding elsewhere.
To verify that Cu2+ binds specifically to DPA, we first performed CW EPR experiments on a Cu2+-DPA-DNA duplex (n = 11). Figure 2A (solid line) shows the CW spectrum of the Cu2+-bound DPA-DNA duplex. We observed only a single component spectrum. Note that free unbound Cu2+ is EPR silent in NEM buffer (66,67). Further simulation of the spectrum gave a single component fit, as shown in Figure 2A, with g‖ and A‖ values of 2.240 and 170 G, respectively. The g‖ and A‖ values are consistent with a three nitrogen/one oxygen coordination (68) which corresponds to Cu2+ binding to the three nitrogen atoms of the DPA. Comparison of the spin concentration obtained from the CW-EPR data to the DNA concentration indicated a labelling efficiency of ∼80%, instead of the expected 93% from the Ka value of Cu2+ for free DPA, The Ka of Cu2+ to DPA may be slightly altered by the presence of adjacent bases in the duplex.
Figure 2.
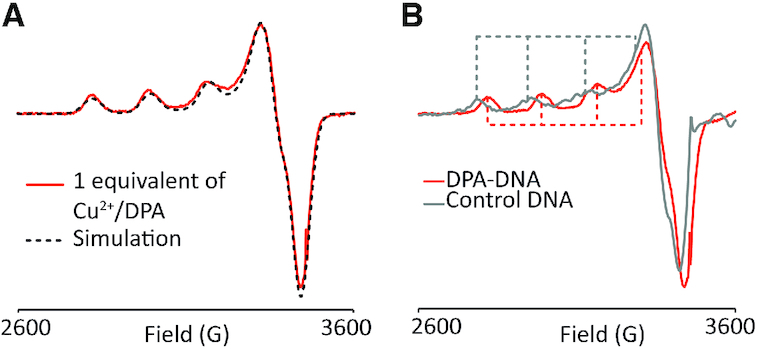
(A) CW-EPR spectrum of Cu2+ bound DPA–DNA duplex (solid line). The single component fit, with g‖ and A‖ values of 2.240 and 170 G, respectively is overlaid (black dashed). (B) Comparison of CW-EPR spectra between Cu2+ bound to control DNA (grey solid) and Cu2+ bound to DPA–DNA (red solid). The Cu2+-control DNA spectrum has g‖ and A‖ values of 2.280 and 163 G, respectively and is distinctly different from Cu2+–DPA–DNA spectrum. This confirms that there is no non-specific binding of Cu2+ in the DPA–DNA duplex.
To rule out the presence of non-specific binding in the presence of the Cu2+-DPA motif, we also performed CW measurements on a control DNA, where the DPA and dSpacer positions were replaced by adenine and thymine, respectively (cf. Figure 1B, top panel). The Cu2+ was added to the control DNA in a stoichiometric ratio. The spectrum of free DNA is distinctly different from that of DPA–DNA, as can be seen in Figure 2B. The CW spectrum of control DNA showed a single component fit with g‖ and A‖ of 2.280 and 163 G, respectively (Supplementary Figure S2). Previous measurements on the n = 8 duplex used a four-fold excess of Cu2+ to DPA which led to non-specific binding. In the current work, the data suggests that in the presence of DPA, the Cu2+ binds preferentially to the DPA moiety and that there is no interference from non-specific binding with stoichiometric or sub-stoichiometric loading (Figure 2B).
DEER measurements show no observable orientational selectivity at both X and Q-band frequencies
To probe orientational selectivity effects on the Cu2+-DPA motif, we first performed the DEER experiment on the DPA–DNA duplex with n = 11. The data were acquired at eight magnetic field values over a range of 600 G (11220 G to 11820 G) between g‖ and g⊥ regions at Q-band frequency. All primary DEER times traces were background subtracted and analysed via Tikhonov regularization using DeerAnalysis2018 (56). Figure 3A shows the field swept spectrum of Cu2+–DPA–DNA duplex and the magnetic field values at which DEER was performed. The corresponding background subtracted data is shown in Figure 3B. The primary time domain data is provided in the SI (Supplementary Figure S3).
Figure 3.
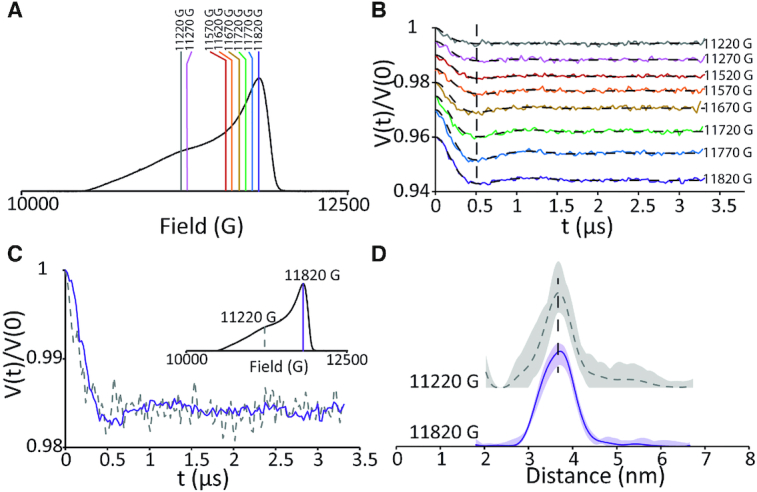
(A) Field-swept electron spin echo spectrum of Cu2+-DPA–DNA (n = 11) at Q-band frequency. The lines show the different magnetic fields at which DEER was performed. (B) Background subtracted time domain DEER signals at the different magnetic fields. The y-axis has been offset for ease of visualization. The data show minimal difference in dipolar frequency at the different fields. (C) Background subtracted time domain data at g‖ (dashed, 11220 G) and g⊥ (solid, 11820 G) regions. These two regions also do not show any distinct difference in modulation frequency, suggesting Cu2+–DPA shows minimal orientational effects. (D) Distance distribution obtained via Tikhonov regularization, for both g‖ (dashed, 11220 G) and g⊥ (solid, 11820 G) regions. The similarity in the distributions further confirms that Cu2+–DPA is not orientation selective for non-complexed DNA.
In DEER, selective excitation of the total spectrum can lead to excitation of only a small subset of all possible molecular orientations, leading to orientational selectivity effects (47,69–75). This effect can be mitigated by several factors and techniques. At X-band frequencies (9.5 GHz), most common systems such as nitroxides and Cu2+ labels have large hyperfine anisotropies relative to their g-anisotropy, which allows the mixing of orientations across the spectrum (76,77). Additionally, flexible spin labels can reduce orientation selectivity effects as the inherent flexibility effectively randomizes the selected molecular orientations. A similar effect is also observed in more rigid Cu2+ binding motifs, in which the slight flexibility of the side-chain rotamers produces a distribution in g-tensor orientations (78–80). Because orientational selectivity effects are due in part to the selective excitation, ultra-wide band pump pulses that effectively excite the entire spectrum have also shown dilution of orientational selectivity (81). As can be seen from Figure 3B, the DEER time traces display dipolar modulations with similar dipolar frequency at all magnetic fields. This consistency suggests that orientational effects are negligible for this system at different magnetic fields. Furthermore, we compare the background subtracted time domain DEER, performed at g‖ with the g⊥ regions (Figure 3C)—the modulation depth was adjusted for comparison. These regions should represent a maximal difference in the orientations excited. Again, we found minimal change in the modulation frequency of the DEER trace (Figure 3C). Consequently, the distance distribution obtained using Tikhonov regularization at the above two fields agree well within signal to noise, as shown in Figure 3D. Based on these data, we conclude that the inherent DNA flexibility along with that of the label suppresses any orientational selectivity effects in non-complexed DNA.
Since DEER performed at Q-band frequency did not show any orientation effects for Cu2+–DPA, we do not expect to see any such effects at X-band frequency. Nevertheless, we performed DEER on the same DPA–DNA duplex of n = 11 at X-band frequency at both g‖ and g⊥ regions (cf. Figure 4A). The background subtracted time domain DEER of the two regions, shown in Figure 4A, confirms that orientational effects are minimal – again the modulation depths are adjusted for comparison. Interestingly, the distance distribution analysed from the g⊥ region at X-band and that of the summed DEER signal over eight different magnetic fields at Q-band showed good agreement for the DPA-DNA duplex of n = 11 (cf. Figure 4B). Nevertheless, we also probed for orientation selectivity effects at X-band frequency for other duplexes as well. In all cases, we observed minimal change in dipolar frequency in the time domain DEER data between g‖ and g⊥ regions (Supplementary Figures S4 and S5).
Figure 4.
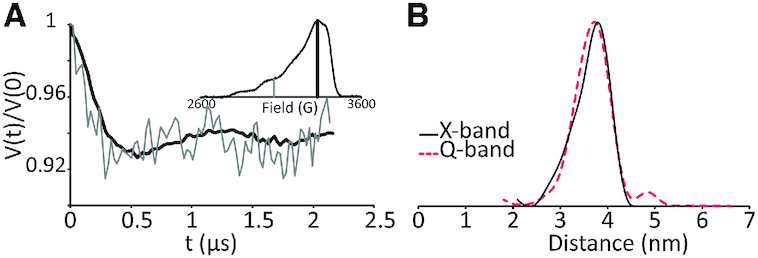
(A) Background subtracted time domain DEER signal of Cu2+–DPA–DNA (n = 11) at X-band frequency at g‖ (grey) and g⊥ (black) regions. The field corresponding to the g‖ and g⊥ regions are shown in the field-swept electron spin echo spectrum in the inset. There is no distinguishable difference in the dipolar frequency between the two data. (B) Distance distributions obtained as a sum of DEER time traces collected at different fields, ranging from g‖ and g⊥ regions at Q-band frequency (dashed red) and at g⊥region at X-band frequency (solid black). Both distributions, analysed via Tikhonov regularization, show similar most probable distance and width.
DEER measurements using Cu2+-DPA motif can probe the DNA backbone
Finally, to determine if the labelling strategy can accurately report on changes in distance upon incrementing base-pair separation, we performed DEER measurements at X-band frequency. Figure 5 shows the DEER data acquired at g⊥ on the duplexes with n ranging from 9 to 12. The data at g‖ is shown in SI for all duplexes (Supplementary Figures S4 and S5). Importantly, the absence of orientation effects was observed for all the five different spin-label positions. DEER measurement performed on duplex n = 8 has been previously reported (49) and are also used in the following discussion. The corresponding Pake patterns, clearly show that as the distance increases with n, the dipolar frequency of the modulation gradually decreases as is expected (cf. Figure 5C).
Figure 5.
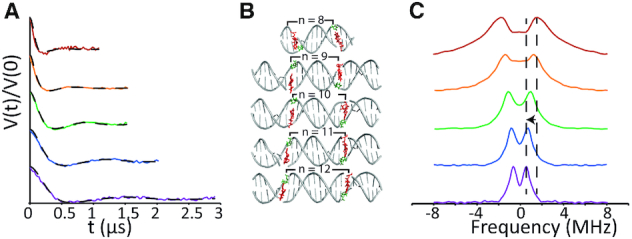
(A) Background subtracted time domain DEER data of the DPA-DNA duplexes ranging from n = 8 to 12 base pairs. The modulation frequency increases as the base pair separation increases. The y-axis has been offset for ease of visualization. (B) Duplexes showing the Cu2+-DPA and dSpacer positions for varying n. (C) Pake pattern for duplexes n = 8 to 12. The characteristic peak, corresponding to the perpendicular orientation, shows a gradual shift to a lower frequency as n increases.
We analysed the time domain DEER data with Tikhonov regularization to obtain distance distributions (Figure 6A, Supplementary Figure S6). We observed an increase in the most probable distance as the base pair separation increases from 8 to 12. Furthermore, we plotted the most probable distance against the base pair separation and observed a linear trend for a y-intercept of 0 (Figure 6B). The slope of the fit equals 0.35 nm which is in good agreement with the ∼0.34 nm separation between adjacent bases for an idealized B-DNA (82). The data (Figure 6B) show that our experimental technique reports accurately on B-DNA double helix length over the range of 8–12 bp and discerns differences in length as small as one base pair.
Figure 6.
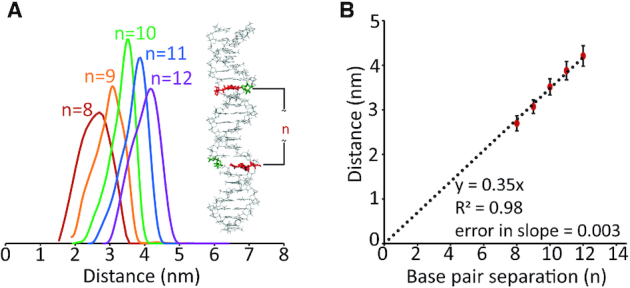
(A) Area-normalized distance distributions obtained for duplexes n = 8 to 12 via Tikhonov regularization. The distributions show an increase in the most probable distance with increasing n. (B) Plot of most probable distance versus base pair separation, n. On fitting to a linear trend with a y-intercept of 0, we obtained a slope of 0.35 nm with an error of 0.003 nm. The slope is in reasonable agreement with the reported base pair separation for a B-DNA.
MD simulations show good agreement with the most probable distance from DEER
Next, we performed MD simulations on the control unmodified DNA (cf. Figure 1B) in order to compare the measured distances to native backbone conformations. We created a DNA duplex with the same sequence as the control DNA, where the DPA and dSpacer positions are replaced by adenine and thymine, respectively. For running MD simulations, we chose the newer AMBER parmbsc1 force field as it has previously shown good agreement to EPR experimental results obtained on doubly spin labelled DNA (40,44). We generated 100 ns of unrestrained MD trajectories of the DNA duplex (Supplementary Figure S7). From the MD simulation we extracted backbone distance distributions to compare with our experimental results.
First, we determined which backbone atoms of the unmodified DNA most nearly correspond to the distance reported by the Cu2+-DPA label. We compared the structure of unmodified DNA to that of Cu2+–DPA–DNA with an 11-bp separation (Figure 7A). The backbone carbon atom of the DPA motif is represented inside the grey circle. This particular atom forms the pivotal point in the phosphoramidite to which the DPA is attached. When comparing with a normal nucleotide, we considered two possibilities: (a) when viewed from the 3′ end, the DPA backbone carbon atom resembles a C3′ atom in a normal nucleotide (Figure 7A); (b) when viewed from the 5′ end, the same backbone atom of DPA resembles a C4′ atom of a normal nucleotide (Figure 7B). Therefore, when evaluating the distance distributions from the MD trajectories, we considered both C3′–C3′ and C4′–C4′ distances between the suitable bases.
Figure 7.
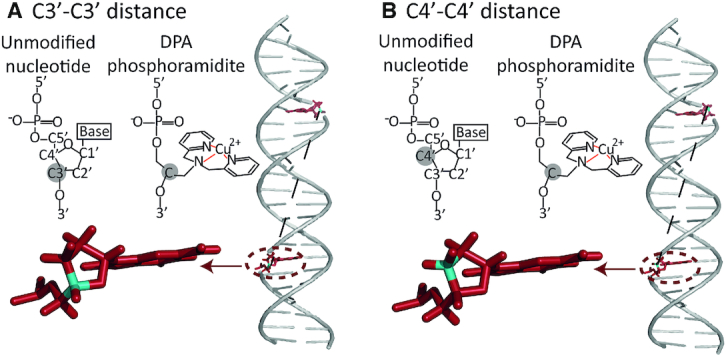
Backbone carbon atoms of an unmodified nucleotide compared to the DPA phosphoramidite. The backbone carbon atom in DPA (grey circle) can resemble either (A) a C3′ atom when viewed from the 3′ end or (B) a C4′ atom when viewed from the 5′ end. Accordingly, the distance distributions were analyzed between C3′–C3′ and C4′–C4′ backbone atoms of the residues that are replaced by DPA in the DPA–DNA duplexes.
Figure 8 shows the MD and experimental distance distributions. The most probable distance between the experiment and the simulations showed a reasonable agreement within 1–2 Å, for all the duplexes. These results are further illustrated in Figure 9. The remarkable agreement in the most probable distances strongly supports the fact that the Cu2+–DPA motif is present within the DNA helix. The agreement also confirms that the incorporation of DPA into the DNA does not perturb the native DNA structure. It follows that the Cu2+–DPA motif is an accurate reporter of point-to-point distances in the DNA backbone without requiring any additional modelling.
Figure 8.
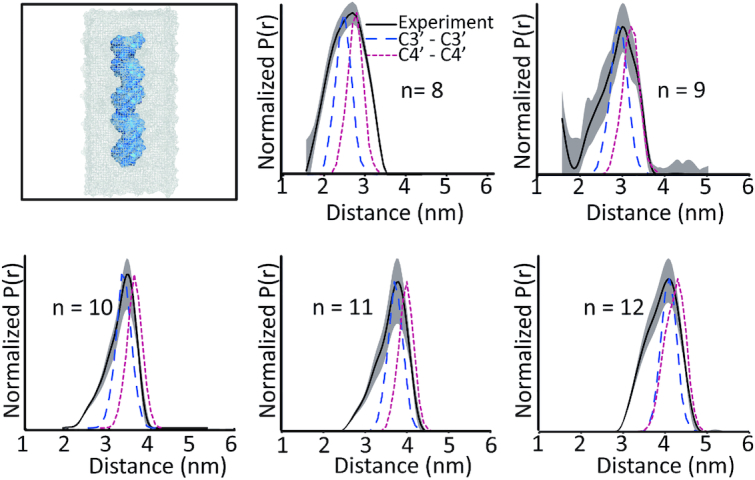
The first panel shows the DNA duplex inside a water box, used in our simulations. C3′–C3′ (blue dashed) and C4′–C4′ (red dotted) distance distributions obtained from MD simulations and experimental distance distributions (black solid). MD simulated distributions show a good agreement with the experimental most probable distance, within 1–2 Å.
Figure 9.
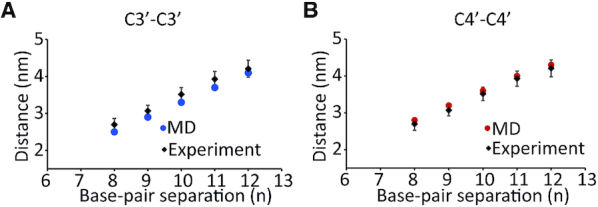
Comparison of the most probable distance from the experimental results with (A) C3′–C3′ distances and (B) C4′–C4′ distances from MD simulations. The data show good agreement for different base pair separations, n.
Despite the coincidence of most probable distance values, a discrepancy exists between the widths of the experimental and MD simulated distance distributions (cf. Figure 8). Clearly, the experimental distance distributions are broader. There are three possible explanations, which are not mutually exclusive. First, the DPA moiety itself has some inherent conformational flexibility, which adds to the distribution width. Second, the MD simulations used unmodified DNA. It is possible that the absence of interstrand hydrogen bonding at the DPA sites of the modified DNA allow access to additional conformational fluctuations that are not accessible in the unmodified DNA. Third, the DNA in solution may experience conformational fluctuations on a time-scale much slower than the 100 ns of the MD simulation; these cannot be captured in short simulations.
DNA breathing model to estimate label flexibility
In order to estimate the flexibility of the Cu2+–DPA label, we modelled the twist-stretch motion of the DNA duplex, taking into account the label length and flexibility. Previous work has shown that the twist-stretch model is in agreement with DEER data on DNA obtained by using the rigid cytidine analogue nitroxide spin label (39). Here, we adopted a similar approach but specific to our Cu2+-DPA label (details are provided in Supplementary Information). One of the parameters that we need to account for is the length of the probe from the DNA backbone. Accordingly, we created an in-silico model of the Cu2+-DPA incorporated DNA duplex and estimated the label length to be 3.3 Å (Supplementary Figure S8). The DNA twist-stretch motion is best represented by two individual components: an axial distance, along the axis of the DNA helix and a transverse distance, in the plane perpendicular to the helical axis of the DNA (39,83) (Supplementary Figures S9 and S10). Furthermore, along with the reported standard deviation for a B-DNA (39), we added an additional flexibility corresponding to the spin label to best fit the experimental results, as has been previously done (39) (details are provided in SI).
Figure 10A shows the comparison of the most probable distance of the modelled data with the experimental results for n ranging from 9 to 12. The DNA duplex with n = 8 was not included in the comparison since the absence of sufficient flanking sequences on either side of the label leads to additional flexibility of the label. The results agree well within the error of the experiment. Such analysis allows for a conceptual understanding of the observations. The Cu2+–DPA spin label is relatively small in size compared to other traditional labels. In addition, the Cu2+–DPA labels point inwards into the helix in both strands and therefore the offset due to linker length is much reduced. Additionally, the contribution of the distance along the DNA helical axis is much more dominant than the radial offset of the Cu2+. Thus, overall, the effect of the offset of Cu2+ becomes small for basepair separations greater than 4. Quantitative comparisons and analysis of the most probable distances obtained from the twist-stretch model and in-silico modelling for both the native DNA and Cu2+–DPA–DNA are shown in Supplementary Figures S11 and S12.
Figure 10.

(A) Plot of most probable distance versus base pair separation for the geometric model of DNA’s twist-stretch motion (blue) and experiment (orange). The results agree within the error of the experiment. (B) Plot of standard deviation versus base pair separation for model (blue) and experimental results (orange). The model considers an additional ∼1.6 Å flexibility of the Cu2+-DPA label and agrees with the experimental results.
Finally, we calculated the standard deviations of our experimental results (Supplementary Figures S13 and S14) and compared to that obtained from the model, as shown in Figure 10B. The experimental data agree with the model for an additional spin label flexibility of ∼1.6 Å. Interestingly, the most rigid nitroxide labels, such as the cytidine analogue, has been reported to have a flexibility of 1 angstrom (39). Note, that these comparisons are a rough estimation of the label flexibility since they consider only the twist-stretch motion (39). However, there may be an additional influence of DNA bending (40) which has not been taken into account. Nevertheless, these results indicate that the flexibility of the Cu2+–DPA is only slightly higher than the most rigid nitroxide labels. Overall, this additional flexibility of the Cu2+−DPA also explains the broader distance distributions obtained in our experiments versus MD (cf. Figures 8 and 10).
More precise information on the label flexibility can also be obtained by elucidating the rotameric preferences of the label (84–88). Such analysis would require the knowledge of force field parameters of the Cu2+–DPA label which is an important future direction.
Finally, in order to examine how the DNA backbone and Cu2+–Cu2+ distances compare for a bent or kinked DNA, we performed in-silico modelling on several bent DNA structures. We incorporated the Cu2+–DPA labels with base-pair separations of 9–12 as described in Supplementary Figure S15. Interestingly, the Cu2+–DPA distances is within 2–3 Å of the backbone distances. Such agreement highlights the usefulness of the short linker and the orientation of the Cu2+–DPA label.
CONCLUSION
Herein, we provide a comprehensive analysis of the Cu2+–DPA motif as a promising spin label for DNA. We have shown that Cu2+ specifically binds to the DPA motif in the DNA duplex, eliminating any non-specific binding. Distance distributions of several DPA–DNA duplexes and MD simulations illustrate that the motif is capable of reporting on DNA backbone conformations in solution, without the need for extensive modelling. Moreover, distance measurements on the Cu2+–DPA motif in the non-complexed DNA does not show orientation effects for any base-pair separation between the motifs. The methodology has the resolution to detect differences in DNA length as small as one base pair. These results also support the fact that the motif is small, is present inside the helix and does not perturb the native structure of DNA. Comparison of experimental distance distributions with those calculated from the geometric model of DNA shows that the Cu2+-DPA is only slightly more flexible than the most rigid nitroxide labels available for DNA. Notably, the spin labelling technique is nucleotide independent, which allows the incorporation of the label at any position. Such Cu2+-based labelling strategy can be combined with nitroxide labelling of proteins in order to measure multiple structural constraints in a protein–DNA complex. The ability of the Cu2+-DPA motif to accurately report on DNA backbone conformation will serve as an essential tool for probing backbone fluctuations and shape adaptations (e.g. bending or unwinding) as the DNA interacts with various proteins to execute biological functions.
Supplementary Material
ACKNOWLEDGEMENTS
We thank Dr Jessica Sarver and Anthony Bogetti for the useful discussions on MD simulations. All simulations were carried out at the University of Pittsburgh's Center for Research Computing.
SUPPLEMENTARY DATA
Supplementary Data are available at NAR Online.
FUNDING
National Science Foundation [NSF MCB-1613007], US-Israel Binational Science Foundation [BSF 2018029] ; the EPR spectrometer was purchased though funds from the National Science Foundation [NSF MRI-1725678]; S.G. thanks the University of Pittsburgh for the Andrew Mellon Predoctoral Fellowship. Funding for open access charge: startup funds from the University of Pittsburgh.
Conflict of interest statement. None declared.
REFERENCES
- 1. Parker S.C., Hansen L., Abaan H.O., Tullius T.D., Margulies E.H.. Local DNA topography correlates with functional noncoding regions of the human genome. Science. 2009; 324:389–392. [DOI] [PMC free article] [PubMed] [Google Scholar]
- 2. Rohs R., West S.M., Sosinsky A., Liu P., Mann R.S., Honig B.. The role of DNA shape in protein-DNA recognition. Nature. 2009; 461:1248–1253. [DOI] [PMC free article] [PubMed] [Google Scholar]
- 3. Harteis S., Schneider S.. Making the bend: DNA tertiary structure and protein-DNA interactions. Int. J. Mol. Sci. 2014; 15:12335–12363. [DOI] [PMC free article] [PubMed] [Google Scholar]
- 4. Reginsson G.W., Shelke S.A., Rouillon C., White M.F., Sigurdsson S.T., Schiemann O.. Protein-induced changes in DNA structure and dynamics observed with noncovalent site-directed spin labeling and PELDOR. Nucleic Acids Res. 2013; 41:e11. [DOI] [PMC free article] [PubMed] [Google Scholar]
- 5. Krumkacheva O.A., Shevelev G.Y., Lomzov A.A., Dyrkheeva N.S., Kuzhelev A.A., Koval V.V., Tormyshev V.M., Polienko Y.F., Fedin M.V., Pyshnyi D.V. et al.. DNA complexes with human apurinic/apyrimidinic endonuclease 1: structural insights revealed by pulsed dipolar EPR with orthogonal spin labeling. Nucleic Acids Res. 2019; 47:7767–7780. [DOI] [PMC free article] [PubMed] [Google Scholar]
- 6. Dickerson R.E. DNA structure from A to Z. Methods Enzym. 1992; 211:67–111. [DOI] [PubMed] [Google Scholar]
- 7. Hwang D.S., Kornberg A.. Opening of the replication origin of Escherichia coli by DnaA protein with protein HU or IHF. J. Biol. Chem. 1992; 267:23083–23086. [PubMed] [Google Scholar]
- 8. Kitayner M., Rozenberg H., Rohs R., Suad O., Rabinovich D., Honig B., Shakked Z.. Diversity in DNA recognition by p53 revealed by crystal structures with Hoogsteen base pairs. Nat. Struct. Mol. Biol. 2010; 17:423–429. [DOI] [PMC free article] [PubMed] [Google Scholar]
- 9. Chuo S.W., Wang L.P., Britt R.D., Goodin D.B.. An intermediate conformational state of cytochrome P450cam-CN in complex with Putidaredoxin. Biochemistry. 2019; 58:2353–2361. [DOI] [PMC free article] [PubMed] [Google Scholar]
- 10. Park S.Y., Borbat P.P., Gonzalez-Bonet G., Bhatnagar J., Pollard A.M., Freed J.H., Bilwes A.M., Crane B.R.. Reconstruction of the chemotaxis receptor-kinase assembly. Nat. Struct. Mol. Biol. 2006; 13:400–407. [DOI] [PubMed] [Google Scholar]
- 11. Borbat P.P., Freed J.H.. Measuring distances by pulsed dipolar ESR spectroscopy: spin-labeled histidine kinases. Methods Enzymol. 2007; 423:52–116. [DOI] [PubMed] [Google Scholar]
- 12. Evans E.G.B., Pushie M.J., Markham K.A., Lee H.-W., Millhauser G.L.. Interaction between prion protein's copper-bound octarepeat domain and a charged C-terminal pocket suggests a mechanism for N-Terminal regulation. Structure. 2016; 24:1057–1067. [DOI] [PMC free article] [PubMed] [Google Scholar]
- 13. Ceccon A., Schmidt T., Tugarinov V., Kotler S.A., Schwieters C.D., Clore G.M.. Interaction of Huntingtin exon-1 peptides with lipid-based micellar nanoparticles probed by solution NMR and Q-band pulsed EPR. J. Am. Chem. Soc. 2018; 140:6199–6202. [DOI] [PMC free article] [PubMed] [Google Scholar]
- 14. Boura E., Rózycki B., Herrick D.Z., Chung H.S., Vecer J., Eaton W.A., Cafiso D.S., Hummer G., Hurley J.H.. Solution structure of the ESCRT-I complex by smallangle X-ray scattering, EPR, and FRET spectroscopy. Proc. Natl. Acad. Sci. U.S.A. 2011; 108:9437–9442. [DOI] [PMC free article] [PubMed] [Google Scholar]
- 15. Duss O., Yulikov M., Jeschke G., Allain F.H.T.. EPR-aided approach for solution structure determination of large RNAs or protein–RNA complexes. Nat. Commun. 2014; 5:3669. [DOI] [PubMed] [Google Scholar]
- 16. Nicklisch S.C.T., Wunnicke D., Borovykh I. V., Morbach S., Klare J.P., Steinhoff H.J., Krämer R.. Conformational changes of the betaine transporter BetP from Corynebacterium glutamicum studied by pulse EPR spectroscopy. Biochim. Biophys. Acta - Biomembr. 2012; 1818:359–366. [DOI] [PubMed] [Google Scholar]
- 17. Sameach H., Ghosh S., Gevorkyan-Airapetov L., Saxena S., Ruthstein S.. EPR spectroscopy detects various active state conformations of the transcriptional regulator CueR. Angew. Chem. Int. Ed. 2019; 58:3053. [DOI] [PubMed] [Google Scholar]
- 18. Shelke S.A., Sigurdsson S.T.. Site-directed spin labelling of nucleic acids. Eur. J. Org. Chem. 2012; 2012:2291–2301. [Google Scholar]
- 19. Shelke S.A., Sigurdsson S.T.. Site-directed spin labeling for EPR studies of nucleic acids. Modified Nucleic Acids. 2016; 31:Springer; 159–187. [Google Scholar]
- 20. Schiemann O., Piton N., Y. M., Stock G., W. E.J., Prisner T.F., Schiemann Olav, Piton Nelly, Mu Yuguang, Stock Gerhard et al.. A PELDOR-based nanometer distance ruler for oligonucleotides. J. Am. Chem. Soc. 2003; 126:5722–5729. [DOI] [PubMed] [Google Scholar]
- 21. Sicoli G., Wachowius F., Bennati M., Hobartner C.. Probing secondary structures of spin-labeled RNA by pulsed EPR spectroscopy. Angew. Chem. Int. Ed. 2010; 49:6443–6447. [DOI] [PubMed] [Google Scholar]
- 22. Babaylova E.S., Ivanov A.V., Malygin A.A., Vorobjeva M.A., Venyaminova A.G., Polienko Y.F., Kirilyuk I.A., Krumkacheva O.A., Fedin M.V., Karpova G.G. et al.. A versatile approach for site-directed spin labeling and structural EPR studies of RNAs. Org. Biomol. Chem. 2014; 12:3129–3136. [DOI] [PubMed] [Google Scholar]
- 23. Saha S., Jagtap A.P., Sigurdsson S.T.. Site-directed spin labeling of 2′-amino groups in RNA with isoindoline nitroxides that are resistant to reduction. Chem. Commun. 2015; 51:13142–13145. [DOI] [PubMed] [Google Scholar]
- 24. Erlenbach N., Endeward B., Schöps P., Gophane D.B., Sigurdsson S.T., Prisner T.F.. Flexibilities of isoindoline-derived spin labels for nucleic acids by orientation selective PELDOR. Phys. Chem. Chem. Phys. 2016; 18:16196–16201. [DOI] [PubMed] [Google Scholar]
- 25. Halbmair K., Seikowski J., Tkach I., Hobartner C., Sezer D., Bennati M.. High-resolution measurement of long-range distances in RNA: pulse EPR spectroscopy with TEMPO-labeled nucleotides. Chem. Sci. 2016; 7:3172–3180. [DOI] [PMC free article] [PubMed] [Google Scholar]
- 26. Frolow O., Endeward B., Schiemann O., Prisner T.F., Engels J.W.. Nitroxide spin labeled RNA for long range distance measurements by EPR-PELDOR. Nucleic Acids Symp. Ser. 2008; 52:153–154. [DOI] [PubMed] [Google Scholar]
- 27. Kerzhner M., Abdullin D., Wiecek J., Matsuoka H., Hagelueken G., Schiemann O., Famulok M., Więcek J., Matsuoka H., Hagelueken G. et al.. Post-synthetic spin-labeling of RNA through click chemistry for PELDOR measurements. Chem. Eur. J. 2016; 22:12113–12121. [DOI] [PubMed] [Google Scholar]
- 28. Cai Q., Kusnetzow A.K., Hubbell W.L., Haworth I.S., Gacho G.P.C., Van Eps N., Hideg K., Chambers E.J., Qin P.Z.. Site-directed spin labeling measurements of nanometer distances in nucleic acids using a sequence-independent nitroxide probe. Nucleic Acids Res. 2006; 34:4722–4730. [DOI] [PMC free article] [PubMed] [Google Scholar]
- 29. Nguyan P.H., Popova A., Hideg K., Qin P.Z.. A nucleotide-independent cyclic nitroxide label for monitoring segmental motions in nucleic acids. BMC Biophys. 2016; 8:6–14. [DOI] [PMC free article] [PubMed] [Google Scholar]
- 30. Popova A.M., Kálai T., Hideg K., Qin P.Z.. Site-specific DNA structural and dynamic features revealed by nucleotide-independent nitroxide probes. Biochemistry. 2009; 48:8540–8550. [DOI] [PMC free article] [PubMed] [Google Scholar]
- 31. Qin P.Z., Haworth I.S., Cai Q., Kusnetzow A.K., Grant G.P.G., Price E.A., Sowa G.Z., Popova A., Herreros B., He H.. Measuring nanometer distances in nucleic acids using a sequence-independent nitroxide probe. Nat. Protoc. 2007; 2:2354–2365. [DOI] [PMC free article] [PubMed] [Google Scholar]
- 32. Haugland M.M., El-Sagheer A.H., Porter R.J., Pena J., Brown T., Anderson E.A., Lovett J.E.. 2′-Alkynylnucleotides: a sequence- and spin label-flexible strategy for EPR spectroscopy in DNA. J. Am. Chem. Soc. 2016; 138:9069–9072. [DOI] [PubMed] [Google Scholar]
- 33. Fedin M. V., Shevelev G.Y., Pyshnyi D. V., Tormyshev V.M., Jeschke G., Yulikov M., Bagryanskaya E.G.. Interaction of triarylmethyl radicals with DNA termini revealed by orientation-selective W-band double electron–electron resonance spectroscopy. Phys. Chem. Chem. Phys. 2016; 18:29549–29554. [DOI] [PMC free article] [PubMed] [Google Scholar]
- 34. Shevelev G.Y., Krumkacheva O., Lomzov A.A., Kuzhelev A.A., Trukhin D.V., Rogozhnikova O.Y., Tormyshev V.M., Pyshnyi D.V., Fedin M.V., Bagryanskaya E.G.. Triarylmethyl labels: Toward improving the accuracy of EPR nanoscale distance measurements in DNAs. J. Phys. Chem. B. 2015; 119:13641–13648. [DOI] [PMC free article] [PubMed] [Google Scholar]
- 35. Barhate N., Cekan P., Massey A.P., Sigurdsson S.T.. A nucleoside that contains a rigid nitroxide spin label: a fluorophore in disguise. Angew. Chem. Int. Ed. 2007; 46:2655–2658. [DOI] [PubMed] [Google Scholar]
- 36. Cekan P., Sigurdsson S.T.. Conformation and dynamics of nucleotides in bulges and symmetric internal loops in duplex DNA studied by EPR and fluorescence spectroscopies. Biochem. Biophys. Res. Commun. 2012; 420:656–661. [DOI] [PubMed] [Google Scholar]
- 37. Cekan P., Smith A.L., Barhate N., Robinson B.H., Sigurdsson S.T.. Rigid spin-labeled nucleoside C: a nonperturbing EPR probe of nucleic acid conformation. Nucleic Acids Res. 2008; 36:5946–5954. [DOI] [PMC free article] [PubMed] [Google Scholar]
- 38. Edwards T.E., Cekan P., Reginsson G.W., Shelke S.A., Ferré-D’Amaré A.R., Schiemann O., Sigurdsson S.T.. Crystal structure of a DNA containing the planar, phenoxazine-derived bi-functional spectroscopic probe C. Nucleic Acids Res. 2011; 39:4419–4426. [DOI] [PMC free article] [PubMed] [Google Scholar]
- 39. Marko A., Denysenkov V., Margraf D., Cekan P., Schiemann O., Sigurdsson S.T., Prisner T.F.. Conformational flexibility of DNA. J. Am. Chem. Soc. 2011; 133:13375–13379. [DOI] [PubMed] [Google Scholar]
- 40. Stelzl L.S., Erlenbach N., Heinz M., Prisner T.F., Hummer G.. Resolving the conformational dynamics of DNA with ångstrom resolution by PELDOR and molecular dynamics. J. Am. Chem. Soc. 2017; 139:11674–11677. [DOI] [PubMed] [Google Scholar]
- 41. Grytz C.M., Marko A., Cekan P., Sigurdsson S.T., Prisner T.F.. Flexibility and conformation of the cocaine aptamer studied by PELDOR. Phys. Chem. Chem. Phys. 2016; 18:2993–3002. [DOI] [PubMed] [Google Scholar]
- 42. Shevelev G.Y., Krumkacheva O.A., Lomzov A.A., Kuzhelev A.A., Rogozhnikova O.Y., Trukhin D. V., Troitskaya T.I., Tormyshev V.M., Fedin M. V., Pyshnyi D. V. et al.. Physiological-Temperature distance measurement in nucleic acid using triarylmethyl-based spin labels and pulsed dipolar EPR spectroscopy. J. Am. Chem. Soc. 2014; 136:9874–9877. [DOI] [PubMed] [Google Scholar]
- 43. Kuzhelev A.A., Krumkacheva O.A., Shevelev G.Y., Yulikov M., Fedin M. V., Bagryanskaya E.G.. Room-temperature distance measurements using RIDME and the orthogonal spin labels trityl/nitroxide. Phys. Chem. Chem. Phys. 2018; 20:10224–10230. [DOI] [PubMed] [Google Scholar]
- 44. Heinz M., Erlenbach N., Stelzl L.S., Thierolf G., Kamble N.R., Sigurdsson S.T.H., Prisner T.F., Hummer G.. High-resolution EPR distance measurements on RNA and DNA with the non-covalent G spin label. Nucleic Acids Res. 2020; 48:924–933. [DOI] [PMC free article] [PubMed] [Google Scholar]
- 45. Donohue M.P., Szalai V.A.. Distance measurements between paramagnetic ligands bound to parallel stranded guanine quadruplexes. Phys. Chem. Chem. Phys. 2016; 18:15447–15455. [DOI] [PMC free article] [PubMed] [Google Scholar]
- 46. Wojciechowski F., Gross A., Holder I.T., Knorr L., Drescher M., Hartig J.S., Groß A., Holder I.T., Knörr L., Drescher M. et al.. Pulsed EPR spectroscopy distance measurements of DNA internally labelled with Gd3+-DOTA. Chem. Comm. 2015; 51:13850–13853. [DOI] [PubMed] [Google Scholar]
- 47. Engelhard D.M., Meyer A., Berndhäuser A., Schiemann O., Clever G.H.. Di-copper(ii) DNA G-quadruplexes as EPR distance rulers. Chem. Commun. 2018; 54:7455–7458. [DOI] [PubMed] [Google Scholar]
- 48. Song Y., Meade T.J., Astashkin A.V., Klein E.L., Enemark J.H., Raitsimring A.. Pulsed dipolar spectroscopy distance measurements in biomacromolecules labeled with Gd(III) markers. J. Magn. Reson. 2011; 210:59–68. [DOI] [PMC free article] [PubMed] [Google Scholar]
- 49. Lawless M.J., Sarver J., Saxena S.. Nucleotide-independent copper(II)-based distance measurements in DNA by pulsed ESR spectroscopy. Angew. Chem. Int. Ed. 2017; 56:2115–2117. [DOI] [PubMed] [Google Scholar]
- 50. Gophane D.B., Endeward B., Prisner T.F., Sigurdsson S.T.. Conformationally restricted isoindoline-derived spin labels in duplex DNA: Distances and rotational flexibility by pulsed electron-electron double resonance spectroscopy. Chem. - A Eur. J. 2014; 20:15913–15919. [DOI] [PubMed] [Google Scholar]
- 51. Cantor C.R., Tinoco I.. Calculated optical properties of 64 trinucleoside diphosphates. Biopolymers. 1967; 5:821–835. [DOI] [PubMed] [Google Scholar]
- 52. Richards E.G. Use of tables in calculation of absorption, optical rotatory dispersion and circular dichroism of polyribonucleotides. Handb. Biochem. Mol. Biol. 3rd Edn. 1975; 1:596–603. [Google Scholar]
- 53. Senior M., Jones R.A., Breslauer K.J.. Influence of dangling thymidine residues on the stability and structure of two DNA duplexes. Biochemistry. 1988; 27:3879–3885. [DOI] [PubMed] [Google Scholar]
- 54. Stoll S., Schweiger A.. EasySpin, a comprehensive software package for spectral simulation and analysis in EPR. J. Magn. Reson. 2006; 178:42–55. [DOI] [PubMed] [Google Scholar]
- 55. Pannier M., Veit S., Godt A., Jeschke G., Spiess H.W.. Dead-Time free measurement of Dipole-Dipole interactions between electron Spins. J. Magn. Res. 2000; 142:331–340. [DOI] [PubMed] [Google Scholar]
- 56. Jeschke G., Chechik V., Ionita P., Godt A., Zimmermann H., Banham J., Timmel C.R., Hilger D., Jung H.. DeerAnalysis2006 - a comprehensive software package for analyzing pulsed ELDOR data. Appl. Magn. Reson. 2006; 30:473–498. [Google Scholar]
- 57. Ivani I., Dans P.D., Noy A., Pérez A., Faustino I., Hospital A., Walther J., Andrio P., Goñi R., Balaceanu A. et al.. Parmbsc1: a refined force field for DNA simulations. Nat. Methods. 2016; 13:55–58. [DOI] [PMC free article] [PubMed] [Google Scholar]
- 58. Case D.A., Cheatham T.E. III, Darden T., Gohlke H., Luo R., Merz K.M. Jr, Onufriev A., Simmerling C., Wang B., Woods R.J.. The Amber biomolecular simulation programs. J. Comput. Chem. 2005; 26:1668–1688. [DOI] [PMC free article] [PubMed] [Google Scholar]
- 59. Jorgensen W.L., Chandrasekhar J., Madura J.D., Impey R.W., Klein M.L.. Comparison of simple potential functions for simulating liquid water. J. Chem. Phys. 1983; 79:926–935. [Google Scholar]
- 60. Darden T., York D., Pedersen L.. Particle mesh Ewald: an N ⋅log(N) method for Ewald sums in large systems. J. Chem. Phys. 1993; 98:10089–10092. [Google Scholar]
- 61. Ryckaert J.P., Ciccotti G., Berendsen H.J.. Numerical integration of the cartesian equations of motion of a system with constraints: molecular dynamics of n-alkanes. J. Comput. Phys. 1977; 23:327–341. [Google Scholar]
- 62. Humphrey W., Dalke A., Schulten K.. VMD: visual molecular dynamics. J. Mol. Graph. 1996; 14:33–38. [DOI] [PubMed] [Google Scholar]
- 63. Aldakheel F. Toward improving metalloenzyme inhibitor design: a thermodynamic study of small molecule interactions with copper(II), cobalt(II) and manganese(II). Coll. Sci. Heal. Theses Diss. 2017; 248: [Google Scholar]
- 64. Zhou W., Saran R., Liu J.. Metal sensing by DNA. Chem. Rev. 2017; 117:8272–8325. [DOI] [PubMed] [Google Scholar]
- 65. Izatt R.M., Christensen J.J., Rytting J.H.. Sites and thermodynamic quantities associated with proton and metal ion interaction with ribonucleic acid, deoxyribonucleic acid, and their constituent bases, nucleosides, and and nucleotides. Chem. Rev. 1971; 71:439–481. [DOI] [PubMed] [Google Scholar]
- 66. Syme C.D., Nadal R.C., Rigby S.E.J., Viles J.H.. Copper binding to the Amyloid-B (AB) peptide associated with Alzheimer's disease. J. Biol. Chem. 2004; 279:18169–18177. [DOI] [PubMed] [Google Scholar]
- 67. Silva K.I., Saxena S.. Zn(II) ions substantially perturb Cu(II) ion coordination in amyloid-β at physiological pH. J. Phys. Chem. B. 2013; 117:9386–9394. [DOI] [PMC free article] [PubMed] [Google Scholar]
- 68. Peisach J., Blumberg W.E.. Structural implications derived from the analysis of electron paramagnetic resonance spectra of natural and artificial copper proteins. Arch. Biochem. Biophys. 1974; 165:691–708. [DOI] [PubMed] [Google Scholar]
- 69. Gamble Jarvi A., Ranguelova K., Ghosh S., Weber R.T., Saxena S.. On the use of Q-Band double Electron–Electron resonance to resolve the relative orientations of two double Histidine-Bound Cu2+ Ions in a Protein. J. Phys. Chem. B. 2018; 122:10669–10677. [DOI] [PubMed] [Google Scholar]
- 70. Bowen A.M., Jones M.W., Lovett J.E., Gaule T.G., McPherson M.J., Dilworth J.R., Timmel C.R., Harmer J.R.. Exploiting orientation-selective DEER: determining molecular structure in systems containing Cu (II) centres. Phys. Chem. Chem. Phys. 2016; 18:5981–5994. [DOI] [PubMed] [Google Scholar]
- 71. Abé C., Klose D., Dietrich F., Ziegler W.H., Polyhach Y., Jeschke G., Steinhoff H.J.. Orientation selective DEER measurements on vinculin tail at X-band frequencies reveal spin label orientations. J. Magn. Reson. 2012; 216:53–61. [DOI] [PubMed] [Google Scholar]
- 72. Schiemann O., Cekan P., Margraf D., Prisner T.F., Sigurdsson S.T.. Relative orientation of rigid nitroxides by PELDOR: Beyond distance measurements in nucleic acids. Angew. Chemie Int. Ed. 2009; 48:3292–3295. [DOI] [PubMed] [Google Scholar]
- 73. Bode B.E., Plackmeyer J., Prisner T.F., Schiemann O.. PELDOR measurements on a nitroxide-labeled Cu(II) porphyrin: orientation selection, spin-density distribution, and conformational flexibility. J. Phys. Chem. A. 2008; 112:5064–5073. [DOI] [PubMed] [Google Scholar]
- 74. Denysenkov V.P., Prisner T.F., Stubbe J., Bennati M.. High-field pulsed electron-electron double resonance spectroscopy to determine the orientation of the tyrosyl radicals in ribonucleotide reductase. Proc. Natl. Acad. Sci. U.S.A. 2006; 103:13386–13390. [DOI] [PMC free article] [PubMed] [Google Scholar]
- 75. Yang Z., Ji M., Saxena S.. Practical aspects of copper ion-based double electron electron resonance distance measurements. Appl. Magn. Reson. 2010; 39:487–500. [Google Scholar]
- 76. Ji M., Ruthstein S., Saxena S.. Paramagnetic metal ions in pulsed ESR distance distribution measurements. Acc. Chem. Res. 2014; 47:688–695. [DOI] [PubMed] [Google Scholar]
- 77. Sarver J., Silva K.I., Saxena S.. Measuring Cu2+-nitroxide distances using double electron-electron resonance and saturation recovery. Appl. Magn. Reson. 2013; 44:583–594. [Google Scholar]
- 78. Yang Z., Kise D., Saxena S.. An approach towards the measurement of nanometer range distance based on Cu2+ ions and ESR. J. Phys. Chem. B. 2010; 114:6165–6174. [DOI] [PubMed] [Google Scholar]
- 79. Gamble Jarvi A., Cunningham T.F., Saxena S.. Efficient localization of a native metal ion within a protein by Cu2+ -based EPR distance measurements. Phys. Chem. Chem. Phys. 2019; 21:10238–10243. [DOI] [PubMed] [Google Scholar]
- 80. Cunningham T.F., Putterman M.R., Desai A., Horne W.S., Saxena S.. The double-histidine Cu2+-binding motif: a highly rigid, Site-Specific spin probe for electron spin resonance distance measurements. Angew. Chem. Int. Ed. 2015; 54:6330–6334. [DOI] [PMC free article] [PubMed] [Google Scholar]
- 81. Breitgoff F.D., Keller K., Qi M., Klose D., Yulikov M., Godt A., Jeschke G.. UWB DEER and RIDME distance measurements in Cu(II)–Cu(II) spin pairs. J. Magn. Reson. 2019; 308:106560. [DOI] [PubMed] [Google Scholar]
- 82. Olson W.K., Gorin A.A., Lu X.J., Hock L.M., Zhurkin V.B.. DNA sequence-dependent deformability deduced from protein-DNA crystal complexes. Proc. Natl. Acad. Sci. U.S.A. 1998; 95:11163–11168. [DOI] [PMC free article] [PubMed] [Google Scholar]
- 83. Mathew-Fenn R.S., Das R., Harbury P.A.B.. Remeasuring the double helix. Science. 2008; 322:446–449. [DOI] [PMC free article] [PubMed] [Google Scholar]
- 84. Polyhach Y., Bordignon E., Jeschke G.. Rotamer libraries of spin labeled cysteines for protein studies. Phys. Chem. Chem. Phys. 2011; 13:2356–2366. [DOI] [PubMed] [Google Scholar]
- 85. Jeschke G. MMM: a toolbox for integrative structure modeling. Protein Sci. 2018; 27:76–85. [DOI] [PMC free article] [PubMed] [Google Scholar]
- 86. Hagelueken G., Ward R., Naismith J.H., Schiemann O.. MtsslWizard: in silico spin-labeling and generation of distance distributions in PyMOL. Appl. Magn. Reson. 2012; 42:377–391. [DOI] [PMC free article] [PubMed] [Google Scholar]
- 87. Hirst S.J., Alexander N., Mchaourab H.S., Meiler J.. RosettaEPR: an integrated tool for protein structure determination from sparse EPR data. J. Struct. Biol. 2011; 173:506–514. [DOI] [PMC free article] [PubMed] [Google Scholar]
- 88. Reichel K., Stelzl L.S., Köfinger J., Hummer G.. Precision DEER distances from spin-Label ensemble refinement. J. Phys. Chem. Lett. 2018; 9:5748–5752. [DOI] [PubMed] [Google Scholar]
Associated Data
This section collects any data citations, data availability statements, or supplementary materials included in this article.


