

Summary
The factors mediating fatal SARS-CoV-2 infections are poorly understood. Here, we show that cigarette smoke causes a dose-dependent upregulation of angiotensin converting enzyme 2 (ACE2), the SARS-CoV-2 receptor, in rodent and human lungs. Using single-cell sequencing data, we demonstrate that ACE2 is expressed in a subset of secretory cells in the respiratory tract. Chronic smoke exposure triggers the expansion of this cell population and a concomitant increase in ACE2 expression. In contrast, quitting smoking decreases the abundance of these secretory cells and reduces ACE2 levels. Finally, we demonstrate that ACE2 expression is responsive to inflammatory signaling and can be upregulated by viral infections or interferon treatment. Taken together, these results may partially explain why smokers are particularly susceptible to severe SARS-CoV-2 infections. Furthermore, our work identifies ACE2 as an interferon-stimulated gene in lung cells, suggesting that SARS-CoV-2 infections could create positive feedback loops that increase ACE2 levels and facilitate viral dissemination.
Keywords: Coronavirus, ACE2, smoking, lung development, interferon, inflammation, SARS-CoV-2, COVID-19
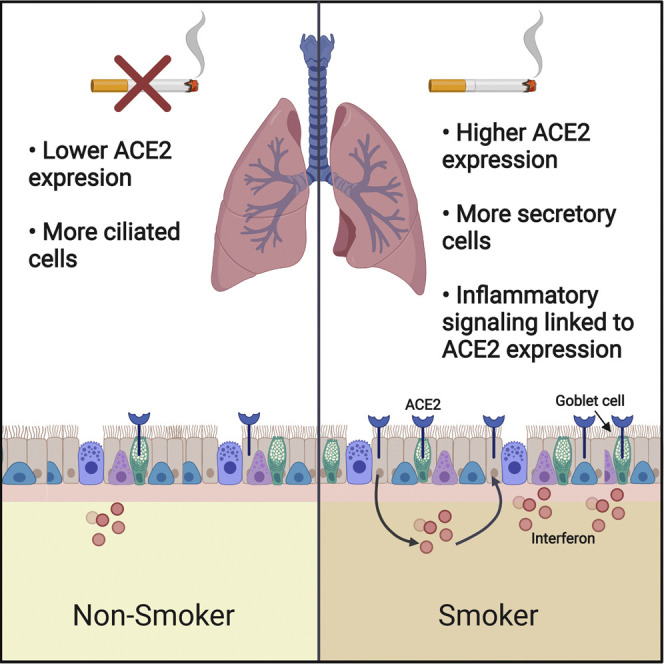
Graphical Abstract
Highlights
-
•
Lung ACE2 levels do not vary by age or sex, but smokers exhibit upregulated ACE2
-
•
ACE2 is expressed in several lung cell types, including the secretory lineage
-
•
Chronic smoking triggers the expansion of ACE2+ secretory cells
-
•
ACE2 is also upregulated by viral infections and interferon exposure
Smith et al. report that smokers’ lungs harbor higher levels of the coronavirus receptor ACE2. They further demonstrate that ACE2 is expressed in a subpopulation of secretory cells that expand in response to smoke exposure. Finally, they establish that ACE2 is an interferon-stimulated gene that is upregulated by viral infections.
Introduction
In December 2019, a novel respiratory disease emerged in a seafood market in Wuhan, China (Zhu et al., 2020). Genomic sequencing demonstrated that the causative agent was a highly contagious coronavirus, since named SARS-CoV-2 (Wu et al., 2020, Zhou et al., 2020). The disease, called COVID-19, has rapidly spread worldwide, and as of May 2020, more than 4 million people have been infected and more than 300,000 people have died (Our world in data, 2020). No clinically validated treatment or vaccine for COVID-19 is currently available. Thus, understanding the factors that mediate susceptibility to SARS-CoV-2 is crucial for controlling disease transmission.
Molecular analysis has begun to shed light on how SARS-CoV-2 infections occur. Like a related coronavirus that emerged in 2003 (Li et al., 2003), SARS-CoV-2 enters human cells by binding to the extracellular domain of angiotensin converting enzyme 2 (ACE2) (Hoffmann et al., 2020, Zhou et al., 2020). Importantly, ACE2 is both necessary and sufficient for infection by SARS-CoV-2: ACE2-targeting antibodies block viral uptake in permissive cells, while transgenic expression of human ACE2 allows viral entry in non-human cells. ACE2 normally functions in the renin-angiotensin system (RAS) by cleaving the vasoconstrictive hormone angiotensin-II into the vasodilator angiotensin 1–7 (Jiang et al., 2014). Sequestration of ACE2 by coronavirus dysregulates the RAS pathway, contributing to morbidity (Kuba et al., 2005). Additionally, ACE2 levels are capable of influencing disease progression: among a cohort of mice engineered to express human ACE2, mice expressing the highest levels of ACE2 mRNA exhibited the shortest survival time following coronavirus exposure (McCray et al., 2007). Thus, the regulation of ACE2 expression likely has a significant effect on SARS-CoV-2 susceptibility.
Epidemiological studies have identified multiple demographic features that correlate with the severity of clinical COVID-19 cases. While fewer than 5% of SARS-CoV-2 infections are fatal (Ruan, 2020, Wu and McGoogan, 2020), men and elderly patients are particularly at a risk of developing severe disease (Guan et al., 2020, Luo et al., 2020, Rabin, 2020, Remuzzi and Remuzzi, 2020). Additionally, cigarette smokers with COVID-19 are significantly more likely to develop critical illnesses that require aggressive medical intervention (Patanavanich and Glantz, 2020, Zhao et al., 2020a). For instance, in a study of 1,099 patients with laboratory-confirmed COVID-19, 12.3% of current smokers required mechanical ventilation, were admitted to an intensive care unit (ICU), or died, compared with only 4.7% of non-smokers (Guan et al., 2020). The causes underlying these differences in the outcome are at present unknown.
Several clinical features have also been identified that can differentiate between patients with severe and non-severe coronavirus infections. Notably, a dysregulated immune response has been found to be a crucial mediator of COVID-19 mortality (Pedersen and Ho, 2020). Patients who present with elevated levels of inflammatory cytokines are more likely to develop critical illnesses (Chen et al., 2020a, Shi et al., 2020, Yang et al., 2020). These so-called “cytokine storms” cause an increase in vascular permeability that facilitates immune cell efflux into affected tissues, but may also worsen pneumonia (Zhang et al., 2020a). How this immunopathology affects the regulation of the host factors required for coronavirus infections is poorly understood.
Results
ACE2 Levels in Mammalian Lungs Are Not Strongly Affected by Age or Sex
In order to study factors that could potentially influence susceptibility to SARS-CoV-2 infection, we investigated the expression of the coronavirus receptor ACE2. We first assessed the expression of ACE2 in a variety of rodent and human tissues (Figure S1; Table S1) (Carithers et al., 2015, GTEx Consortium, 2013, Schaum et al., 2019, Yu et al., 2014). ACE2 was expressed at high levels in mouse, rat, and human kidneys, consistent with its role as a regulator of the RAS pathway. ACE2 was also expressed in rodent and human lungs, the predominant location of coronavirus infections (Wölfel et al., 2020). Interestingly, significant ACE2 expression was also evident in the mouse and human small intestine. Viral RNA has been detected in stool samples from patients with COVID-19 (Xu et al., 2020), and gastrointestinal symptoms have been reported in a subset of affected individuals (Guan et al., 2020), suggesting a potential alternate route for SARS-CoV-2 transmission. However, as SARS-CoV-2 appears to be primarily spread through viral inhalation (Wölfel et al., 2020), we focused our study on factors that affect ACE2 expression in the lung and associated respiratory tissue.
Age and male sex are significant risk factors for severe SARS-CoV-2 infections (Guan et al., 2020, Zhao et al., 2020). We therefore investigated whether either feature was associated with increased ACE2 expression. In four different cohorts of aging mice and one cohort of aging rats, we did not detect a significant age-dependent change in ACE2 expression in the lung (Figures 1A, 1B, and S1D–S1F) (The Tabula Muris Consortium et al., 2020, Jonker et al., 2013, Misra et al., 2007, Soundararajan et al., 2016, Yu et al., 2014). Similarly, ACE2 expression in rodent lungs was not significantly different between sexes (Figures 1C and 1D) (Crowley et al., 2015, Yu et al., 2014). We next assessed the expression of ACE2 in three different human cohorts: (1) lung tissue from the genotype-tissue expression project (GTEx) (Carithers et al., 2015, GTEx Consortium, 2013), (2) whole-lung tissue samples from organ donors (Gruber et al., 2006), and (3) pathologically normal lung tissue from a cohort of patients analyzed as a part of The Cancer Genome Atlas (TCGA) (Cancer Genome Atlas Research Network et al., 2013). These datasets yielded results that were consistent with our rodent analyses: ACE2 expression was equivalent between men and women and between young (<29 years) and elderly individuals (>70 years) (Figures 1E–1J). In total, these findings suggest that the increased morbidity of men and older patients with COVID-19 is unlikely to result from inherent differences in the basal level of ACE2 expression in the lung.
Figure 1.

ACE2 Expression in the Lung Is Uncorrelated with Age or Sex
(A) ACE2 expression in the lungs of young mice (<26 weeks old) and old mice (>78 weeks old).
(B) ACE2 expression in the lungs of young rats (6 weeks old) and old rats (104 weeks old).
(C) ACE2 expression in the lungs of female mice and male mice.
(D) ACE2 expression in the lungs of female rats and male rats.
(E) ACE2 expression in lungs from the GTEx cohort by age.
(F) ACE2 expression in lungs from the GTEx cohort by sex.
(G) ACE2 expression in lungs from a cohort of organ donors by age.
(H) ACE2 expression in lungs from a cohort of organ donors by sex.
(I) ACE2 expression in pathologically normal lung tissue from patients from TCGA by age.
(J) ACE2 expression in pathologically normal lung tissue from patients from TCGA by sex.
Each panel displays log2-normalized ACE2 expression relative to a control group. Data analyzed in (A) and (C) were from GSE132040. Data analyzed in (B) and (D) were from GSE53960. Data analyzed in (E) and (F) were from www.gtexportal.org. Data analyzed in (G) and (H) were from GSE1643. Data analyzed in (I) and (J) were from https://gdac.broadinstitute.org/. Additional information on the data sources and sample sizes is included in Table S1.
Cigarette Smoke Increases the Expression of ACE2 in the Mammalian Respiratory Tract
Cigarette smoking is strongly associated with adverse outcomes from COVID-19 (Guan et al., 2020, Hu et al., 2020, Patanavanich and Glantz, 2020, Qi et al., 2020, Wang et al., 2020, Zhang et al., 2020b, Zhao et al., 2020a). To investigate whether smoking could affect ACE2 levels, we first assessed gene expression in mouse lungs. We analyzed a cohort of mice exposed to diluted cigarette smoke for 2, 3, or 4 h per day for 5 months (Gebel et al., 2010). Strikingly, we found a dose-dependent increase in ACE2 expression according to smoke exposure (Figure 2 A). Mice exposed to the highest dose of cigarette smoke expressed ∼80% more ACE2 in their lungs compared with sham-treated mice. To determine whether this association was present in humans as well, we assessed tissue collected from three cohorts of current smokers and never smokers (Butler et al., 2011, Turetz et al., 2009, Yang et al., 2017). For these analyses, lung epithelial cells were sampled by fiberoptic bronchoscopy from either the trachea, the large airways, or the small airways (Figure 2B). In each cohort, we observed that tissue samples from smokers exhibited ∼30%–55% more ACE2 compared with the tissue from non-smokers (Figures 2C–2E). In a combined analysis comprising of data from all three tissue locations, ACE2 was in the top 2% of genes most strongly dysregulated by smoke exposure (Figure 2F).
Figure 2.

Cigarette Smoke Increases the Expression of ACE2 in Mouse and Human Lungs
(A) ACE2 expression in the lungs of mice that were sham-treated or that were exposed to diluted cigarette smoke for 2, 3, or 4 h a day (low, medium, and high smoke exposure, respectively).
(B) A diagram showing the approximate locations of tissue samples used in this analysis. Tracheal, large airway epithelial, and small airway epithelial specimens were collected by fiberoptic bronchoscopy as described in their respective publications. Lung resections were collected surgically from various locations.
(C) ACE2 expression in human tracheal epithelia analyzed according to smoking history.
(D) ACE2 expression in human large airway epithelia analyzed according to smoking history.
(E) ACE2 expression in human small airway epithelia analyzed according to smoking history.
(F) A volcano plot comparing gene expression in the respiratory epithelia of current smokers and never smokers from (C)–(E). The dotted lines indicate various p value thresholds (e.g., genes located above the 10th percentile have a combined p value greater than 90% of the genes included in the meta-analysis). The location of ACE2 is indicated with a red star.
(G) ACE2 expression in the lungs of a cohort of patients undergoing thoracic surgery analyzed according to the number of pack years each patient smoked.
(H) ACE2 expression in the lungs of TCGA patients analyzed according to the number of pack years each patient smoked.
(I) ACE2 expression in respiratory epithelia collected by fiberoptic bronchoscopy among either current smokers or former smokers.
(J) A volcano plot comparing gene expression between current smokers and former smokers. The dotted lines indicate various p value thresholds (e.g., genes located above the 10th percentile have a combined p value greater than 90% of the genes included in the meta-analysis). The location of ACE2 is indicated with a red star.
Each panel displays log2-normalized ACE2 expression relative to a control group. Data analyzed in (A) were from GSE18344. Data analyzed in (C) were from GSE13933. Data analyzed in (D) were from GSE22047. Data analyzed in (E) were from GSE64614. Data analyzed in (G) were from GSE76925. Data analyzed in (H) were from https://gdac.broadinstitute.org/. Data analyzed in (I) were from GSE79209. Additional information on the data sources and sample sizes are included in Table S1. ∗p < 0.05, ∗∗p < 0.005, ∗∗∗p < 0.0005 (Student’s t test).
Next, we sought to determine whether human ACE2 expression showed a dose-dependent relationship with cigarette smoke, as we had observed in mice. To investigate this, we analyzed two human datasets: (1) lung tissue from a cohort of smokers undergoing thoracic surgery for transplantation, lung volume reduction, or nodule resection (Morrow et al., 2017) and (2) pathologically normal lung tissue from TCGA patients (Cancer Genome Atlas Research Network et al., 2013). In both cohorts, lung samples from patients who reported smoking the greatest number of pack years also expressed the highest levels of ACE2 (Figures 2G and 2H). For instance, among smokers undergoing thoracic surgery, patients who had smoked more than 80 pack years exhibited a ∼100% increase in ACE2 expression relative to patients who had smoked less than 20 pack years (Figure 2G).
We then investigated whether other demographic features could explain the upregulation of ACE2 in the lungs of smokers. Multivariate linear regression on the thoracic surgery cohort confirmed that smoking history was a significant predictor of ACE2 expression, even when controlling for a patient’s age, sex, race, and body-mass index (Table 1 ). In the TCGA cohort, pack-year history did not remain significantly associated with ACE2 in a regression with additional clinical variables, which may reflect the very small number of patients who could be included in this analysis (22 patients; data not shown). However, demographic information was available for the tracheal epithelium cohort analyzed above (Figure 2E), and smoking status remained correlated with ACE2 in a regression that included each patient’s age, sex, and race (Table 1).
Table 1.
Patient Characteristics and ACE2 Expression
| β Value | Standard Error | p Value | ||
|---|---|---|---|---|
| Thoracic surgery cohort | Age | 0.0014 | 0.0086 | 0.8700 |
| BMI | −0.0199 | 0.0127 | 0.1193 | |
| Smoking pack years | 0.0081 | 0.0025 | 0.0015∗∗ | |
| Race: Caucasian = 0; not Caucasian = 1 | 0.1910 | 0.1663 | 0.2527 | |
| Sex: female = 0, male = 1 | 0.3335 | 0.1338 | 0.0138∗ | |
| Tracheal epithelium cohort | Age | −0.0027 | 0.0080 | 0.7364 |
| Smoking status: never smoker = 0; current smoker = 1 | 0.5638 | 0.1269 | 7 × 10⁻⁵∗∗∗ | |
| Race: Caucasian = 0; not Caucasian = 1 | 0.1252 | 0.1331 | 0.3527 | |
| Sex: female = 0; male = 1 | 0.2538 | 0.1328 | 0.0632 |
Finally, we examined the effects of quitting smoking on ACE2 expression. In a cohort of patients comprising either current smokers or former smokers who had refrained from smoking for at least 12 months, quitting smoking was associated with a ∼40% decrease in ACE2 expression (Figure 2I). ACE2 was among the top 5% of genes most strongly affected by quitting smoking (Figure 2J). In total, our results demonstrate that exposure to cigarette smoke increases the expression of the coronavirus receptor ACE2 in rodent and human respiratory tissue, and this upregulation is potentially reversible.
Coronavirus infections are facilitated by a set of host proteases that cleave and activate the viral spike (S) protein (Millet and Whittaker, 2015). SARS-CoV-2 primarily relies on the serine protease TMPRSS2 but can also utilize an alternate pathway involving Cathepsin B/L in TMPRSS2-negative cells (Hoffmann et al., 2020). Interestingly, we observed that Cathepsin B expression, but not TMPRSS2 or Cathepsin L expression, was consistently increased in mice and humans exposed to cigarette smoke (Figure S2). In a meta-analysis across the trachea, large airways, and small airways, Cathepsin B was in the top 11% of genes dysregulated in the respiratory tract of cigarette smokers (Figure S2D). Thus, smoking can upregulate both the coronavirus receptor as well as a protease that SARS-CoV-2 is capable of using for viral activation.
ACE2 Is Expressed at High Levels in Secretory Cells in the Lung Epithelium
Mammalian lungs harbor more than 30 distinct cell types representing a variety of epithelial, endothelial, stromal, and immune compartments (Franks et al., 2008). Of note, the upper respiratory epithelium comprises mucociliary cells, including goblet cells, club cells, and ciliated cells, that secrete protective fluids and remove inhaled particles from the airways (Whitsett, 2018). The lower respiratory epithelium includes alveolar type 1 cells, which allow gas exchange with the blood, and alveolar type 2 cells, which regulate alveolar fluid balance and can differentiate into type 1 cells following injury (Whitsett and Weaver, 2015).
To gain further insight into coronavirus infections, we profiled multiple single-cell RNA-seq experiments to identify the cell type(s) that express ACE2. We first examined a dataset containing 13,822 cells from normal mouse lungs (Reyfman et al., 2019). We performed unsupervised Leiden clustering to separate the cells into distinct populations and then we assigned cell types to major clusters using established markers (Angelidis et al., 2019, Ardini-Poleske et al., 2017, Plasschaert et al., 2018, Wolf et al., 2018). ACE2 was expressed solely in the EpCAM+ clusters that comprise the lung epithelium (Kasper et al., 1995), and was not detected in CD45+ immune cells (Thomas, 1989), PDGFRA+ mesenchymal cells (Li et al., 2018), or TMEM100+ endothelial cells (Figures 3A and 3B) (Moon et al., 2010). We therefore focused on localizing ACE2 within the epithelial lineage. We found that ACE2 was present in a cluster of cells that express secretory markers including MUC5AC, GABRP, and SCGB1A1, which we identified as being comprised of closely related goblet and club cells (Figures 3C and 3D) (Angelidis et al., 2019, Guha et al., 2014, Hovenberg et al., 1996, Rawlins et al., 2009). ACE2 expression was also observed in a subset of LAMP3+ alveolar type 2 cells (Salaun et al., 2004), but was largely absent from RTKN2+ alveolar type 1 cells (Angelidis et al., 2019).
Figure 3.

ACE2 Is Expressed in Secretory Club and Goblet Cells Along with Alveolar Type 2 Cells in the Mammalian Lung
(A) T-SNE clustering of cells from the mouse lung. Cells expressing ACE2 are highlighted in the right panel.
(B) Cells in the mouse lung that express various lineage markers (TMEM100 for endothelial cells, EPCAM for epithelial cells, PDGFRA for mesenchymal cells, and PTPRC for immune cells) are highlighted.
(C) Cells expressing markers for various epithelial lineages are highlighted: RTKN2 for alveolar type 1 cells, LAMP3 for alveolar type 2 cells, FOXJ1 for ciliated cells, GABRP for both goblet and club cells, MUC5AC for goblet cells, and SCGB1A for club cells.
(D) A track plot displaying the expression of ACE2 and several lineage-related genes in different cell populations obtained from Leiden clustering.
(E) T-SNE clustering of cells from the human lung. Cells expressing ACE2 are highlighted in the right panel.
(F) Cells in the human lung that express various lineage markers (TMEM100 for endothelial cells, EPCAM for epithelial cells, PDGFRA for mesenchymal cells, and PTPRC for immune cells) are highlighted.
(G) Cells expressing markers for various epithelial lineages are highlighted: LAMP3 for alveolar type 2 cells, FOXJ1 for ciliated cells, TP63 for basal cells, GABRP for both goblet and club cells, MUC5AC for goblet cells, and SCGB1A1 for club cells.
(H) A track plot displaying the expression of ACE2 and several lineage-related genes in different cell populations obtained from Leiden clustering.
The gene expression data used in (A)–(D) are from GSE121611. The gene expression data used in (E)–(H) are from GSE122960. Additional information on the data sources and sample sizes are included in Table S1.
We then extended our findings to an independent single-cell dataset from human lungs (Reyfman et al., 2019). Consistent with our initial observations, we found that ACE2+ cells were found almost exclusively in the EPCAM+ epithelial compartment (Figures 3E and 3F). Within this lineage, we observed ACE2 expression in the LAMP3+ alveolar type 2 cluster and the MUC5AC+ goblet/club cell cluster (Figures 3G and 3H). Additionally, in human cells, there was some expression of ACE2 in FOXJ1+ ciliated cells (Yu et al., 2008). In total, our combined analysis demonstrates that ACE2 is expressed in the mammalian lung epithelium, and is present at particularly high levels in secretory club and goblet cells as well as in alveolar type 2 cells.
Cigarette Smoke Triggers an Increase in ACE2+ Cells by Driving Secretory Cell Expansion
Our findings on ACE2’s expression pattern suggested a possible explanation for its upregulation in the lungs of cigarette smokers. Chronic exposure to cigarette smoke has been reported to induce the expansion of secretory goblet cells, which produce mucous to protect the respiratory tract from inhaled irritants (Cosio et al., 1980, Liu and Di, 2012, Saetta et al., 2000). Thus, the increased expression of ACE2 in smokers’ lungs could be a byproduct of smoking-induced secretory cell hyperplasia.
To investigate this hypothesis, we examined a dataset of single-cell transcriptomes collected from the tracheas of current smokers and never smokers (Goldfarbmuren et al., 2019). As these cells were derived from the upper airways, they were highly enriched for pseudostratified respiratory epithelial cell types and contained few alveolar cells. Consistent with the initial analysis of this dataset, Leiden clustering revealed a large population of TP63+ basal cells (the putative stem cell population for the airway epithelium) (Rock et al., 2010), an intermediate KRT8high population that showed evidence of ongoing differentiation (Goldfarbmuren et al., 2019), and populations of mature FOXJ1+ ciliated cells and MUC5AC+ secretory cells (Figures 4A, 4B, S3A, and S3B). We also identified markers for submucosal gland (SMG) clusters as well as rare epithelial cell types, including CFTR+ ionocytes (Montoro et al., 2018) and CHGA+ neuroendocrine cells (Gu et al., 2014). Within this dataset, ACE2 was expressed at the highest levels in the MUC5AC+ secretory cell cluster, followed by SMG-secretory cells, KRT8high intermediate cells, and FOXJ1+ ciliated cells.
Figure 4.

Cigarette Smoke Causes the Expansion of ACE2+ Secretory Cells
(A) T-SNE clustering of the transcriptomes from single cells derived from the airway epithelia of smokers and never smokers. Cells expressing ACE2 are highlighted in the right panel.
(B) Cells in the human airway that express various lineage markers (FOXJ1 for ciliated cells, TP63 for basal cells, MUC5AC for goblet cells, and SCGB1A1 for club cells) are highlighted.
(C) GO terms enriched among ACE2-correlated transcripts.
(D) Dot plots displaying the expression of the top ten differentially expressed marker genes for various airway lineages and for ACE2+ cells.
(E) The fraction of cells expressing the indicated marker genes are displayed. FOXJ1 is a marker for ciliated cells, MUC5AC is a marker for goblet cells, and TP63 is a marker for basal cells.
(F) The fractions of cells found in each cell type cluster are displayed.
(G) The number of counts per ACE2+ cell are displayed.
(H) The fraction of ACE2+ cells co-expressing MUC5AC or that are found within the goblet/club cell cluster are displayed.
(I) The 100 top-ranked differentially expressed genes from each cluster in (A) as well as the 100 genes most strongly correlated with ACE2 were used to re-analyze the bulk gene expression data from smokers and non-smokers in Figure 2F. A volcano plot displays the mean expression change of each cell type signature.
(J) The same transcriptional signatures as in Figure 4I were used to re-analyze the data from current smokers and former smokers in Figure 2J. A volcano plot displays the mean expression change of each cell type signature.
(K) ACE2 expression in mouse tracheal explants undergoing mucociliary differentiation.
(L) ACE2 expression in human airway epithelial cells undergoing mucociliary differentiation.
(M) ACE2 expression in human airway epithelial cells that underwent mucociliary differentiation in the presence of clean air or cigarette smoke.
(N) The same transcriptional signatures as in Figure 4I were used to re-analyze the data from smoke exposure during differentiation from Figure 4M. A volcano plot displaying the mean expression change of each cell type signature is displayed.
Data analyzed in (A)–(H) were from GSE131391. Data analyzed in (K) were from GSE75715. Data analyzed in (L) were from GSE39059. Data analyzed in (M) were from GSE135188. Additional information on the data sources and sample sizes are included in Table S1. In (E), (F), and (H), a chi-square test is applied. In (G), a Mann-Whitney U test is applied. In (K)–(M), a Student’s t test is applied. ∗p < 0.05, ∗∗p < 0.005, ∗∗∗p < 0.0005.
We next identified the transcripts whose expression correlated with ACE2. Across all cells, ACE2 levels were strongly correlated with several mucin genes, including MUC1, MUC4, MUC15, and MUC16, as well as other genes associated with barrier epithelia, including ALCAM (Tomita et al., 2000), CLDN7 (Farkas et al., 2015), and TJP3 (González-Mariscal et al., 2003) (Table S2A). Gene ontology analysis revealed that ACE2-correlated transcripts were enriched for genes involved in secretion, glycosylation, and the response to toxic substances, consistent with the airway epithelium’s role as a producer of mucus and a barrier against foreign matter (Figure 4C; Table S2B) (Fahy and Dickey, 2010). ACE2+ correlates overlapped with but were not identical to goblet/club markers: several genes were widely expressed in both populations (MUC16, CLDN7, S100P), while others were more restricted to single lineages (PIGR, PSCA) (Figure 4D). In general, the ACE2+ signature was expressed in both secretory cells and ciliated cells but not in the basal stem cell compartment.
We next separated the cells harvested from current smokers and never smokers and then analyzed each population separately. Consistent with previous reports (Cosio et al., 1980, Liu and Di, 2012, Saetta et al., 2000), we detected a significant expansion of the secretory cell compartment in smokers’ airways, as evidenced by both cluster analysis and by the increase in the number of cells expressing the canonical goblet cell marker MUC5AC (Figures 4E and 4F). FOXJ1+ ciliated cells decreased in abundance, likely reflecting the fact that smoke exposure inhibits ciliogenesis (Tamashiro et al., 2009). These trends remained apparent when the cells from each patient were examined individually (Figures S4C and S4D). Notably, smoking caused an increase in both the number of ACE2+ positive cells and in ACE2 expression within ACE2+ cells (Figures 4G and 4H). This expansion resulted from hyperplasia of the secretory cell compartment: smoke exposure triggered a 2-fold increase in the frequency of MUC5AC+/ACE2+ double-positive cells, while there was no significant change in the frequency of MUC5AC−/ACE2+ cells. In total, these results provide single-cell evidence that the increase in ACE2 expression in smokers’ respiratory tracts is caused by the expansion of mucous-secreting goblet cells that co-express ACE2.
To further validate these findings, we derived gene signatures for each of the cell types identified from tracheal single-cell sequencing, and we applied these signatures to analyze the bulk gene expression datasets from smokers and non-smokers that we had previously investigated (Figure 2). The goblet/club cell gene signature was significantly upregulated in current smokers compared with never smokers, while in former smokers these genes were strongly downregulated (Figures 4I and 4J). A signature based on ACE2-correlated transcripts showed a similar expression pattern. In contrast, a ciliated cell transcriptional signature was strongly downregulated among current smokers. As some FOXJ1+ ciliated cells co-express ACE2, this smoking-dependent suppression of ciliogenesis may partially blunt the increase in ACE2+ cells caused by smoke-induced goblet cell hyperplasia.
Secretory cell differentiation of lung epithelium can be modeled in vitro by culturing cells at an air-liquid interface (ALI) (Jiang et al., 2018, Upadhyay and Palmberg, 2018). Under appropriate conditions, primary respiratory cells growing at an ALI will undergo mucociliary differentiation into a stratified epithelium consisting of ciliated cells, goblet cells, and club cells (Ross et al., 2007). As our single-cell analysis suggested that the coronavirus receptor ACE2 is expressed at higher levels in differentiated secretory and ciliated cells compared with basal stem cells, we investigated whether in vitro mucociliary differentiation increases ACE2 expression. Indeed, in mouse tracheal extracts (Nemajerova et al., 2016) and primary human lung cells (Martinez-Anton et al., 2013), mucociliary differentiation resulted in a highly significant upregulation of ACE2 (Figures 4K and 4L). Finally, to investigate the link between smoking, differentiation, and ACE2 expression, we examined data from human bronchial epithelial cells cultured at an ALI in which cells were either exposed to clean air or to diluted cigarette smoke (Gindele et al., 2020). Remarkably, treatment with cigarette smoke during in vitro differentiation resulted in a significant upregulation of ACE2 relative to cells that were differentiated in clean air (Figure 4M). Smoke exposure increased ACE2 expression by ∼42%, comparable to the increases that we observed between the lungs of non-smokers and smokers (Figure 2). Differentiation in the presence of cigarette smoke similarly resulted in an upregulation of the goblet/club cell transcriptional signature and a downregulation of the ciliated cell transcriptional signature (Figure 4N). In full, our results demonstrate that a subset of lung secretory cells express the coronavirus receptor ACE2, and cigarette smoke promotes the expansion of this cell population.
ACE2 Is Upregulated in Smoking-Associated Diseases and by Viral Infections
To follow up on these observations, we investigated whether ACE2 expression was affected by other lung diseases and/or carcinogen exposures. Indeed, we observed increased ACE2 expression in multiple cohorts of patients with chronic obstructive pulmonary disease (COPD) and idiopathic pulmonary fibrosis (IPF) (Figures S4A–S4D) (Cruz et al., 2019, Kim et al., 2015, McDonough et al., 2019, Pardo et al., 2005). Interestingly, both COPD and IPF are strongly associated with prior cigarette exposure (Baumgartner et al., 1997, Laniado-Laborín, 2009), and COPD in particular has been identified as a risk factor for severe COVID-19 (Lippi and Henry, 2020, Zhao et al., 2020a). However, ACE2 expression was generally not affected by other lung conditions or toxins. We did not observe a significant difference in ACE2 expression in lung samples from a large cohort of patients with asthma or from patients with the lung disease sarcoidosis (Figures S4E and S4F) (Crouser et al., 2009, Voraphani et al., 2014). Similarly, ACE2 expression was unaltered in lung tissue from a mouse model of cystic fibrosis and in mice exposed to a variety of carcinogens, including arsenic, ionizing radiation (IR), and 1,3-butadiene (Figures S4G–S4J) (Chappell et al., 2017, Citrin et al., 2013, Haston et al., 2006, Kozul et al., 2009). We conclude that ACE2 upregulation in the lung is tightly associated with a history of cigarette smoking and is not a universal response to pulmonary diseases.
So-called “cytokine storms,” characterized by high levels of circulating inflammatory cytokines, have been identified as a cause of COVID-19-related mortality (Chen et al., 2020a, Pedersen and Ho, 2020, Shi et al., 2020). Cytokine release can be triggered by viral infections, which serve to induce immune cell activation and expansion (Mogensen and Paludan, 2001). Cigarette smoke is also an inflammatory agent, and smokers tend to exhibit an increase in inflammation-related serological markers (Arnson et al., 2010, Gan et al., 2005). To investigate a potential link between inflammation and the expression of the host factors required for coronavirus infections, we first examined the levels of ACE2 in published datasets of respiratory epithelial cells challenged with different viruses. We observed a highly significant upregulation of ACE2 in airway cells that were infected with two RNA viruses, influenza and Respiratory Syncytial Virus (Figures 5A and 5B) (Ioannidis et al., 2012). Infection with two coronaviruses, SARS and MERS, that are closely related to the 2019 pandemic strain also caused an increase in ACE2 levels (Figures 5C and 5D) (Menachery et al., 2017, Mitchell et al., 2013). Double-stranded RNA that is produced during viral replication can be detected by host pattern recognition receptors, triggering a strong immune response (Gantier and Williams, 2007). Accordingly, transfection of the dsRNA mimic poly(I:C) into airway epithelial cells was sufficient to induce the upregulation of ACE2 (Figure 5E) (Wagener et al., 2014). These results reveal that inflammatory signals—like those triggered by smoking or by a viral infection—are capable of increasing the expression of ACE2 in the respiratory epithelium.
Figure 5.

ACE2 Is an Interferon-Stimulated Gene that Is Upregulated by Viral Infections
(A) ACE2 expression in airway epithelial cells that were infected with influenza.
(B) ACE2 expression in airway epithelial cells that were infected with respiratory syncytial virus.
(C) ACE2 expression in airway epithelial cells that were infected with SARS.
(D) ACE2 expression in airway epithelial cells that were infected with MERS.
(E) ACE2 expression in airway epithelial cells that were transfected with the dsRNA mimic poly(I:C).
(F) ACE2 expression in human tracheal cells that were cultured in the presence of the indicated cytokine for 24 h.
(G) ACE2 expression in human small airway epithelial cells that were cultured in the presence of the indicated cytokine for 24 h.
(H) ACE2 expression in airway epithelial cells that were cultured in the presence of IFN-β.
Each panel displays log2-normalized ACE2 expression relative to a control group. Data analyzed in (A) and (B) were from GSE32138. Data analyzed in (C) were from GSE47963. Data analyzed in (D) were from GSE100504. Data analyzed in (E) were from GSE51392. Data analyzed in (H) were from GSE19392. Additional information on the data sources and sample sizes are included in Table S1. ∗p < 0.05, ∗∗p < 0.005, ∗∗∗p < 0.0005 (Student’s t test).
To further investigate the stimuli that are sufficient to upregulate ACE2, we cultured primary epithelial cells from either the small airways or the trachea in the presence of different compounds. We found that exposure to interferons resulted in a significant upregulation of ACE2 expression (Figures 5F and 5G). IFN-α, IFN-β, and IFN-γ treatment increased ACE2 expression in tracheal cells, while only IFN-α and IFN-β affected ACE2 in small airway cells. To further verify these results, we re-analyzed a published gene expression dataset of airway epithelial cells exposed to IFN-β, and we found a similar increase in ACE2 levels following interferon treatment (Figure 5H) (Rusinova et al., 2013, Shapira et al., 2009). The results identify ACE2 as an interferon-regulated gene and suggest a potential mechanism by which inflammatory stimuli could facilitate SARS-CoV-2 infections.
ACE2 RNA and Protein Levels Are Tightly Correlated
This paper describes a series of analyses and experiments to identify factors that drive the expression of the coronavirus receptor ACE2. However, these results could potentially be confounded if changes in ACE2 RNA levels fail to affect the steady-state levels of ACE2 protein. While we lack the data to directly test that link in the lungs of smokers, we conducted three additional analyses to investigate whether ACE2 RNA and protein expression are generally correlated. First, we examined a dataset of human cancer cell lines that had been profiled at the transcriptional level by RNA-seq and at the protein level by mass spectrometry (Barretina et al., 2012, Nusinow and Gygi, 2020, Nusinow et al., 2020). Across 53 cell lines, ACE2 RNA and protein levels were strongly correlated (r = 0.82, p <.0001; Figure S5A). Indeed, ACE2’s RNA-protein correlation coefficient was higher than 95% of human genes that could be reliably detected (Figure S5B). Next, we compared ACE2 RNA levels with ACE2 immunohistochemistry staining in untransformed human tissues. We similarly observed a strong correlation between ACE2 RNA and protein staining: five of the six tissues with the highest levels of RNA expression exhibited strong staining, while none of the 35 other tissues with lower RNA levels exhibited strong staining (Figure S5C) (Uhlén et al., 2015). Lastly, we directly compared ACE2 expression in seven human cell lines by qRT-PCR and by western blotting. We found that cell lines that displayed the highest levels of ACE2 RNA (LoVo, Caco-2, and Calu3) also exhibited the most ACE2 protein, while cell lines with very low levels of ACE2 RNA (HCT116, CAL148, and A2780) had undetectable levels of ACE2 protein (Figures S5D and S5E). Thus, while we cannot rule out the possibility that ACE2 RNA and protein levels are differentially regulated in certain circumstances, our analysis reveals that ACE2 RNA and protein levels are generally correlated.
Discussion
While SARS-CoV-2 has infected more than 4 million people worldwide, fewer than 5% of COVID-19 cases are fatal (Guan et al., 2020, Our world in data, 2020). Here, we show that cigarette smokers harbor consistently higher levels of the SARS-CoV-2 receptor ACE2 in their respiratory tracts. This upregulation is likely mediated by the expansion of ACE2+ secretory cells caused by chronic smoke exposure. Certain inflammatory cytokines also trigger ACE2 upregulation, which could further influence ACE2 expression due to smoking-associated lung inflammation. The overabundance of ACE2 in the lungs of smokers may partially explain why smokers are significantly more likely to develop severe SARS-CoV-2 infections that require aggressive medical interventions (Guan et al., 2020, Patanavanich and Glantz, 2020, Qi et al., 2020, Zhao et al., 2020a). Furthermore, as quitting smoking is associated with a decrease in ACE2 expression, it is possible that giving up cigarettes may reduce susceptibility to deadly COVID-19.
Several contrasting findings exist in the literature on ACE2 and cigarette exposure (Brake et al., 2020, Ferrari et al., 2007, Ferrari et al., 2008, Leung et al., 2020, Oakes et al., 2018, Yilin et al., 2015, Yue et al., 2018, Cai, 2020). In particular, it has been reported that nicotine and/or cigarette smoke has the potential to downregulate ACE2 expression in certain tissues or cell types (Ferrari et al., 2007, Ferrari et al., 2008, Oakes et al., 2018, Yue et al., 2018). In this manuscript, we focused our analysis on factors affecting ACE2 expression in the mammalian lungs and associated respiratory epithelia. We observed a consistent correlation between smoking history and ACE2 expression that was dose-dependent (Figures 2G and 2H), that could be recapitulated in mice (Figure 2A) and in vitro (Figure 4M), that was detectable in both bulk and single-cell analyses (Figures 2F, 4G, and 4H), and that remained significant when controlling for other demographic variables (Table 1). Thus, we propose that cigarette smoke causes the upregulation of ACE2 expression in the respiratory tract. However, we recognize that individual components found within cigarettes, like nicotine, may have a different effect on ACE2 than whole smoke, and smoking itself could alter ACE2 levels in non-respiratory organs in different ways (Ferrari et al., 2008).
Several previous studies have examined the localization of ACE2 within the respiratory tract (Ding et al., 2004, Hamming et al., 2004, Jia et al., 2005, Lukassen et al., 2020, Sungnak et al., 2020, Travaglini et al., 2020, Wiener et al., 2007, Wu and Zheng, 2020, Xie et al., 2006, Yilin et al., 2015, Zhao et al., 2020b, Ziegler et al., 2020). Consistent with our results, ACE2 expression has been detected in the respiratory epithelium, including prominent staining in alveolar type 2 cells. However, some prior studies have also documented ACE2 expression in lung endothelial and smooth muscle cells (Hamming et al., 2004, Wiener et al., 2007, Xie et al., 2006), which we did not observe. These findings could represent non-specific staining resulting from the particular antibodies that were used (Bradbury and Plückthun, 2015). Alternately, ACE2 may be expressed in mesenchymal or other lineages within the lung, and our inability to detect it may be a limitation of the single-cell samples that we analyzed. Nonetheless, by examining datasets from both mice and humans, and by including cells collected from bronchial brushing, we demonstrated consistently high levels of ACE2 transcripts in the secretory cells that participate in mucociliary clearance (Whitsett, 2018). As these cells line the upper respiratory tract, they may represent the initial site of coronavirus infections, followed by an eventual spread and migration into the alveoli.
Cigarette smoke has a profound impact on the lungs of chronic smokers. Notably, prolonged smoke exposure triggers secretory cell hyperplasia, thereby increasing the production of mucous in the respiratory tract (Cosio et al., 1980, Liu and Di, 2012, Saetta et al., 2000). We found that this smoking-induced expansion of secretory cells also causes an increase in ACE2 levels, as smoking doubled the number of cells co-expressing ACE2 and MUC5AC. Additionally, consistent with a recent report (Ziegler et al., 2020), we found that ACE2 is an interferon-regulated gene, and is over expressed in lung epithelial cells following viral infection or interferon treatment. Lung damage and inflammation caused by smoking could also contribute to ACE2 upregulation. Additionally, we speculate that the interferon-dependent upregulation of ACE2 could create a positive feedback loop for SARS-CoV-2 infections. That is, interferon secretion following an initial infection could increase ACE2 expression within neighboring cells, thereby rendering those cells susceptible to SARS-CoV-2 and facilitating viral dissemination. Accordingly, clinical interventions to dampen the immune response could benefit patients in part by breaking this positive feedback cycle (Roumier et al., 2020, Zhang et al., 2020a).
The factors that mediate overall susceptibility to SARS-CoV-2 infections are poorly understood. We speculate that the increased expression of ACE2 that we found in the lungs of smokers could partially contribute to the severe cases of COVID-19 that have been observed in this patient population. Chronic smokers may exhibit a number of co-morbidities, including emphysema, atherosclerosis, and immune dysregulation (Office of the Surgeon General (US), and Office on Smoking and Health (US), 2004), that are also likely to affect COVID-19 progression. While the effects of smoking can last for years, smoking cessation causes an improvement in lung function and an overall decrease in disease burden (Office of the Surgeon General (US), and Office on Smoking and Health (US), 2004). Quitting smoking leads to a normalization of respiratory epithelial architecture (Bertram and Rogers, 1981), a decrease in hyperplasia (Lee et al., 2001), and a downregulation of ACE2 levels. Thus, for multiple reasons, smoking cessation could eventually lessen the risks associated with SARS-CoV-2 infections.
Limitations
Our analysis in this manuscript has a number of important limitations. First, the relationship between age, sex, and ACE2 expression remains controversial. In the literature, ACE2 expression in the lung has been reported to both increase (Chen et al., 2020b, Muus et al., 2020) and decrease (Booeshaghi and Pachter, 2020, Xie et al., 2006) during aging. Across five rodent and three human datasets, we did not observe a significant correlation in either direction between ACE2 levels and age. It remains possible that such a difference could be found using tissue from older or younger individuals. Additionally, it is possible that ACE2 expression within single-cell types correlates with age, but such differences are not prominent enough to detect using bulk microarray and RNA-seq analysis.
In order for SARS-CoV-2 to infect a host cell, the virus must bind to ACE2 protein that is present on the cell surface. Here, we have described the expression of ACE2 transcripts in mammalian lungs, but our work does not guarantee that stimuli affecting the levels of ACE2 mRNA will have the same effect on ACE2 protein. In general, we have documented a strong correlation between ACE2 mRNA and protein levels (Figure S5), but it remains possible that ACE2 protein is differentially regulated in mammalian lungs, or that the localization of ACE2 protein to the cell surface is strictly controlled. Immunohistochemistry using tissue samples from smokers and virus-infected patients will be needed to confirm that these factors also increase the levels of ACE2 protein available to interact with SARS-CoV-2 particles.
Finally, the exact role of ACE2 as a mediator of disease severity remains to be determined. Mice that were engineered to express high levels of human ACE2 succumbed to infections with the SARS coronavirus more quickly than mice that expressed low levels of human ACE2, suggesting that increasing ACE2 enhances viral susceptibility (McCray et al., 2007). At the same time, ACE2-knockout mice are vulnerable to a variety of lung injuries, and ACE2 expression has been reported to play a protective role in the respiratory tract (Imai et al., 2005, Kuba et al., 2005, Rey-Parra et al., 2012). As ACE2 expression is both necessary and sufficient for SARS-CoV-2 infections (Hoffmann et al., 2020, Zang et al., 2020), it seems highly likely that an expansion of ACE2+ cells in the lungs will facilitate viral dissemination. However, the exact relationship between ACE2 expression and SARS-CoV-2 uptake remains to be determined, and it is possible that the expression of ACE2 has some beneficial consequences as well. Additional work will be required to determine the precise impact of ACE2 levels on the clinical course of COVID19.
STAR★Methods
Key Resources Table
| REAGENT or RESOURCE | SOURCE | IDENTIFIER |
|---|---|---|
| Antibodies | ||
| Recombinant Anti-ACE2 antibody [ERP4435(2)] | Abcam | ab108252 |
| GAPDH antibody (G-9) | Santa Cruz Biotechnology | sc-365062 |
| Goat Anti-Rabbit IgG H&L (HRP) | Abcam | ab-97051 |
| Goat Anti-Mouse IgG (H + L)-HRP Conjugate | Bio-rad | 1706516 |
| Biological Samples | ||
| Primary Small Airway Epithelial Cells | ATCC | ATCC PCS-301-010 |
| Primary Bronchial/Tracheal Epithelial Cells | ATCC | ATCC PCS-300-010 |
| Chemicals, Peptides, and Recombinant Proteins | ||
| IFN-γ | Stemcell Technologies | 78020 |
| IFN-α 2A | Stemcell Technologies | 78076 |
| IFN-β | Stemcell Technologies | 78113 |
| Deposited Data | ||
| See Table S1 | ||
| Experimental Models: Cell Lines | ||
| HCT116 | ATCC | CCL-247 |
| CAL148 | DSMZ | ACC 460 |
| A2780 | ECACC | 93112519 |
| A375 | ATCC | CRL-1619 |
| LoVo | ATCC | CCL-229 |
| Caco-2 | ATCC | HTB-37 |
| Calu3 | ATCC | HTB-55 |
| Oligonucleotides | ||
| ACE2 primer pair 1: CGAAGCCGAAGACCTGTTCTA and GGGCAAGTGTGGACTGTTCC | Integrated DNA Technologies | |
| ACE2 primer pair 2: CAAGAGCAAACGGTTGAACAC and CCAGAGCCTCTCATTGTAGTCT | Integrated DNA Technologies | |
| GAPDH primer pair: TGCACCACCAACTGCTTAGC and GGCATGGACTGTGGTCATGAG | Integrated DNA Technologies | |
| Software and Algorithms | ||
| scanpy | https://genomebiology.biomedcentral.com/articles/10.1186/s13059-017-1382-0 | 1.4.6 |
| Pandas | https://pandas.pydata.org/about/citing.html | 1.0.2 |
| Matplotlib | https://matplotlib.org/3.1.3/citing.html | 3.1.3 |
| multicoreTSNE | https://github.com/DmitryUlyanov/Multicore-TSNE | 0.1 |
| Statsmodels | https://www.statsmodels.org/stable/index.html#citation | 0.11.0 |
Resource Availability
Lead Contact
Further information and requests for resources should be directed to and will be fulfilled by the Lead Contact, Dr. Jason Sheltzer (sheltzer@cshl.edu).
Materials Availability
This study did not generate any new unique reagents.
Data and Code Availability
All of the data used in this manuscript are publicly accessible and are described in Table S1. The code used for performing these analyses is available at github.com/joan-smith/covid19.
Experimental Models and Subject Details
Cell Lines
All cell lines used in this study were acquired from ATCC, except for CAL148 cells that were acquired from DSMZ and A2780 cells that were acquired from ECACC. Primary small airway epithelial cells and primary bronchial/tracheal epithelial cells were cultured in Airway Epithelial Cell Basal Medium (ATCC; Cat. No. PCS-300-030) supplemented with the Bronchial Epithelial Cell Growth Kit (ATCC; Cat. No. PCS-300-040™). HCT116, CAL148, and A375 cell lines were cultured in Dulbecco's Modified Eagle Medium (DMEM) (Gibco; Cat. No. 11995073) supplemented with 10% fetal bovine serum (FBS)(Corning; Cat. No. 35-010-CV). LoVo and A2780 were cultured in RPMI 1640 (Lonza; Cat. No. 12-115F) supplemented with 10% FBS. Calu-3 was cultured in Eagle's Minimum Essential Medium (EMEM) (ATCC; Cat. No. 30-2003™) supplemented with 10% FBS. Caco-2 was cultured in EMEM supplemented with 20% FBS. All cell lines were grown in a humidified environment at 37°C and 5% CO2.
Method Details
Overall Analysis Strategy
The analysis described in this paper was performed using Python, Excel, and Graphpad Prism. Gene expression data were acquired from the Gene Expression Omnibus (GEO)(Edgar et al., 2002), the GTEx portal (GTEx Consortium, 2013), the Broad Institute TCGA Firehose (Broad GDAC Firehose, 2016), the Human Cell Atlas (Regev et al., 2017), the Human Protein Atlas (Uhlen et al., 2010), and the Single-Cell Expression Atlas (Papatheodorou et al., 2020), as described below. For microarray datasets, probeset definitions were downloaded from GEO, and probes mapping to the same gene were collapsed by averaging. For each gene expression comparison, a control population was identified (e.g., young rats, sham-treated mice, non-smokers, etc.), and gene expression values were log2-transformed and normalized by subtraction so that the mean expression of a gene of interest in the control population was 0. Graphs of gene expression values were then generated using GraphPad Prism; all data points are displayed and no outliers were excluded from analysis.
Multivariate Regression and Smoking History
Multivariate regression to investigate the relationship between ACE2 expression and smoking history was performed on the GSE76925 lung tissue dataset and the GSE13933 tracheal epithelium dataset. Regressions were performed in Python using ordinary least squares from the statsmodels package (Seabold and Perktold, 2010). Results reported include the standard errors (‘bse’), betas, and p values.
Single-Cell Analysis
Single-cell clustering and analysis on the datasets listed in Table S1 was performed in Python using the Scanpy and Multicore-TSNE packages (Ulyanov, 2020, Wolf et al., 2018). To filter out low-quality cells, only cells in which 500 or more genes were detected were included in this analysis. Before clustering, transcript counts were counts-per-million normalized and log2 transformed. Highly variable genes were selected using the Seurat approach in Scanpy, and these highly variable genes were used to produce the principal component analysis. A t-SNE projection and unsupervised Leiden clustering were then performed on each dataset using nearest neighbors, as described in the associated code. Parameter selection was performed according to the method described in (Kobak and Berens, 2019).
In order to label each cluster, a gene ranking analysis was obtained using Scanpy. The 20 most highly-ranked genes from each cluster (as determined by a t-test with overestimated variance) were identified. These genes were then compared against gold-standard marker lists from multiple sources to produce the cluster labels (Angelidis et al., 2019, Ardini-Poleske et al., 2017, Goldfarbmuren et al., 2019, Plasschaert et al., 2018, Wolf et al., 2018).
Gene Ontology Analysis
In order to identify the genes whose expression correlates with ACE2, pairwise Pearson correlations coefficients (PCCs) were calculated between ACE2 and every other expressed gene. Genes whose PCC were more than three standard deviations greater than the average gene’s PCC were classified as strongly correlated with ACE2. Gene ontology terms enriched in this group were then identified with GProfiler against the background list of non-strongly correlated genes using a Benjamini-Hochberg FDR of.05 (Raudvere et al., 2019).
Volcano Plots
For the meta-analysis of gene expression changes in the small airways, large airways, and trachea, p values from each independent dataset were combined using Fisher’s method and fold change values were combined by averaging. To deconvolve the bulk gene expression datasets based on cell type signatures, the 100 highest ranking genes from each cell type cluster (found using a t-test with overestimated variance, as described above) were identified and the 100 genes exhibiting the strongest correlation with ACE2 were identified. Volcano plots were generated using the mean expression of the 100 genes comprising each signature and the p-value of a t-test comparing the signature genes to all genes within a dataset.
Cytokine Treatments
Early-passage human tracheal epithelial cells and small airways epithelial cells were acquired from ATCC and cultured according to the supplier’s recommended method. Cells were grown for 48 hours to approximately 70% confluence, treated with the indicated compound for 24 hours, and then total RNA was harvested.
RNA Expression Analysis
qRT-PCR was performed as described in (Vasudevan et al., 2020). In short, RNA was extracted using TRIzol (Life Technologies; Cat. No. 15596018) and then purified with a Qiagen RNeasy Mini Kit (Cat. No. 74106). RNA was converted to cDNA using SuperScript IV VILO Master Mix (Thermo Fisher Scientific; Cat. No. 11756500). Quantitative PCR was performed using SYBR Premier Ex Taq (Takara; Cat No. RR420L) and quantified using the QuantStudio 6 Flex Real-Time PCR system (Applied Biosystems). The primers for ACE2 were as follows: (set 1) 5’-CGAAGCCGAAGACCTGTTCTA and 5’-GGGCAAGTGTGGACTGTTCC and (set 2) 5’-CAAGAGCAAACGGTTGAACAC and 5’-CCAGAGCCTCTCATTGTAGTCT. GAPDH was assessed as a control using primers 5’-TGCACCACCAACTGCTTAGC and 5’-GGCATGGACTGTGGTCATGAG.
Western Blotting
Western blotting was performed as described in (Vasudevan et al., 2020). In short, whole cell lysates were harvested and resuspended in RIPA buffer [25 mM Tris, pH 7.4, 150 mM NaCl, 1% Triton X 100, 0.5% sodium deoxycholate, 0.1% sodium dodecyl sulfate, protease inhibitor cocktail (Sigma; Cat. No. 4693159001), and phosphatase inhibitor cocktail (Sigma, Cat. No. 4906845001)]. Protein lysates were loaded onto a 10% SDS-PAGE gel. The Trans-Blot Turbo Transfer System (Bio-Rad) and polyvinylidene difluoride membranes were used for protein transfer. Antibody blocking was done with 5% milk in TBST (19 mM Tris base, NaCl 137 mM, KCl 2.7 mM and 0.1% Tween-20) for 1 hour at room temperature. Primary antibodies used were ACE2 (Abcam; Cat. No. ab108252), used at a 1:1000 dilution in 5% milk, and GAPDH (Santa Cruz Biotechnology; Cat. No. sc-365062), used at a 1:1000 dilution in 5% milk. Blots were incubated overnight at 4°C. Membranes were then washed three times for 10 minutes each before they were incubated in secondary antibodies for an hour at room temperature. For the ACE2 blot, goat anti-rabbit IgG H&L (HRP) (Abcam; Cat. No. ab-97051) was used as a secondary antibody at a 1:20000 dilution in 5% milk. For the GAPDH blot, goat anti-mouse IgG (H + L)-HRP Conjugate (Bio-Rad; Cat. No. 1706516) was used as a secondary antibody at a 1:20000 dilution in 5% milk. Membranes were washed three more times and then developed using ProtoGlow ECl (National Diagnostics; Cat. No. CL-300).
Quantification and Statistical Analysis
For the qPCR assays in Figures 5F, 5G, and S5D, we performed three biological replicates (for each cytokine) or six biological replicates (for the untreated cells) using two ACE2 primer pairs. Sample sizes of the gene expression datasets that were analyzed are listed in Table S1. Gene expression values in Figures 1, 2, 4K–4M, 5, S1–S3, and S5, and were compared by a two-sided Student’s t-test. Gene expression values in Figure 4G were compared by a Mann-Whitney U test. The fractions of cells expressing a particular marker in Figures 4E, 4F, and 4H were compared by a chi-square test. No outliers were excluded from these analyses.
Acknowledgments
Research in the Sheltzer Lab is supported by an NIH Early Independence award (1DP5OD021385), NIH grant R01CA237652-01, a Damon Runyon-Rachleff Innovation award, an American Cancer Society Research Scholar Grant, and a grant from the New York Community Trust. We thank Julia Kuhl (www.somedonkey.com) for assistance with artwork.
Author Contributions
Conceptualization: J.C.S. and J.M.S.; Methodology: J.C.S. and J.M.S.; Software: J.C.S.; Formal Analysis: J.C.S. and J.M.S.; Writing – Original Draft: J.M.S.; Writing – Review & Editing: J.C.S. and J.M.S; Supervision: J.M.S.; Investigation: J.C.S., E.L.S., V.G., M.L.Y., A.V., K.M.J., and J.M.S.
Declaration of Interests
J.C.S. is a co-founder of Meliora Therapeutics and is an employee of Google, Inc. This work was performed outside of her affiliation with Google and used no proprietary knowledge or materials from Google. J.M.S. has received consulting fees from Ono Pharmaceuticals, is a member of the Advisory Board of Tyra Biosciences, and is a co-founder of Meliora Therapeutics.
Published: May 16, 2020
Footnotes
Supplemental Information can be found online at https://doi.org/10.1016/j.devcel.2020.05.012.
Supplemental Information
References
- Angelidis I., Simon L.M., Fernandez I.E., Strunz M., Mayr C.H., Greiffo F.R., Tsitsiridis G., Ansari M., Graf E., Strom T.M. An atlas of the aging lung mapped by single cell transcriptomics and deep tissue proteomics. Nat. Commun. 2019;10:963. doi: 10.1038/s41467-019-08831-9. [DOI] [PMC free article] [PubMed] [Google Scholar]
- Ardini-Poleske M.E., Clark R.F., Ansong C., Carson J.P., Corley R.A., Deutsch G.H., Hagood J.S., Kaminski N., Mariani T.J., Potter S.S. LungMAP: the molecular atlas of lung development program. Am. J. Physiol. Lung Cell. Mol. Physiol. 2017;313:L733–L740. doi: 10.1152/ajplung.00139.2017. [DOI] [PMC free article] [PubMed] [Google Scholar]
- Arnson Y., Shoenfeld Y., Amital H. Effects of tobacco smoke on immunity, inflammation and autoimmunity. J. Autoimmun. 2010;34:J258–J265. doi: 10.1016/j.jaut.2009.12.003. [DOI] [PubMed] [Google Scholar]
- Barretina J., Caponigro G., Stransky N., Venkatesan K., Margolin A.A., Kim S., Wilson C.J., Lehár J., Kryukov G.V., Sonkin D. The Cancer Cell Line Encyclopedia enables predictive modelling of anticancer drug sensitivity. Nature. 2012;483:603–607. doi: 10.1038/nature11003. [DOI] [PMC free article] [PubMed] [Google Scholar]
- Baumgartner K.B., Samet J.M., Stidley C.A., Colby T.V., Waldron J.A. Cigarette smoking: a risk factor for idiopathic pulmonary fibrosis. Am. J. Respir. Crit. Care Med. 1997;155:242–248. doi: 10.1164/ajrccm.155.1.9001319. [DOI] [PubMed] [Google Scholar]
- Bertram J.F., Rogers A.W. Recovery of bronchial epithelium on stopping smoking. Br. Med. J. (Clin. Res. Ed.) 1981;283:1567–1569. doi: 10.1136/bmj.283.6306.1567. [DOI] [PMC free article] [PubMed] [Google Scholar]
- Booeshaghi A.S., Pachter L. Decrease in ACE2 mRNA expression in aged mouse lung. bioRxiv. 2020 https://www.biorxiv.org/content/10.1101/2020.04.02.021451v1 [Google Scholar]
- Bradbury A., Plückthun A. Reproducibility: standardize antibodies used in research. Nature. 2015;518:27–29. doi: 10.1038/518027a. [DOI] [PubMed] [Google Scholar]
- Brake S.J., Barnsley K., Lu W., McAlinden K.D., Eapen M.S., Sohal S.S. Smoking upregulates angiotensin-converting enzyme-2 receptor: a potential adhesion site for novel coronavirus SARS-CoV-2 (Covid-19) J. Clin. Med. 2020;9:841. doi: 10.3390/jcm9030841. [DOI] [PMC free article] [PubMed] [Google Scholar]
- Butler M.W., Fukui T., Salit J., Shaykhiev R., Mezey J.G., Hackett N.R., Crystal R.G. Modulation of cystatin A expression in human airway epithelium related to genotype, smoking, COPD, and lung cancer. Cancer Res. 2011;71:2572–2581. doi: 10.1158/0008-5472.CAN-10-2046. [DOI] [PMC free article] [PubMed] [Google Scholar]
- Cai G. Tobacco-use disparity in gene expression of ACE2, the receptor of 2019-nCov. 2020. https://www.preprints.org/manuscript/202002.0051/v1 Preprints.
- Carithers L.J., Ardlie K., Barcus M., Branton P.A., Britton A., Buia S.A., Compton C.C., DeLuca D.S., Peter-Demchok J., Gelfand E.T. A novel approach to high-quality postmortem tissue procurement: the GTEx project. Biopreserv. Biobank. 2015;13:311–319. doi: 10.1089/bio.2015.0032. [DOI] [PMC free article] [PubMed] [Google Scholar]
- Chappell G.A., Israel J.W., Simon J.M., Pott S., Safi A., Eklund K., Sexton K.G., Bodnar W., Lieb J.D., Crawford G.E. Variation in DNA-damage responses to an inhalational carcinogen (1,3-butadiene) in relation to strain-specific differences in chromatin accessibility and gene transcription profiles in C57BL/6J and CAST/EiJ mice. Environ. Health Perspect. 2017;125:107006. doi: 10.1289/EHP1937. [DOI] [PMC free article] [PubMed] [Google Scholar]
- Chen G., Wu D., Guo W., Cao Y., Huang D., Wang H., Wang T., Zhang X., Chen H., Yu H. Clinical and immunological features of severe and moderate coronavirus disease 2019. J. Clin. Invest. 2020;130:2620–2629. doi: 10.1172/JCI137244. [DOI] [PMC free article] [PubMed] [Google Scholar]
- Chen Y., Shan K., Qian W. Asians do not exhibit elevated expression or unique genetic polymorphisms for ACE2, the cell-entry receptor of SARS-CoV-2. 2020. https://www.preprints.org/manuscript/202002.0258/v2 Preprint.
- Citrin D.E., Shankavaram U., Horton J.A., Shield W., Zhao S., Asano H., White A., Sowers A., Thetford A., Chung E.J. Role of type II pneumocyte senescence in radiation-induced lung fibrosis. J. Natl. Cancer Inst. 2013;105:1474–1484. doi: 10.1093/jnci/djt212. [DOI] [PMC free article] [PubMed] [Google Scholar]
- The Tabula Muris Consortium, Pisco A.O., McGeever A., Schaum N., Karkanias J., Neff N.F., Darmanis S., Wyss-Coray T., Quake S.R. A single cell Transcriptomic atlas characterizes aging tissues in the mouse. bioRxiv. 2020 doi: 10.1038/s41586-020-2496-1. https://www.biorxiv.org/content/10.1101/661728v2 [DOI] [PMC free article] [PubMed] [Google Scholar]
- Cosio M.G., Hale K.A., Niewoehner D.E. Morphologic and morphometric effects of prolonged cigarette smoking on the small airways. Am. Rev. Respir. Dis. 1980;122:265-21. doi: 10.1164/arrd.1980.122.2.265. [DOI] [PubMed] [Google Scholar]
- Crouser E.D., Culver D.A., Knox K.S., Julian M.W., Shao G., Abraham S., Liyanarachchi S., Macre J.E., Wewers M.D., Gavrilin M.A. Gene expression profiling identifies MMP-12 and ADAMDEC1 as potential pathogenic mediators of pulmonary sarcoidosis. Am. J. Respir. Crit. Care Med. 2009;179:929–938. doi: 10.1164/rccm.200803-490OC. [DOI] [PMC free article] [PubMed] [Google Scholar]
- Crowley J.J., Zhabotynsky V., Sun W., Huang S., Pakatci I.K., Kim Y., Wang J.R., Morgan A.P., Calaway J.D., Aylor D.L. Analyses of allele-specific gene expression in highly divergent mouse crosses identifies pervasive allelic imbalance. Nat. Genet. 2015;47:353–360. doi: 10.1038/ng.3222. [DOI] [PMC free article] [PubMed] [Google Scholar]
- Cruz T., López-Giraldo A., Noell G., Casas-Recasens S., Garcia T., Molins L., Juan M., Fernandez M.A., Agustí A., Faner R. Multi-level immune response network in mild-moderate chronic obstructive pulmonary disease (COPD) Respir. Res. 2019;20:152. doi: 10.1186/s12931-019-1105-z. [DOI] [PMC free article] [PubMed] [Google Scholar]
- Ding Y., He L., Zhang Q., Huang Z., Che X., Hou J., Wang H., Shen H., Qiu L., Li Z. Organ distribution of severe acute respiratory syndrome (SARS) associated coronavirus (SARS-CoV) in SARS patients: implications for pathogenesis and virus transmission pathways. J. Pathol. 2004;203:622–630. doi: 10.1002/path.1560. [DOI] [PMC free article] [PubMed] [Google Scholar]
- Edgar R., Domrachev M., Lash A.E. Gene expression omnibus: NCBI gene expression and hybridization array data repository. Nucleic Acids Res. 2002;30:207–210. doi: 10.1093/nar/30.1.207. [DOI] [PMC free article] [PubMed] [Google Scholar]
- Fahy J.V., Dickey B.F. Airway mucus function and dysfunction. N. Engl. J. Med. 2010;363:2233–2247. doi: 10.1056/NEJMra0910061. [DOI] [PMC free article] [PubMed] [Google Scholar]
- Farkas A.E., Hilgarth R.S., Capaldo C.T., Gerner-Smidt C., Powell D.R., Vertino P.M., Koval M., Parkos C.A., Nusrat A. HNF4α regulates Claudin-7 protein expression during intestinal epithelial differentiation. Am. J. Pathol. 2015;185:2206–2218. doi: 10.1016/j.ajpath.2015.04.023. [DOI] [PMC free article] [PubMed] [Google Scholar]
- Ferrari M.F.R., Raizada M.K., Fior-Chadi D.R. Nicotine modulates the renin-angiotensin system of cultured neurons and glial cells from cardiovascular brain areas of Wistar Kyoto and spontaneously hypertensive rats. J. Mol. Neurosci. 2007;33:284–293. doi: 10.1007/s12031-007-9006-x. [DOI] [PubMed] [Google Scholar]
- Ferrari M.F.R., Raizada M.K., Fior-Chadi D.R. Differential regulation of the renin-angiotensin system by nicotine in WKY and SHR glia. J. Mol. Neurosci. 2008;35:151–160. doi: 10.1007/s12031-007-9025-7. [DOI] [PubMed] [Google Scholar]
- Broad GDAC Firehose . 2016. Broad GDAC firehose.https://gdac.broadinstitute.org/ [Google Scholar]
- Franks T.J., Colby T.V., Travis W.D., Tuder R.M., Reynolds H.Y., Brody A.R., Cardoso W.V., Crystal R.G., Drake C.J., Engelhardt J. Resident cellular components of the human lung: current knowledge and goals for research on cell phenotyping and function. Proc. Am. Thorac. Soc. 2008;5:763–766. doi: 10.1513/pats.200803-025HR. [DOI] [PubMed] [Google Scholar]
- Gan W.Q., Man S.F.P., Sin D.D. The interactions Between cigarette smoking and reduced lung function on systemic inflammation. Chest. 2005;127:558–564. doi: 10.1378/chest.127.2.558. [DOI] [PubMed] [Google Scholar]
- Gantier M.P., Williams B.R.G. The response of mammalian cells to double-stranded RNA. Cytokine Growth Factor Rev. 2007;18:363–371. doi: 10.1016/j.cytogfr.2007.06.016. [DOI] [PMC free article] [PubMed] [Google Scholar]
- Gebel S., Diehl S., Pype J., Friedrichs B., Weiler H., Schüller J., Xu H., Taguchi K., Yamamoto M., Müller T. The transcriptome of Nrf2-/- mice provides evidence for impaired cell cycle progression in the development of cigarette smoke-induced emphysematous changes. Toxicol. Sci. 2010;115:238–252. doi: 10.1093/toxsci/kfq039. [DOI] [PubMed] [Google Scholar]
- Gindele J.A., Kiechle T., Benediktus K., Birk G., Brendel M., Heinemann F., Wohnhaas C.T., LeBlanc M., Zhang H., Strulovici-Barel Y. Intermittent exposure to whole cigarette smoke alters the differentiation of primary small airway epithelial cells in the air-liquid interface culture. Sci. Rep. 2020;10:6257. doi: 10.1038/s41598-020-63345-5. [DOI] [PMC free article] [PubMed] [Google Scholar]
- Goldfarbmuren K.C., Jackson N.D., Sajuthi S.P., Dyjack N., Li K.S., Rios C.L., Plender E.G., Montgomery M.T., Everman J.L., Vladar E.K. Dissecting the cellular specificity of smoking effects and reconstructing lineages in the human airway epithelium. bioRxiv. 2019 doi: 10.1038/s41467-020-16239-z. biorxiv.org/content/10.1101/612747v1 [DOI] [PMC free article] [PubMed] [Google Scholar]
- González-Mariscal L., Betanzos A., Nava P., Jaramillo B.E. Tight junction proteins. Prog. Biophys. Mol. Biol. 2003;81:1–44. doi: 10.1016/s0079-6107(02)00037-8. [DOI] [PubMed] [Google Scholar]
- Gruber M.P., Coldren C.D., Woolum M.D., Cosgrove G.P., Zeng C., Barón A.E., Moore M.D., Cool C.D., Worthen G.S., Brown K.K., Geraci M.W. Human lung project: evaluating variance of gene expression in the human lung. Am. J. Respir. Cell Mol. Biol. 2006;35:65–71. doi: 10.1165/rcmb.2004-0261OC. [DOI] [PMC free article] [PubMed] [Google Scholar]
- GTEx Consortium The genotype-tissue expression (GTEx) project. Nat. Genet. 2013;45:580–585. doi: 10.1038/ng.2653. [DOI] [PMC free article] [PubMed] [Google Scholar]
- Gu X., Karp P.H., Brody S.L., Pierce R.A., Welsh M.J., Holtzman M.J., Ben-Shahar Y. Chemosensory functions for pulmonary neuroendocrine cells. Am. J. Respir. Cell Mol. Biol. 2014;50:637–646. doi: 10.1165/rcmb.2013-0199OC. [DOI] [PMC free article] [PubMed] [Google Scholar]
- Guan W.-J., Ni Z.-Y., Hu Y., Liang W.-H., Ou C.-Q., He J.-X., Liu L., Shan H., Lei C.-L., Hui D.S.C. Clinical characteristics of coronavirus disease 2019 in China. N. Engl. J. Med. 2020;382:1708–1720. doi: 10.1056/NEJMoa2002032. [DOI] [PMC free article] [PubMed] [Google Scholar]
- Guha A., Vasconcelos M., Zhao R., Gower A.C., Rajagopal J., Cardoso W.V. Analysis of Notch signaling-dependent gene expression in developing airways reveals diversity of Clara cells. PLoS One. 2014;9:e88848. doi: 10.1371/journal.pone.0088848. [DOI] [PMC free article] [PubMed] [Google Scholar]
- Hamming I., Timens W., Bulthuis M.L.C., Lely A.T., Navis G.J., van Goor H. Tissue distribution of ACE2 protein, the functional receptor for SARS coronavirus. A first step in understanding SARS pathogenesis. J. Pathol. 2004;203:631–637. doi: 10.1002/path.1570. [DOI] [PMC free article] [PubMed] [Google Scholar]
- Haston C.K., Cory S., Lafontaine L., Dorion G., Hallett M.T. Strain-dependent pulmonary gene expression profiles of a cystic fibrosis mouse model. Physiol. Genomics. 2006;25:336–345. doi: 10.1152/physiolgenomics.00208.2005. [DOI] [PubMed] [Google Scholar]
- Hoffmann M., Kleine-Weber H., Schroeder S., Krüger N., Herrler T., Erichsen S., Schiergens T.S., Herrler G., Wu N.H., Nitsche A. SARS-CoV-2 cell entry depends on ACE2 and TMPRSS2 and is blocked by a clinically proven protease inhibitor. Cell. 2020;181:271–280.e8. doi: 10.1016/j.cell.2020.02.052. [DOI] [PMC free article] [PubMed] [Google Scholar]
- Hovenberg H.W., Davies J.R., Carlstedt I. Different mucins are produced by the surface epithelium and the submucosa in human trachea: identification of MUC5AC as a major mucin from the goblet cells. Biochem. J. 1996;318:319–324. doi: 10.1042/bj3180319. [DOI] [PMC free article] [PubMed] [Google Scholar]
- Hu L., Chen S., Fu Y., Gao Z., Long H., Ren H.-W., Zuo Y., Li H., Wang J., Xv Q.-B. Risk factors associated with clinical outcomes in 323 COVID-19 patients in Wuhan, China. medRxiv. 2020 doi: 10.1093/cid/ciaa539. medrxiv.org/content/10.1101/2020.03.25.20037721v2 [DOI] [PMC free article] [PubMed] [Google Scholar]
- Imai Y., Kuba K., Rao S., Huan Y., Guo F., Guan B., Yang P., Sarao R., Wada T., Leong-Poi H. Angiotensin-converting enzyme 2 protects from severe acute lung failure. Nature. 2005;436:112–116. doi: 10.1038/nature03712. [DOI] [PMC free article] [PubMed] [Google Scholar]
- Ioannidis I., McNally B., Willette M., Peeples M.E., Chaussabel D., Durbin J.E., Ramilo O., Mejias A., Flaño E. Plasticity and virus specificity of the airway epithelial cell immune response during respiratory virus infection. J. Virol. 2012;86:5422–5436. doi: 10.1128/JVI.06757-11. [DOI] [PMC free article] [PubMed] [Google Scholar]
- Jia H.P., Look D.C., Shi L., Hickey M., Pewe L., Netland J., Farzan M., Wohlford-Lenane C., Perlman S., McCray P.B. ACE2 receptor expression and severe acute respiratory syndrome coronavirus infection depend on differentiation of human airway epithelia. J. Virol. 2005;79:14614–14621. doi: 10.1128/JVI.79.23.14614-14621.2005. [DOI] [PMC free article] [PubMed] [Google Scholar]
- Jiang D., Schaefer N., Chu H.W. Air–liquid interface culture of human and mouse airway epithelial cells. In: Alper S., Janssen W.J., editors. Lung Innate Immunity and Inflammation: Methods and Protocols. Springer; 2018. pp. 91–109. [DOI] [PubMed] [Google Scholar]
- Jiang F., Yang J., Zhang Y., Dong M., Wang S., Zhang Q., Liu F.F., Zhang K., Zhang C. Angiotensin-converting enzyme 2 and angiotensin 1–7: novel therapeutic targets. Nat. Rev. Cardiol. 2014;11:413–426. doi: 10.1038/nrcardio.2014.59. [DOI] [PMC free article] [PubMed] [Google Scholar]
- Jonker M.J., Melis J.P., Kuiper R.V., van der Hoeven T.V., Wackers P.F.K., Robinson J., van der Horst G.T., Dollé M.E., Vijg J., Breit T.M. Life spanning murine gene expression profiles in relation to chronological and pathological aging in multiple organs. Aging Cell. 2013;12:901–909. doi: 10.1111/acel.12118. [DOI] [PMC free article] [PubMed] [Google Scholar]
- Kasper M., Behrens J., Schuh D., Müller M. Distribution of E-cadherin and Ep-CAM in the human lung during development and after injury. Histochem. Cell Biol. 1995;103:281–286. doi: 10.1007/BF01457412. [DOI] [PubMed] [Google Scholar]
- Kim W.J., Lim J.H., Lee J.S., Lee S.D., Kim J.H., Oh Y.M. Comprehensive analysis of transcriptome sequencing data in the lung tissues of COPD subjects. Int. J. Genomics. 2015;2015:206937. doi: 10.1155/2015/206937. [DOI] [PMC free article] [PubMed] [Google Scholar]
- Kobak D., Berens P. The art of using t-SNE for single-cell transcriptomics. Nat. Commun. 2019;10:5416. doi: 10.1038/s41467-019-13056-x. [DOI] [PMC free article] [PubMed] [Google Scholar]
- Kozul C.D., Hampton T.H., Davey J.C., Gosse J.A., Nomikos A.P., Eisenhauer P.L., Weiss D.J., Thorpe J.E., Ihnat M.A., Hamilton J.W. Chronic exposure to arsenic in the drinking water alters the expression of immune response genes in mouse lung. Environ. Health Perspect. 2009;117:1108–1115. doi: 10.1289/ehp.0800199. [DOI] [PMC free article] [PubMed] [Google Scholar]
- Kuba K., Imai Y., Rao S., Gao H., Guo F., Guan B., Huan Y., Yang P., Zhang Y., Deng W. A crucial role of angiotensin converting enzyme 2 (ACE2) in SARS coronavirus–induced lung injury. Nat. Med. 2005;11:875–879. doi: 10.1038/nm1267. [DOI] [PMC free article] [PubMed] [Google Scholar]
- Laniado-Laborín R. Smoking and chronic obstructive pulmonary disease (COPD). Parallel epidemics of the 21 century. Int. J. Environ. Res. Public Health. 2009;6:209–224. doi: 10.3390/ijerph6010209. [DOI] [PMC free article] [PubMed] [Google Scholar]
- Lee J.J., Liu D., Lee J.S., Kurie J.M., Khuri F.R., Ibarguen H., Morice R.C., Walsh G., Ro J.Y., Broxson A. Long-term impact of smoking on lung epithelial proliferation in current and former smokers. J. Natl. Cancer Inst. 2001;93:1081–1088. doi: 10.1093/jnci/93.14.1081. [DOI] [PubMed] [Google Scholar]
- Leung J.M., Yang C.X., Tam A., Shaipanich T., Hackett T.L., Singhera G.K., Dorscheid D.R., Sin D.D. ACE-2 expression in the small airway epithelia of smokers and COPD patients: implications for COVID-19. Eur. Respir. J. 2020;55:2000688. doi: 10.1183/13993003.00688-2020. [DOI] [PMC free article] [PubMed] [Google Scholar]
- Li R., Bernau K., Sandbo N., Gu J., Preissl S., Sun X. Pdgfra marks a cellular lineage with distinct contributions to myofibroblasts in lung maturation and injury response. eLife. 2018;7:e36865. doi: 10.7554/eLife.36865. [DOI] [PMC free article] [PubMed] [Google Scholar]
- Li W., Moore M.J., Vasilieva N., Sui J., Wong S.K., Berne M.A., Somasundaran M., Sullivan J.L., Luzuriaga K., Greenough T.C. Angiotensin-converting enzyme 2 is a functional receptor for the SARS coronavirus. Nature. 2003;426:450–454. doi: 10.1038/nature02145. [DOI] [PMC free article] [PubMed] [Google Scholar]
- Lippi G., Henry B.M. Chronic obstructive pulmonary disease is associated with severe coronavirus disease 2019 (COVID-19) Respir. Med. 2020;167:105941. doi: 10.1016/j.rmed.2020.105941. [DOI] [PMC free article] [PubMed] [Google Scholar]
- Liu Y., Di Y.P. Effects of second hand smoke on airway secretion and mucociliary clearance. Front. Physiol. 2012;3:342. doi: 10.3389/fphys.2012.00342. [DOI] [PMC free article] [PubMed] [Google Scholar]
- Lukassen S., Chua R.L., Trefzer T., Kahn N.C., Schneider M.A., Muley T., Winter H., Meister M., Veith C., Boots A.W. SARS-CoV-2 receptor ACE2 and TMPRSS2 are primarily expressed in bronchial transient secretory cells. EMBO J. 2020:e105114. doi: 10.15252/embj.20105114. https://www.embopress.org/doi/full/10.15252/embj.20105114 [DOI] [PMC free article] [PubMed] [Google Scholar]
- Luo X., Xia H., Yang W., Wang B., Guo T., Xiong J., Jiang Z., Liu Y., Yan X., Zhou W. Characteristics of patients with COVID-19 during epidemic ongoing outbreak in Wuhan, China. MedRxiv. 2020 medrxiv.org/content/10.1101/2020.03.19.20033175v1 [Google Scholar]
- Martinez-Anton A., Sokolowska M., Kern S., Davis A.S., Alsaaty S., Taubenberger J.K., Sun J., Cai R., Danner R.L., Eberlein M. Changes in microRNA and mRNA expression with differentiation of human bronchial epithelial cells. Am. J. Respir. Cell Mol. Biol. 2013;49:384–395. doi: 10.1165/rcmb.2012-0368OC. [DOI] [PMC free article] [PubMed] [Google Scholar]
- McCray P.B., Pewe L., Wohlford-Lenane C., Hickey M., Manzel L., Shi L., Netland J., Jia H.P., Halabi C., Sigmund C.D. Lethal infection of K18-hACE2 mice infected with severe acute respiratory syndrome coronavirus. J. Virol. 2007;81:813–821. doi: 10.1128/JVI.02012-06. [DOI] [PMC free article] [PubMed] [Google Scholar]
- McDonough J.E., Ahangari F., Li Q., Jain S., Verleden S.E., Herazo-Maya J., Vukmirovic M., DeIuliis G., Tzouvelekis A., Tanabe N. Transcriptional regulatory model of fibrosis progression in the human lung. JCI Insight. 2019;4:e131597. doi: 10.1172/jci.insight.131597. [DOI] [PMC free article] [PubMed] [Google Scholar]
- Menachery V.D., Mitchell H.D., Cockrell A.S., Gralinski L.E., Yount B.L., Graham R.L., McAnarney E.T., Douglas M.G., Scobey T., Beall A. MERS-CoV accessory ORFs play key role for infection and pathogenesis. mBio. 2017;8 doi: 10.1128/mBio.00665-17. e00665–17. [DOI] [PMC free article] [PubMed] [Google Scholar]
- Millet J.K., Whittaker G.R. Host cell proteases: critical determinants of coronavirus tropism and pathogenesis. Virus Res. 2015;202:120–134. doi: 10.1016/j.virusres.2014.11.021. [DOI] [PMC free article] [PubMed] [Google Scholar]
- Misra V., Lee H., Singh A., Huang K., Thimmulappa R.K., Mitzner W., Biswal S., Tankersley C.G. Global expression profiles from C57BL/6J and DBA/2J mouse lungs to determine aging-related genes. Physiol. Genomics. 2007;31:429–440. doi: 10.1152/physiolgenomics.00060.2007. [DOI] [PubMed] [Google Scholar]
- Mitchell H.D., Eisfeld A.J., Sims A.C., McDermott J.E., Matzke M.M., Webb-Robertson B.J., Tilton S.C., Tchitchek N., Josset L., Li C. A network integration approach to predict conserved regulators related to pathogenicity of influenza and SARS-CoV respiratory viruses. PLoS One. 2013;8:e69374. doi: 10.1371/journal.pone.0069374. [DOI] [PMC free article] [PubMed] [Google Scholar]
- Mogensen T.H., Paludan S.R. Molecular pathways in virus-induced cytokine production. Microbiol. Mol. Biol. Rev. 2001;65:131–150. doi: 10.1128/MMBR.65.1.131-150.2001. [DOI] [PMC free article] [PubMed] [Google Scholar]
- Montoro D.T., Haber A.L., Biton M., Vinarsky V., Lin B., Birket S.E., Yuan F., Chen S., Leung H.M., Villoria J. A revised airway epithelial hierarchy includes CFTR-expressing ionocytes. Nature. 2018;560:319–324. doi: 10.1038/s41586-018-0393-7. [DOI] [PMC free article] [PubMed] [Google Scholar]
- Moon E.H., Kim M.J., Ko K.S., Kim Y.S., Seo J., Oh S.P., Lee Y.J. Generation of mice with a conditional and reporter allele for Tmem100. Genesis. 2010;48:673–678. doi: 10.1002/dvg.20674. [DOI] [PubMed] [Google Scholar]
- Morrow J.D., Zhou X., Lao T., Jiang Z., DeMeo D.L., Cho M.H., Qiu W., Cloonan S., Pinto-Plata V., Celli B. Functional interactors of three genome-wide association study genes are differentially expressed in severe chronic obstructive pulmonary disease lung tissue. Sci. Rep. 2017;7:44232. doi: 10.1038/srep44232. [DOI] [PMC free article] [PubMed] [Google Scholar]
- Muus C., Luecken M.D., Eraslan G., Waghray A., Heimberg G., Sikkema L., Kobayashi Y., Vaishnav E.D., Subramanian A., Smilie C. Integrated analyses of single-cell atlases reveal age, gender, and smoking status associations with cell type-specific expression of mediators of SARS-CoV-2 viral entry and highlights inflammatory programs in putative target cells. bioRxiv. 2020 https://www.biorxiv.org/content/10.1101/2020.04.19.049254v1 [Google Scholar]
- Nemajerova A., Kramer D., Siller S.S., Herr C., Shomroni O., Pena T., Gallinas Suazo C., Glaser K., Wildung M., Steffen H. TAp73 is a central transcriptional regulator of airway multiciliogenesis. Genes Dev. 2016;30:1300–1312. doi: 10.1101/gad.279836.116. [DOI] [PMC free article] [PubMed] [Google Scholar]
- Nusinow D.P., Gygi S.P. A guide to the quantitative proteomic profiles of the cancer cell line encyclopedia. bioRxiv. 2020 https://www.biorxiv.org/content/10.1101/2020.02.03.932384v1 [Google Scholar]
- Nusinow D.P., Szpyt J., Ghandi M., Rose C.M., McDonald E.R., Kalocsay M., Jané-Valbuena J., Gelfand E., Schweppe D.K., Jedrychowski M. Quantitative proteomics of the cancer cell line encyclopedia. Cell. 2020;180:387–402.e16. doi: 10.1016/j.cell.2019.12.023. [DOI] [PMC free article] [PubMed] [Google Scholar]
- Oakes J.M., Fuchs R.M., Gardner J.D., Lazartigues E., Yue X. Nicotine and the renin-angiotensin system. Am. J. Physiol. Regul. Integr. Comp. Physiol. 2018;315:R895–R906. doi: 10.1152/ajpregu.00099.2018. [DOI] [PMC free article] [PubMed] [Google Scholar]
- Office of the Surgeon General (US), and Office on Smoking and Health (US) Centers for Disease Control and Prevention; 2004. The Health Consequences of Smoking: A Report of the Surgeon General. [PubMed] [Google Scholar]
- Our world in data Total confirmed deaths due to COVID-19. 2020. https://www.worldometers.info/coronavirus/
- Papatheodorou I., Moreno P., Manning J., Fuentes A.M.-P., George N., Fexova S., Fonseca N.A., Füllgrabe A., Green M., Huang N. Expression atlas update: from tissues to single cells. Nucleic Acids Res. 2020;48:D77–D83. doi: 10.1093/nar/gkz947. [DOI] [PMC free article] [PubMed] [Google Scholar]
- Pardo A., Gibson K., Cisneros J., Richards T.J., Yang Y., Becerril C., Yousem S., Herrera I., Ruiz V., Selman M., Kaminski N. Up-regulation and profibrotic role of osteopontin in human idiopathic pulmonary fibrosis. PLoS Med. 2005;2:e251. doi: 10.1371/journal.pmed.0020251. [DOI] [PMC free article] [PubMed] [Google Scholar]
- Patanavanich R., Glantz S.A. Smoking is associated with COVID-19 progression: a meta-analysis. MedRxiv. 2020 doi: 10.1093/ntr/ntaa082. https://www.medrxiv.org/content/10.1101/2020.04.13.20063669v1 [DOI] [PMC free article] [PubMed] [Google Scholar]
- Pedersen S.F., Ho Y.C. SARS-CoV-2: a storm is raging. J. Clin. Invest. 2020;130:2202–2205. doi: 10.1172/JCI137647. [DOI] [PMC free article] [PubMed] [Google Scholar]
- Plasschaert L.W., Žilionis R., Choo-Wing R., Savova V., Knehr J., Roma G., Klein A.M., Jaffe A.B. A single-cell atlas of the airway epithelium reveals the CFTR-rich pulmonary ionocyte. Nature. 2018;560:377–381. doi: 10.1038/s41586-018-0394-6. [DOI] [PMC free article] [PubMed] [Google Scholar]
- Qi D., Yan X., Tang X., Peng J., Yu Q., Feng L., Yuan G., Zhang A., Chen Y., Yuan J. Epidemiological and clinical features of 2019-nCoV acute respiratory disease cases in Chongqing Municipality, China: a retrospective, descriptive, multiple-center study. MedRxiv. 2020 medrxiv.org/content/10.1101/2020.03.01.20029397v1 [Google Scholar]
- Rabin R.C. In Italy, coronavirus takes a higher toll on men. The New York Times. 2020 https://www.nytimes.com/2020/03/20/health/coronavirus-italy-men-risk.html March 20, 2020. [Google Scholar]
- Raudvere U., Kolberg L., Kuzmin I., Arak T., Adler P., Peterson H., Vilo J. g:profiler: a web server for functional enrichment analysis and conversions of gene lists (2019 update) Nucleic Acids Res. 2019;47:W191–W198. doi: 10.1093/nar/gkz369. [DOI] [PMC free article] [PubMed] [Google Scholar]
- Rawlins E.L., Okubo T., Xue Y., Brass D.M., Auten R.L., Hasegawa H., Wang F., Hogan B.L.M. The role of Scgb1a1+ Clara cells in the long-term maintenance and repair of lung airway, but not alveolar, epithelium. Cell Stem Cell. 2009;4:525–534. doi: 10.1016/j.stem.2009.04.002. [DOI] [PMC free article] [PubMed] [Google Scholar]
- Regev A., Teichmann S.A., Lander E.S., Amit I., Benoist C., Birney E., Bodenmiller B., Campbell P., Carninci P., Clatworthy M. The human cell atlas. eLife. 2017;6:e27041. doi: 10.7554/eLife.27041. [DOI] [PMC free article] [PubMed] [Google Scholar]
- Remuzzi A., Remuzzi G. COVID-19 and Italy: what next? Lancet. 2020;395:1225–1228. doi: 10.1016/S0140-6736(20)30627-9. [DOI] [PMC free article] [PubMed] [Google Scholar]
- Reyfman P.A., Walter J.M., Joshi N., Anekalla K.R., McQuattie-Pimentel A.C., Chiu S., Fernandez R., Akbarpour M., Chen C.I., Ren Z. Single-cell transcriptomic analysis of human lung provides insights into the pathobiology of pulmonary fibrosis. Am. J. Respir. Crit. Care Med. 2019;199:1517–1536. doi: 10.1164/rccm.201712-2410OC. [DOI] [PMC free article] [PubMed] [Google Scholar]
- Rey-Parra G.J., Vadivel A., Coltan L., Hall A., Eaton F., Schuster M., Loibner H., Penninger J.M., Kassiri Z., Oudit G.Y., Thébaud B. Angiotensin converting enzyme 2 abrogates bleomycin-induced lung injury. J. Mol. Med. 2012;90:637–647. doi: 10.1007/s00109-012-0859-2. [DOI] [PMC free article] [PubMed] [Google Scholar]
- Rock J.R., Randell S.H., Hogan B.L.M. Airway basal stem cells: a perspective on their roles in epithelial homeostasis and remodeling. Dis. Models Mech. 2010;3:545–556. doi: 10.1242/dmm.006031. [DOI] [PMC free article] [PubMed] [Google Scholar]
- Ross A.J., Dailey L.A., Brighton L.E., Devlin R.B. Transcriptional profiling of mucociliary differentiation in human airway epithelial cells. Am. J. Respir. Cell Mol. Biol. 2007;37:169–185. doi: 10.1165/rcmb.2006-0466OC. [DOI] [PubMed] [Google Scholar]
- Roumier M., Paule R., Groh M., Vallee A., Ackermann F. Interleukin-6 blockade for severe COVID-19. MedRxiv. 2020 medrxiv.org/content/10.1101/2020.04.20.20061861v1 [Google Scholar]
- Ruan S. Likelihood of survival of coronavirus disease 2019. Lancet Infect. Dis. 2020 doi: 10.1016/S1473-3099(20)30257-7. [DOI] [PMC free article] [PubMed] [Google Scholar]
- Rusinova I., Forster S., Yu S., Kannan A., Masse M., Cumming H., Chapman R., Hertzog P.J. INTERFEROME v2.0: an updated database of annotated interferon-regulated genes. Nucleic Acids Res. 2013;41:D1040–D1046. doi: 10.1093/nar/gks1215. [DOI] [PMC free article] [PubMed] [Google Scholar]
- Saetta M., Turato G., Baraldo S., Zanin A., Braccioni F., Mapp C.E., Maestrelli P., Cavallesco G., Papi A., Fabbri L.M. Goblet cell hyperplasia and epithelial inflammation in peripheral airways of smokers with both symptoms of chronic bronchitis and chronic airflow limitation. Am. J. Respir. Crit. Care Med. 2000;161:1016–1021. doi: 10.1164/ajrccm.161.3.9907080. [DOI] [PubMed] [Google Scholar]
- Salaun B., de Saint-Vis B., Pacheco N., Pacheco Y., Riesler A., Isaac S., Leroux C., Clair-Moninot V., Pin J.J., Griffith J. CD208/dendritic cell-lysosomal associated membrane protein is a marker of normal and transformed Type II pneumocytes. Am. J. Pathol. 2004;164:861–871. doi: 10.1016/S0002-9440(10)63174-4. [DOI] [PMC free article] [PubMed] [Google Scholar]
- Schaum N., Lehallier B., Hahn O., Hosseinzadeh S., Lee S.E., Sit R., Lee D.P., Losada P.M., Zardeneta M.E., Pálovics R. The murine transcriptome reveals global aging nodes with organ-specific phase and amplitude. bioRxiv. 2019 biorxiv.org/content/10.1101/662254v1 [Google Scholar]
- Seabold, S., and Perktold, J. (2010). Statsmodels: econometric and statistical modeling with Python Proc. of the 9th Python in science conf. (SCIPY 2010), pp. 92–96.
- Shapira S.D., Gat-Viks I., Shum B.O.V., Dricot A., de Grace M.M., Wu L., Gupta P.B., Hao T., Silver S.J., Root D.E. A physical and regulatory map of host-influenza interactions reveals pathways in H1N1 infection. Cell. 2009;139:1255–1267. doi: 10.1016/j.cell.2009.12.018. [DOI] [PMC free article] [PubMed] [Google Scholar]
- Shi Y., Tan M., Chen X., Liu Y., Huang J., Ou J., Deng X. Immunopathological characteristics of coronavirus disease 2019 cases in Guangzhou, China. MedRxiv. 2020 doi: 10.1111/imm.13223. medrxiv.org/content/10.1101/2020.03.12.20034736v1 [DOI] [PMC free article] [PubMed] [Google Scholar]
- Soundararajan R., Stearns T.M., Czachor A., Fukumoto J., Turn C., Westermann-Clark E., Breitzig M., Tan L., Lockey R.F., King B.L., Kolliputi N. Global gene profiling of aging lungs in Atp8b1 mutant mice. Aging (Albany, NY) 2016;8:2232–2252. doi: 10.18632/aging.101056. [DOI] [PMC free article] [PubMed] [Google Scholar]
- Sungnak W., Huang N., Bécavin C., Berg M., Queen R., Litvinukova M., Talavera-López C., Maatz H., Reichart D., Sampaziotis F. SARS-CoV-2 entry factors are highly expressed in nasal epithelial cells together with innate immune genes. Nat. Med. 2020:1–7. doi: 10.1038/s41591-020-0868-6. [DOI] [PMC free article] [PubMed] [Google Scholar]
- Tamashiro E., Xiong G., Anselmo-Lima W.T., Kreindler J.L., Palmer J.N., Cohen N.A. Cigarette smoke exposure impairs respiratory epithelial ciliogenesis. Am J Rhinol Allergy. 2009;23:117–122. doi: 10.2500/ajra.2009.23.3280. [DOI] [PubMed] [Google Scholar]
- Cancer Genome Atlas Research Network, Weinstein J.N., Collisson E.A., Mills G.B., Shaw K.R.M., Ozenberger B.A., Ellrott K., Shmulevich I., Sander C., Stuart J.M. The cancer genome atlas pan-cancer analysis project. Nat. Genet. 2013;45:1113–1120. doi: 10.1038/ng.2764. [DOI] [PMC free article] [PubMed] [Google Scholar]
- Thomas M.L. The leukocyte common antigen family. Annu. Rev. Immunol. 1989;7:339–369. doi: 10.1146/annurev.iy.07.040189.002011. [DOI] [PubMed] [Google Scholar]
- Tomita K., van Bokhoven A., Jansen C.F.J., Bussemakers M.J.G., Schalken J.A. Coordinate recruitment of E-cadherin and ALCAM to cell–cell contacts by α-catenin. Biochem. Biophys. Res. Commun. 2000;267:870–874. doi: 10.1006/bbrc.1999.2040. [DOI] [PubMed] [Google Scholar]
- Travaglini K.J., Nabhan A.N., Penland L., Sinha R., Gillich A., Sit R.V., Chang S., Conley S.D., Mori Y., Seita J. A molecular cell atlas of the human lung from single cell RNA sequencing. bioRxiv. 2020 doi: 10.1038/s41586-020-2922-4. biorxiv.org/content/10.1101/742320v1 [DOI] [PMC free article] [PubMed] [Google Scholar]
- Turetz M.L., O’Connor T.P., Tilley A.E., Strulovici-Barel Y., Salit J., Dang D., Teater M., Mezey J., Clark A.G., Crystal R.G. Trachea epithelium as a “canary” for cigarette smoking-induced biologic phenotype of the small airway epithelium. Clin. Transl. Sci. 2009;2:260–272. doi: 10.1111/j.1752-8062.2009.00129.x. [DOI] [PMC free article] [PubMed] [Google Scholar]
- Uhlén M., Fagerberg L., Hallström B.M., Lindskog C., Oksvold P., Mardinoglu A., Sivertsson Å., Kampf C., Sjöstedt E., Asplund A. Proteomics. Tissue-based map of the human proteome. Science. 2015;347:1260419. doi: 10.1126/science.1260419. [DOI] [PubMed] [Google Scholar]
- Uhlen M., Oksvold P., Fagerberg L., Lundberg E., Jonasson K., Forsberg M., Zwahlen M., Kampf C., Wester K., Hober S. Towards a knowledge-based human protein atlas. Nat. Biotechnol. 2010;28:1248–1250. doi: 10.1038/nbt1210-1248. [DOI] [PubMed] [Google Scholar]
- Ulyanov D. 2020. DmitryUlyanov/Multicore-TSNE.https://github.com/DmitryUlyanov/Multicore-TSNE [Google Scholar]
- Upadhyay S., Palmberg L. Air-liquid interface: relevant in vitro models for investigating air pollutant-induced pulmonary toxicity. Toxicol. Sci. 2018;164:21–30. doi: 10.1093/toxsci/kfy053. [DOI] [PubMed] [Google Scholar]
- Vasudevan A., Baruah P.S., Smith J.C., Wang Z., Sayles N.M., Andrews P., Kendall J., Leu J., Chunduri N.K., Levy D. Single-chromosomal gains can function as metastasis suppressors and promoters in colon cancer. Dev. Cell. 2020;52:413–428.e6. doi: 10.1016/j.devcel.2020.01.034. [DOI] [PMC free article] [PubMed] [Google Scholar]
- Voraphani N., Gladwin M.T., Contreras A.U., Kaminski N., Tedrow J.R., Milosevic J., Bleecker E.R., Meyers D.A., Ray A., Ray P. An airway epithelial iNOS–DUOX2–thyroid peroxidase metabolome drives Th1/Th2 nitrative stress in human severe asthma. Mucosal Immunol. 2014;7:1175–1185. doi: 10.1038/mi.2014.6. [DOI] [PMC free article] [PubMed] [Google Scholar]
- Wagener A.H., Zwinderman A.H., Luiten S., Fokkens W.J., Bel E.H., Sterk P.J., van Drunen C.M. dsRNA-induced changes in gene expression profiles of primary nasal and bronchial epithelial cells from patients with asthma, rhinitis and controls. Respir. Res. 2014;15:9. doi: 10.1186/1465-9921-15-9. [DOI] [PMC free article] [PubMed] [Google Scholar]
- Wang R., Pan M., Zhang X., Fan X., Han M., Zhao F., Miao M., Xu J., Guan M., Deng X. Epidemiological and clinical features of 125 Hospitalized Patients with COVID-19 in Fuyang, Anhui, China. Int. J. Infect. Dis. 2020;95:421–428. doi: 10.1016/j.ijid.2020.03.070. [DOI] [PMC free article] [PubMed] [Google Scholar]
- Whitsett J.A. Airway epithelial differentiation and mucociliary clearance. Ann. Am. Thorac. Soc. 2018;15:S143–S148. doi: 10.1513/AnnalsATS.201802-128AW. [DOI] [PMC free article] [PubMed] [Google Scholar]
- Whitsett J.A., Weaver T.E. Alveolar development and disease. Am. J. Respir. Cell Mol. Biol. 2015;53:1–7. doi: 10.1165/rcmb.2015-0128PS. [DOI] [PMC free article] [PubMed] [Google Scholar]
- Wiener R.S., Cao Y.X., Hinds A., Ramirez M.I., Williams M.C. Angiotensin converting enzyme 2 is primarily epithelial and is developmentally regulated in the mouse lung. J. Cell. Biochem. 2007;101:1278–1291. doi: 10.1002/jcb.21248. [DOI] [PMC free article] [PubMed] [Google Scholar]
- Wolf F.A., Angerer P., Theis F.J. SCANPY: large-scale single-cell gene expression data analysis. Genome Biol. 2018;19:15. doi: 10.1186/s13059-017-1382-0. [DOI] [PMC free article] [PubMed] [Google Scholar]
- Wölfel R., Corman V.M., Guggemos W., Seilmaier M., Zange S., Müller M.A., Niemeyer D., Jones T.C., Vollmar P., Rothe C. Virological assessment of hospitalized patients with COVID-2019. Nature. 2020 doi: 10.1038/s41586-020-2196-x. [DOI] [PubMed] [Google Scholar]
- Wu C., Zheng M. Single-cell RNA expression profiling shows that ACE2, the putative receptor of Wuhan 2019-nCoV, has significant expression in the nasal, mouth, lung and colon tissues, and tends to be co-expressed with HLA-DRB1 in the four tissues. 2020. preprints.org/manuscript/202002.0247/v1 Preprints.
- Wu F., Zhao S., Yu B., Chen Y.M., Wang W., Song Z.G., Hu Y., Tao Z.W., Tian J.H., Pei Y.Y. A new coronavirus associated with human respiratory disease in China. Nature. 2020;579:265–269. doi: 10.1038/s41586-020-2008-3. [DOI] [PMC free article] [PubMed] [Google Scholar]
- Wu Z., McGoogan J.M. Characteristics of and important lessons from the coronavirus disease 2019 (COVID-19) outbreak in China: summary of a report of 72 314 cases from the Chinese center for disease control and prevention. JAMA. 2020;323:1239–1242. doi: 10.1001/jama.2020.2648. [DOI] [PubMed] [Google Scholar]
- Xie X., Chen J., Wang X., Zhang F., Liu Y. Age- and gender-related difference of ACE2 expression in rat lung. Life Sci. 2006;78:2166–2171. doi: 10.1016/j.lfs.2005.09.038. [DOI] [PMC free article] [PubMed] [Google Scholar]
- Xu Y., Li X., Zhu B., Liang H., Fang C., Gong Y., Guo Q., Sun X., Zhao D., Shen J. Characteristics of pediatric SARS-CoV-2 infection and potential evidence for persistent fecal viral shedding. Nat. Med. 2020;26:502–505. doi: 10.1038/s41591-020-0817-4. [DOI] [PMC free article] [PubMed] [Google Scholar]
- Yang J., Zuo W.L., Fukui T., Chao I., Gomi K., Lee B., Staudt M.R., Kaner R.J., Strulovici-Barel Y., Salit J. Smoking-dependent distal-to-proximal repatterning of the adult human small airway epithelium. Am. J. Respir. Crit. Care Med. 2017;196:340–352. doi: 10.1164/rccm.201608-1672OC. [DOI] [PMC free article] [PubMed] [Google Scholar]
- Yang Y., Shen C., Li J., Yuan J., Yang M., Wang F., Li G., Li Y., Xing L., Peng L. Exuberant elevation of IP-10, MCP-3 and IL-1RA during SARS-CoV-2 infection is associated with disease severity and fatal outcome. MedRxiv. 2020 https://www.medrxiv.org/content/10.1101/2020.03.02.20029975v1 [Google Scholar]
- Yilin Z., Yandong N., Faguang J. Role of angiotensin-converting enzyme (ACE) and ACE2 in a rat model of smoke inhalation induced acute respiratory distress syndrome. Burns. 2015;41:1468–1477. doi: 10.1016/j.burns.2015.04.010. [DOI] [PMC free article] [PubMed] [Google Scholar]
- Yu X., Ng C.P., Habacher H., Roy S. Foxj1 transcription factors are master regulators of the motile ciliogenic program. Nat. Genet. 2008;40:1445–1453. doi: 10.1038/ng.263. [DOI] [PubMed] [Google Scholar]
- Yu Y., Fuscoe J.C., Zhao C., Guo C., Jia M., Qing T., Bannon D.I., Lancashire L., Bao W., Du T. A rat RNA-Seq transcriptomic BodyMap across 11 organs and 4 developmental stages. Nat. Commun. 2014;5:3230. doi: 10.1038/ncomms4230. [DOI] [PMC free article] [PubMed] [Google Scholar]
- Yue X., Basting T.M., Flanagan T.W., Xu J., Lobell T.D., Gilpin N.W., Gardner J.D., Lazartigues E. Nicotine downregulates the compensatory angiotensin-converting enzyme 2/angiotensin Type 2 receptor of the renin–angiotensin system. Annals ATS. 2018;15:S126–S127. [Google Scholar]
- Zang R., Castro M.F.G., McCune B.T., Zeng Q., Rothlauf P.W., Sonnek N.M., Liu Z., Brulois K.F., Wang X., Greenberg H.B. TMPRSS2 and TMPRSS4 mediate SARS-CoV-2 infection of human small intestinal enterocytes. bioRxiv. 2020 doi: 10.1126/sciimmunol.abc3582. https://www.biorxiv.org/content/10.1101/2020.04.21.054015v1 [DOI] [PMC free article] [PubMed] [Google Scholar]
- Zhang C., Wu Z., Li J.W., Zhao H., Wang G.Q. The cytokine release syndrome (CRS) of severe COVID-19 and interleukin-6 receptor (IL-6R) antagonist tocilizumab may be the key to reduce the mortality. Int. J. Antimicrob. Agents. 2020:105954. doi: 10.1016/j.ijantimicag.2020.105954. [DOI] [PMC free article] [PubMed] [Google Scholar]
- Zhang R., Ouyang H., Fu L., Wang S., Han J., Huang K., Jia M., Song Q., Fu Z. CT features of SARS-CoV-2 pneumonia according to clinical presentation: a retrospective analysis of 120 consecutive patients from Wuhan city. Eur. Radiol. 2020:1–10. doi: 10.1007/s00330-020-06854-1. [DOI] [PMC free article] [PubMed] [Google Scholar]
- Zhao Q., Meng M., Kumar R., Wu Y., Huang J., Lian N., Deng Y., Lin S. The impact of COPD and smoking history on the severity of Covid-19: A systemic review and meta-analysis. J. Med. Virol. 2020 doi: 10.1002/jmv.25889. [DOI] [PMC free article] [PubMed] [Google Scholar]
- Zhao X., Zhang B., Li P., Ma C., Gu J., Hou P., Guo Z., Wu H., Bai Y. Incidence, clinical characteristics and prognostic factor of patients with COVID-19: a systematic review and meta-analysis. MedRxiv. 2020 medrxiv.org/content/10.1101/2020.03.17.20037572v1 [Google Scholar]
- Zhao Y., Zhao Z., Wang Y., Zhou Y., Ma Y., Zuo W. Single-cell RNA expression profiling of ACE2, the putative receptor of Wuhan 2019-nCov. bioRxiv. 2020 doi: 10.1164/rccm.202001-0179LE. https://www.biorxiv.org/content/10.1101/2020.01.26.919985v1 [DOI] [PMC free article] [PubMed] [Google Scholar]
- Zhou P., Yang X.L., Wang X.G., Hu B., Zhang L., Zhang W., Si H.R., Zhu Y., Li B., Huang C.L. A pneumonia outbreak associated with a new coronavirus of probable bat origin. Nature. 2020;579:270–273. doi: 10.1038/s41586-020-2012-7. [DOI] [PMC free article] [PubMed] [Google Scholar]
- Zhu N., Zhang D., Wang W., Li X., Yang B., Song J., Zhao X., Huang B., Shi W., Lu R. A novel coronavirus from patients with pneumonia in China, 2019. N. Engl. J. Med. 2020;382:727–733. doi: 10.1056/NEJMoa2001017. [DOI] [PMC free article] [PubMed] [Google Scholar]
- Ziegler C.G.K., Allon S.J., Nyquist S.K., Mbano I.M., Miao V.N., Tzouanas C.N., Cao Y., Yousif A.S., Bals J., Hauser B.M. SARS-CoV-2 receptor ACE2 is an interferon-stimulated gene in human airway epithelial cells and is detected in specific cell subsets across tissues. Cell. 2020 doi: 10.1016/j.cell.2020.04.035. [DOI] [PMC free article] [PubMed] [Google Scholar]
Associated Data
This section collects any data citations, data availability statements, or supplementary materials included in this article.
Supplementary Materials
Data Availability Statement
All of the data used in this manuscript are publicly accessible and are described in Table S1. The code used for performing these analyses is available at github.com/joan-smith/covid19.