

Abstract
Clostridioides difficile is the leading cause of nosocomial diarrhea in the United States. The primary virulence factors are two homologous sglucosyltransferase toxins, TcdA and TcdB, that inactivate host Rho-family GTPases. The glucosyltransferase activity has been linked to a “cytopathic” disruption of the actin cytoskeleton and contributes to the disruption of tight junctions and the production of pro-inflammatory cytokines. TcdB is also a potent cytotoxin that causes epithelium necrotic damage through an NADPH oxidase (NOX)-dependent mechanism. We conducted a small molecule screen to identify compounds that confer protection against TcdB-induced necrosis. We identified an enrichment of “hit compounds” with a dihydropyridine (DHP) core which led to the discovery of a key early stage calcium signal that serves as a mechanistic link between TcdB-induced NOX activation and reactive oxygen species (ROS) production. Disruption of TcdB-induced calcium signaling (with both DHP and non-DHP molecules) is sufficient to ablate ROS production and prevent subsequent necrosis in cells and in a mouse model of intoxication.
The leading cause of nosocomial diarrhea in the United States is Clostridioides difficile (formerly Clostridium).1 The organism is a Gram-positive, spore-forming anaerobe that infects the colon, causing a range of disorders that vary in severity from mild diarrhea to fulminant colitis and/or death.2 Elderly people who have been treated with broad spectrum antibiotics, often in a healthcare setting, are at greatest risk for infection, although reports of community-acquired infections in young adults without prior antibiotic use are now commonplace.
The pathology associated with CDI has been principally associated with the action of two toxins, TcdA and TcdB.3 While the respective roles TcdA and TcdB play in patho-genesis have not been fully elucidated, multiple studies suggest that TcdA and TcdB act synergistically.4,5 On the other hand, there are many clinical isolates that lack TcdA, suggesting that the presence of TcdA is not required.6,7 These clinical observations mirror what has been observed in animals. Studies in hamster and mouse infection models using isogenic toxin mutant strains have indicated that the presence of TcdB alone is sufficient to cause significant pathology and symptoms of disease, whereas infection with TcdA+TcdB− strains have been either nonpathogenic or highly attenuated.8−10 All three studies report significant disease with a TcdA−TcdB+ strain and point to a key role for TcdB in pathogenesis.8−,10 Notably, an antibody against TcdB prevents gastrointestinal and systemic CDI in the gnotobiotic piglet model11 and reduces the incidence of CDI recurrence in humans.12
TcdA and TcdB are homologous glucosyltransferases that modify and inactivate Rho family GTPases within the cell. The glucosyltransferase activity has been linked to a “cytopathic” disruption of the actin cytoskeleton and contributes to the disruption of tight junctions and the production of pro-inflammatory cytokines.13,14 In addition to the cytopathic effects, TcdB is also a potent cytotoxin that causes necrotic damage in cells and tissue.15,16 The necrotic response does not depend on the glucosyltransferase activity of the toxin. Instead, TcdB induces the assembly of an NADPH oxidase (NOX) complex and the aberrant production of reactive oxygen species (ROS),17 which at high levels can cause mitochondrial damage, lipid peroxidation, and protein oxidation. The necrotic phenotype is specific to TcdB and occurs at concentrations ≥100 pM in cell and tissue based studies.18 Since necrotic lesions are a hallmark of C. difficile colitis,19 and toxin levels correlate with disease severity in patients,20,21 we speculate that this mechanism is responsible for the TcdB-specific aspects of pathogenesis. This study was initiated as a small molecule inhibitor screen to identify compounds that specifically perturb TcdB-induced necrosis.
RESULTS
The Vanderbilt High-Throughput Screening (HTS) facility has a library of 160,000 drug-like, small molecule compounds selected to maximally represent the chemical diversity of the larger ChemDiv and ChemBridge collections. We designed an HTS-compatible cell viability assay that took advantage of the luminescent ATP indicator, CellTiterGLO. Chinese Hamster Ovary (CHO) cells were incubated with a 10 μM compound for 1 h at 37 °C and then challenged with 30 nM TcdB for 6 h. Each experimental 384-well plate had a positive (no toxin) and negative (toxin only) vehicle control and a Z′ score ≥0.8. A compound providing protection and producing a signal more than 3 standard deviations above the mean of the entire plate was considered a “hit”. We screened a tenth of the Vanderbilt library (16,000 compounds) and identified 176 molecules that conferred protection against TcdB-induced cell death. An example of data from one plate is shown in Figure 1a, and all of the data are available in Supplemental Table 1. Given the large number of “hits”, we decided to evaluate compounds for mechanism of action before going forward with additional screening.
Figure 1.

High throughput screening of small molecules for protection and scavenger activity. (a) CHO cells were pretreated with 10 μM inhibitor for 1 h and exposed to 30 nM TcdB for 6 h, and viability was measured by CellTiter Glo. A representative plate is shown with TcdB treated (Ο), untreated (x), and the plate mean plus three standard deviations (Δ). Luciferase signal in millions. Compounds that maintained viability three standard deviations above the mean were classified as hits (circled). (b) Compounds were assayed for scavenger activity in an HRP H2O2 assay. Data represent the average of four experiments. Wells containing AmplexRed substrate plus HRP enzyme (□) or AmplexRed substrate alone (Ο) were included as controls. Compounds that exhibited an HRP signal below the plate mean minus two standard deviations (Δ) were classified as scavengers (circled).
Based on observations that ROS production drives TcdB-induced necrosis,17 our first consideration was whether any of these compounds were acting as ROS scavengers. To test this, we screened the available hits for scavenger activity in an Amplex Red hydrogen peroxide/peroxidase assay (Figure 1b and Supplemental Table 1). Given that only six of the compounds exhibited scavenger activity, we sought to identify additional compound classes with activity unrelated to scavenging ROS.
Table 1.

|
In examining the chemical structures of the 176 “hits”, we were surprised to notice a prevalence of 60 compounds with a 1,4-dihydropyridine (DHP) core (Supplemental Table 1). There were 5200 DHP compounds within our 160,000 compound library, and there were 647 in the 16,000 compounds we screened. The prevalence of DHP structures among the hits, therefore, was not the result of a biased distribution within the library, but rather, a reflection of a specific structure–activity relationship. Upon closer inspection, we could further classify 44 of the 60 DHPs as 2-methyl-4-phenyl-1,4-dihydropyridine-3-carboxylic acid (DHP-MPC) structures. The subset we screened had 297 DHP-MPC structures while there were 2147 in the entire collection, again suggesting a specific inhibitory effect.
DHPs are well-known inhibitors of L-type calcium channels.22 The observation of an enrichment in the DHP class of calcium channel blockers (CCBs) led us to consider whether TcdB induces a specific calcium response and whether our compounds were disrupting a mechanistic step mediated by calcium release. We first tested the cellular calcium response to TcdB by measuring the intracellular calcium signal at different TcdB concentrations. The calcium ionophore, ionomycin, was included as a control to establish the dynamic range. We observed a significant calcium signal, similar to the level of calcium release induced by addition of ionomycin, at concentrations of 100, 10, and 1 nM TcdB at 3 h postintoxication (Figure 2a), which is consistent with the TcdB concentrations that induce a necrotic cell death response.18 Since the necrotic response occurs with a glucosyltransferase-dependent mechanism, we tested whether a glucosyltransferase defective mutant (one where Asp286 and Asp288 in the glucosyltransferase active site have been mutated to alanines, TcdB DXD) was capable of inducing a calcium response. When the effects of TcdB and TcdB DXD were compared, we noted no statistical differences in the calcium signals (Supplemental Figure 1A) or in the cell viability profiles (Supplemental Figure 1B). We note that while the necrotic cellular response has been observed in multiple cell lines,15−18 we used Hela cells for these and all subsequent validation experiments, as they are highly tractable and human-derived.
Figure 2.

Calcium signaling in response to TcdB. (a) Calcium release in response to toxin was measured in Hela cells by pretreating with FluoForte calcium indicator for 1 h prior to intoxication with TcdB for 3 h. The relative calcium signal was determined by normalizing to unintoxicated cells. The ionophore ionomycin was included as a positive control for intracellular calcium release. Toxin concentrations were compared to ionomycin induced calcium release for statistical significance (*<0.05 Student’s t-test). Standard deviation is shown (n = 3). (b) Kinetics of calcium release in response to 10 nM TcdB was determined at 5 min intervals using the FluoForte assay. The trace represents the average of three independent experiments, with 24 technical replicates per time point each normalized to unintoxicated controls. (c) Hela cells were treated with 10 nM TcdB for the indicated time, and active PKC was measured by ELISA (n = 3 with standard errors indicated). (d) Hela cells were pretreated with Bis II or vehicle (mock) plus ROS indicator for 1 h prior to intoxication with 10 nM TcdB. At 3 h postintoxication, ROS and viability were measured (n =5). Relative signal and standard deviations are shown. Statistical significance represents Student’s t-test (*<0.05) compared to mock.
We then measured the kinetics of the calcium response. Hela cells were treated with 10 nM toxin, and the calcium signal was monitored over 5 min intervals for 2 h (Figure 2b). We observed an initial calcium spike that peaked at 10 to 15 min postintoxication and declined to baseline over the course of the next 20 min. While this signal is transient and small in magnitude, all points are statistically significant (t-test p <0.05) compared to unintoxicated controls. Interestingly, a second, statistically significant increase in calcium could be detected between 40 and 45 min postintoxication (t-test p <0.05) and resulted in a sustained increase in signal over time (Figure 2b).
Calcium is a pleiotropic signaling molecule that is involved in the activation of multiple intracellular pathways. The activation of protein kinase C (PKC) is prevalent upon calcium mobilization in many of these pathways. PKC is known to be critical for the activation of the NOX complex and subsequent production of ROS.23 To determine if the calcium release elicited by TcdB leads to PKC activation, Hela cells were intoxicated at 15 min intervals and assayed for active PKC by ELISA. At 15 min postintoxication, an increase in active PKC is detected (Figure 2c) with activity peaking 30 min postintoxication, a statistically significant increase compared to time zero (t-test p < 0.05). The kinetics of PKC activation reveals that peak activation is immediately subsequent to the initial calcium release shown in Figure 2b.
To determine if PKC activation specifically contributes to toxin-induced NOX activation and ROS production, the PKC inhibitor bisindolylmaleimide II (Bis II) was tested in the ROS and viability assays. Hela cells were pretreated with Bis II or DMSO for 1 h and challenged with 10 nM TcdB. ROS production and viability were measured 3 h postintoxication. Cells treated with Bis II produced significantly less ROS (t-test p < 0.05) and were significantly protected in the viability assay (t-test p < 0.05) (Figure 2d). Together, these results provide a mechanistic link from calcium mobilization to ROS production through the activation of PKC.
We next tested our panel of 176 compounds for their capacity to attenuate this toxin-induced calcium response. Hela cells were incubated with a 10 μM compound per well and intoxicated with 10 nM TcdB for 3 h. The assay revealed 27 compounds that inhibited the toxin-induced calcium signal, with inhibition defined as an average calcium signal one standard deviation below the plate mean (or <25,800) (Figure 3a and Supplemental Table 1). Interestingly, 17/27 (63%) inhibitory compounds were of the DHP class.
Figure 3.

Cellular response to TcdB in the presence of EGTA. (a) The 176 compounds identified in Figure 1 were screened in the FluoForte calcium release assay. Hela cells were pretreated with a 10 μM compound or vehicle for 1 h prior to intoxication with 10 nM TcdB for 3 h. Cells treated with just toxin (□) or untreated cells (Ο) were included as controls. A (Δ) is used to denote one standard deviation below the mean of the plate (n = 3). (b) Hela cells were preincubated with 5 mM EGTA or vehicle (mock) for 1 h prior to intoxication with 10 nM toxin. Kinetic calcium responses were determined using the FluoForte calcium reporter at 10 min intervals. The traces represent the average of 3 independent experiments per condition. (c) Hela cells were preincubated with EGTA for 1 h and then intoxicated with 10 nM TcdB. Calcium levels at 3 h postintoxication were measured using the FluoForte calcium reporter. Relative response was calculated by comparing to vehicle treated intoxicated cells. Statistical significance represents Student’s t-test (**<0.01, *<0.05) compared to vehicle treated. (d) Hela cells preincubated with EGTA for 1 h prior to intoxication with 10 nM TcdB were assayed for ROS production and viability at 3 h postintoxication. Statistical significance represents Student’s t-test (**<0.01, *<0.05) compared to vehicle treated.
Given that DHPs are known to target calcium channels on the plasma membrane,24 we next sought to determine if the toxin-induced calcium signal was dependent on the influx of extracellular calcium. Hela cells were preincubated with a membrane impermeable form of the calcium chelator EGTA for 1 h prior to challenge with 10 nM TcdB. Calcium kinetics was measured at 10 min intervals. As shown in Figure 3b, 5 mM EGTA completely abolishes calcium signaling in response to toxin. Additionally, EGTA concentrations that disrupt the toxin-induced calcium signal (1.25, 2.5, and 5 mM EGTA) (Figure 3c) also abrogate ROS production and confer protection in the viability assay (Figure 3d). Given that EGTA is cell impermeable and can only exert an effect on pathways that utilize extracellular calcium influx, this observation suggests that the participation of plasma membrane calcium channels, such as the L-type calcium channels, is needed as an initial step in toxin-induced necrosis.
We then created a panel of 15 compounds (Table 1, compounds 1–15) to validate and evaluate in greater depth. From the original 176 “hits”, we selected and repurchased three DHPs and eight compounds with diverse chemical structures. We also selected amlodipine (compound 7) and nifedipine (compound 5), two DHPs in clinical use, as well as a DHP of a related structure (compound 14).
Initially, a dose response screen was conducted in Hela cells using the CellTiter Glo viability assay. Hela cells were preincubated with compound concentrations of 10, 5, 1, 0.5,0.1, or 0.05 μM for 1 h prior to intoxication with 10 nM TcdB. Viability was assessed 3 h postintoxication (Figure 4a and Table 1), and 10 of the 15 tested compounds showed significant protection for at least one concentration. Amlodipine (compound 7), nifedipine (compound 5), the three DHPs that emerged from the initial screen (compounds 4, 8, and 15), and five chemically diverse compounds (compounds 2, 3, 6, 9, and 11) conferred protection in the viability assay as compared to cells treated with vehicle. Compounds 3 and 6, as well as nifedipine, were only effective at the 10 μM dose (t-test, p < 0.05). Compound 11 and amlodipine conferred protection at 10 and 5 μM (t-test, p <0.05), while compounds 2 and 9 inhibited cytotoxicity down to 1 μM (t-test, p < 0.05). As the concentrations were diluted further, compounds 4, 8, and 15 (all DHPs) emerged as the only compounds still effective at the 0.5 μM dose. Compound 8 was efficacious at all tested concentrations from 10 μM to0.05 μM (t-test, p < 0.05). These data suggest that the DHPs emerging from the initial screen are uniquely potent inhibitors of TcdB-induced cell death. Additionally, compounds 2 and 9 emerged as non-DHP lead molecules based on their dose response in the viability assay.
Figure 4.

Dose response for a subset of compounds in viability and calcium assays. (a) Compounds 1–15 or vehicle were screened in the viability assay. Hela cells were preincubated with compounds for 1 h and then intoxicated with 10 nM TcdB for 3 h. Viability was measured using CellTiter Glo. Data represent three independent experiments (standard deviation is shown), *<0.05 Student’s t-test. (b) Compounds 1–15 or vehicle were screened for dose responses in the FluoForte assay. Hela cells were incubated with compound for 1 h prior to adding FluoForte and intoxicated with 10 nM TcdB for 3 h. Data represent three independent experiments (standard deviation is shown), *<0.05 Student’s t-test. (c) The kinetics of calcium release for Hela cells treated with 10 μM of lead dihydropyridine compounds (n = 3).
To further validate and classify the panel of 15 compounds, they were then screened in the calcium release assay. End point analysis at 3 h postintoxication (Figure 4b and Table 1) revealed that amlodipine, nifedipine, and compound 6 suppressed calcium release when used at the 10 μM concentration (t-test, p < 0.05), which correlates with their ability to confer protection against the toxin in the viability assay. Compounds 2 and 11 inhibited calcium release in response to the toxin when a 10 or 5 μM compound was applied, also in line with their inhibition profile in the viability assay. Similar to the cytotoxicity assay, compound 9 conferred inhibition in the calcium assay down to 1 μM. Compound 3 (a non-DHP) did not disrupt calcium signaling, suggesting that it is mechanistically distinct from the other compounds. The dose response of the DHP compounds 4, 8, and 15 showed efficacy down to the 0.5 μM concentration, with compound 8 again inhibiting at all concentrations tested (10 μM to 0.1 μM), all consistent with phenotypes in the viability assay. Of the ten compounds that were effective in the viability assay, nine of them were also inhibitors for TcdB-induced calcium release, revealing a mechanistic link between ablation of calcium response and protection from cytotoxicity.
Since toxin-induced calcium signaling involves two distinct phases, the nine compounds that were effective at suppressing calcium were further analyzed to determine which phase of the calcium signal was disrupted. When compared to the kinetic profile of vehicle treated cells, each of the nine compounds attenuated (compounds 2, 4, and 15) or completely abrogated (compounds 5, 6, 7, 8, and 9) the initial calcium peak occurring at 20 min postintoxication (Figure 4c). For all compounds tested, the second, sustained wave of calcium release was not observed.
TcdB-induced necrosis is dependent on the assembly and activation of NOX and generation of ROS.17 To determine the relative time frames of calcium release, ROS generation, and the release of dead cell protease (an indicator of the necrotic phenotype), the ROS and protease release responses were assayed over a similar time course as the calcium responses. Hela cells were incubated with ROS indicator and challenged with a range of TcdB concentrations from 100 nM to 10 pM. The ROS signal was recorded every 10 min (Figure 5a). A statistically significant increase in ROS signal occurred between 40 and 50 min postintoxication for toxin concentrations at 100, 10, and 1 nM (t-test, p < 0.05). Necrosis was also monitored in this assay by adding the CytoTox Glo reagent 40 min postintoxication (Figure 5b). Necrosis was detected at a statistically significant level (t-test, p < 0.05) between 50 and 60 min postintoxication. When the calcium response is overlaid with the ROS and necrosis assays, the kinetic profile indicates that the calcium events precede ROS production and necrosis (Figure 5c).
Figure 5.
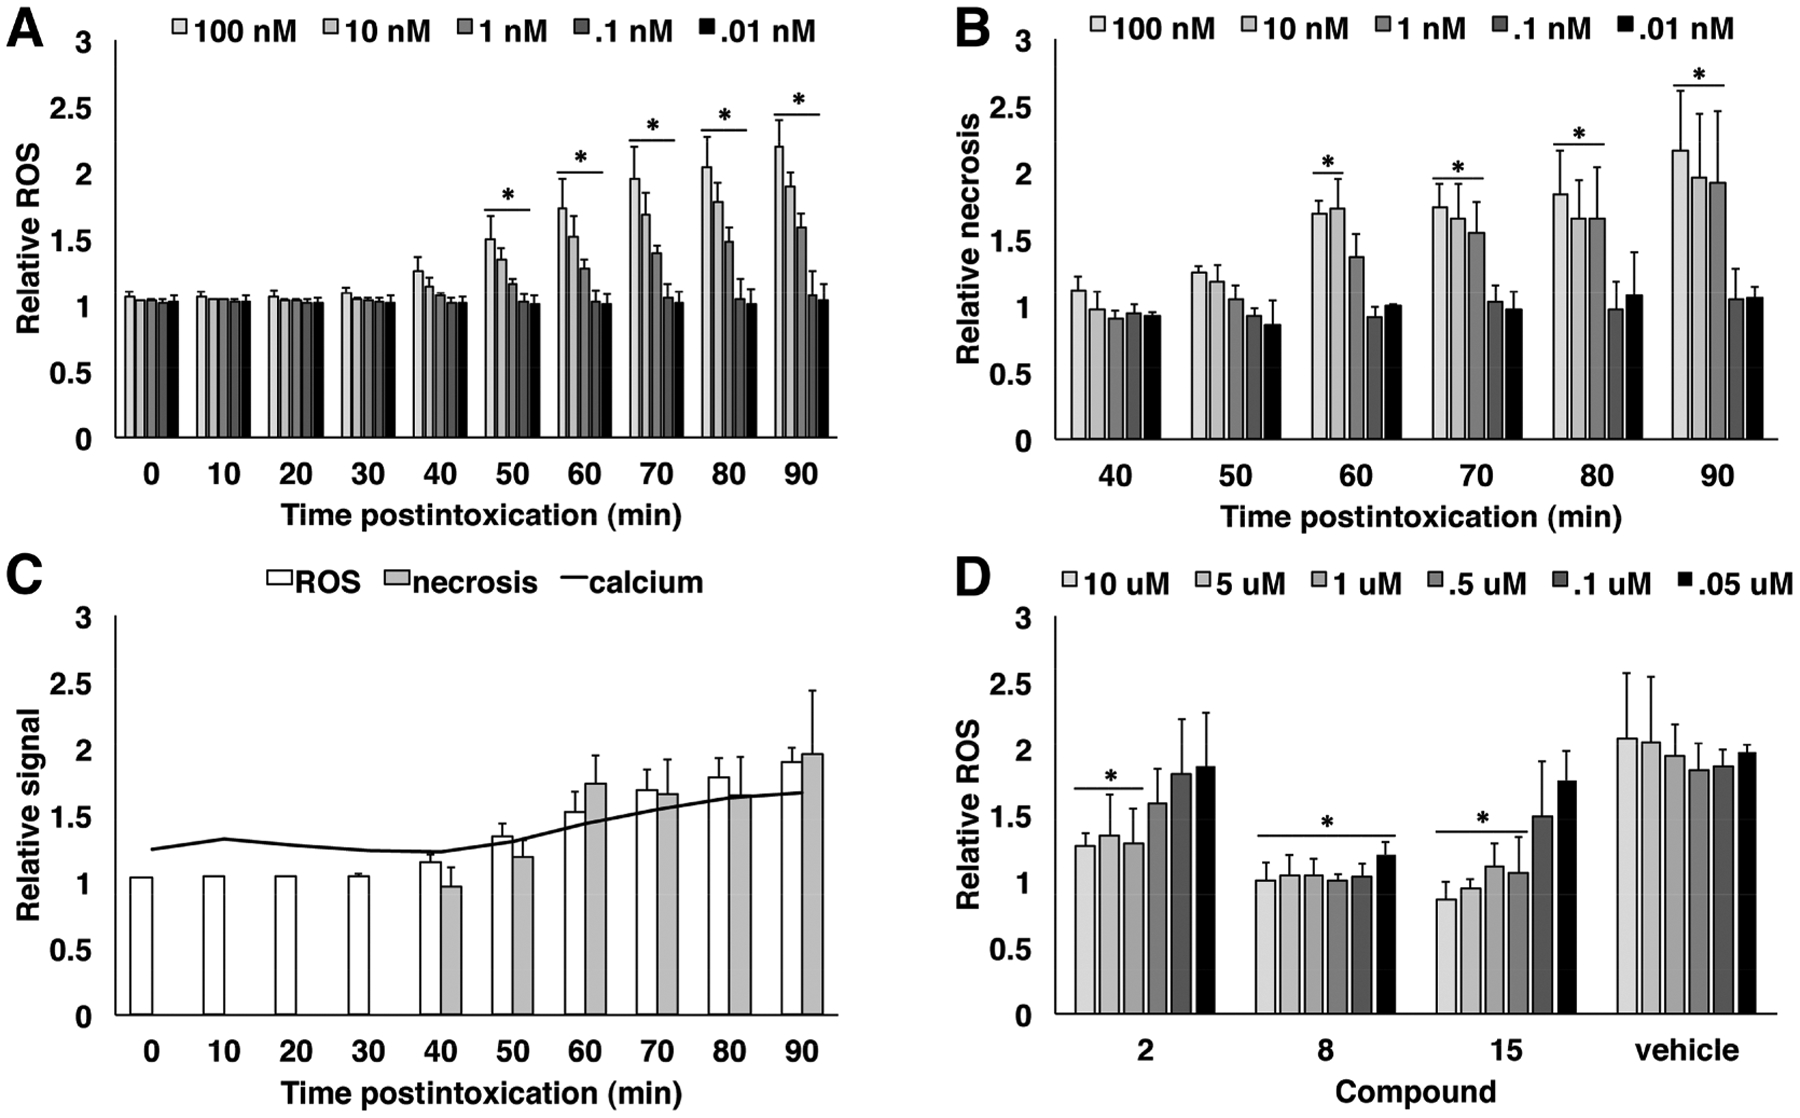
Kinetics of cellular responses to intoxication and dose response of lead compounds. (a) The kinetics of ROS production was measured using an intracellular oxidative stress indicator. Hela cells were incubated with ROS indicator for 1 h and challenged with TcdB, and ROS was measured over 10 min intervals. Relative ROS was determined by comparing treated samples to unintoxicated control wells. Statistically significant increases in ROS production were identified by comparing each time point to its predecessor using the Student’s t-test (*<0.05). Standard deviation is shown (n = 3). (b) The ROS assay in (a) was combined with CytoTox Glo to measure the levels of necrosis in response to ROS production. Necrotic responses were measured every 10 min beginning 40 min postintoxication. Relative necrosis represents the treated sample normalized to an unintoxicated control. Statistical significance was calculated by comparing each time point to time zero of the assay (*<0.05). Standard deviation is shown (n = 3). (c) An overlay of the data from Figure 2B, 4A, and 4B to show the relative kinetics of the calcium signal, ROS generation, and dead cell protease release. (d) Compounds 2, 8, and 15 as well as vehicle were assayed for dose response in the ROS assay. Hela cells were preincubated with compound or vehicle for 1 h prior to intoxication with 10 nM TcdB. End point readings were taken at 3 h postintoxication, and relative ROS were calculated by normalizing to an unintoxicated control. Statistical significance represents Student’s t-test (*<0.05) comparing compound treated wells to intoxicated wells that received no compound. Standard deviation is shown (n = 3).
Since the majority of compounds that inhibit TcdB-induced cell death also suppress calcium release, we selected a subset to further interrogate in the ROS assay. Compounds 2, 8, and 15 were tested for their capacity to abrogate ROS production. Hela cells were exposed to compounds or vehicle for 1 h prior to intoxication with 10 nM TcdB (Figure 5d). All three compounds inhibited ROS at 10, 5, and 1 μM compared to the vehicle control (t-test, p < 0.05). The DHP molecules (compounds 8 and 15) were effective at lower concentrations with compound 15 losing efficacy at 0.5 μM, while compound 8 again showed activity down to the lowest concentration tested, 0.05 μM. These observations are consistent with their dose response profiles in the viability and calcium assays.
Based on their ability to confer protection against TcdB-induced necrosis in cell culture, compounds 2, 8, and 15 were advanced to a murine model of intoxication for further testing. Mice were intoxicated by colonic enema in the presence or absence of compound and monitored for 4 h. The colonic tissues were harvested and evaluated for damage based on criteria of edema, inflammation, and epithelial injury.25 The unintoxicated control mice had limited signs of damage with minimal increases in surface apoptosis as shown in Figure 6a. Tissue from the toxin treated, vehicle control mice had signs of epithelial damage along with inflammation and edema, resulting in overall pathology scores which were statistically significant compared to untreated control mice (Figure 6b, Kruskal–Wallis p < 0.005). Compound 15 conferred some protection upon intoxication (Figure 6a), albeit not statistically significant when the cumulative total injury scores of inflammation, edema, and epithelial injury were compared to those from control mice (Figure 6b, Kruskal–Wallis p < 0.05). However, compounds 2 and 8 were able to protect against colonic tissue injury by attenuating epithelial injury as well as reducing inflammation and edema (Figure 6b, Kruskal–Wallis p > 0.1). Interestingly, these compounds represent different chemical classes with compound 8 having a DHP core, but they are similar in their abilities to abrogate calcium and ROS events and confer protection against cytotoxicity in cell culture assays. The protection afforded by compounds 2 and 8 demonstrates the efficacy of small molecules in preventing TcdB-induced necrosis in primary tissue.
Figure 6.

Lead compounds assayed in the murine model of intoxication. (a) Mice were exposed to 50 μg TcdB by rectal enema for 4 h before tissues were harvested. Representative images are shown for all treatment conditions. Scale bar represents 100 μm. (b) A cumulative injury score was calculated by adding the edema, inflammation, and epithelial injury scores for each mouse and averaging the scores for the group. The box represents the interquartile range with the median represented by the intrabox line. The whiskers represent the highest and lowest scores per condition. **<0.005, *<0.05 Kruskal−Wallis comparing each group to the unintoxicated control group (n of 5 per group).
DISCUSSION
This project started as an effort to identify small molecule inhibitors of TcdB-induced necrosis. The initial screen was performed using 30 nM TcdB, a concentration that has been associated with a rapid, ROS-mediated, cellular necrosis in both cell lines and tissue studies.17,18 In a previous study, we observed that N-acetylcysteine, an antioxidant, could protect against TcdB-induced necrosis in tissue.17 We were therefore surprised to observe that out of our initial 176 “hits” (Figure 1a), only a small subset of 6/176 (3.4%) compounds functioned as ROS scavengers (Figure 1b). It may be that the design of our screening assay preferentially selected for compounds that could block an earlier step in the pathway and that it is difficult to neutralize the ROS response with a 10 μM concentration. Since the majority of lead molecules did not exhibit scavenger activity, we considered other mechanistic steps that could be important for TcdB-induced necrosis.
An important mechanistic clue came from the realization that, of the 176 hits, 60 contained a common scaffold defined by a DHP core. DHPs have been extensively studied as inhibitors of L-type calcium channels, and some are prescribed to alleviate cardiac stress. DHPs specifically disrupt L-type calcium channels that are highly expressed on cardiac tissue but are also apparent in the colonic epithelium.26 The emergence of a calcium channel blocker as an inhibitor led us to wonder if TcdB toxicity was associated with measurable changes in cytosolic calcium levels. We assayed concentrations of toxin across the previously defined necrotic range and observed a TcdB-induced calcium response. A kinetic analysis revealed two distinct calcium responses: a small, transient signal which occurs within the first few minutes of toxin exposure, and a larger signal which emerges after 40−45 min. As calcium is a pleiotropic second messenger, we sought to determine how it is mechanistically linked to toxin-induced ROS production and subsequent necrosis. Interestingly, PKC is activated early postintoxication, with detection of active PKC occurring as early as 15 min and peaking at 30 min postintoxication. The kinetics of the PKC response shows that activation occurs immediately following the initial calcium release, consistent with PKC requiring calcium for activation. The contribution of PKC to ROS production and necrosis was confirmed using the PKC inhibitor Bis II, which abrogated the ROS response and conferred protection upon toxin challenge.
L-Type calcium channels mediate the influx of calcium from the extracellular space. To confirm that extracellular calcium signaling is responsible for the toxin-induced calcium elevation detected, we added the cell impermeable variant of EGTA. When EGTA chelates extracellular calcium, it completely abolishes all toxin-induced calcium events. These observations are in line with previous experiments that reported on the timing and source of calcium signaling induced by TcdB.27 Since the L-type calcium channel subunits are on the plasma membrane,26 we propose that they are responsible for a rapid signal that is required for the downstream changes in the calcium signal, PKC activation, and aberrant activation of NOX that produces ROS levels associated with necrosis.
While the DHP motif emerged as a common scaffold, we identified additional, chemically diverse compounds with inhibitory activities as well. A 15-member panel including DHP as well as non-DHP molecules was assembled for further analysis using dose response assays. We included amlodipine and nifedipine, DHP CCBs that are commonly used to treat hypertension, for comparison. Interestingly, when compared to amlodipine or nifedipine, several molecules from the HTS screen showed better efficacy across a broader range of doses. The majority of lead compounds that outperformed amlodipine and nifedipine in the viability dose response assay was DHPs (compounds 4, 8, and 15). However, compound 2, which does not have a DHP core, also demonstrated a broader range of effectiveness. When the lead molecules were assayed for perturbation of toxin-induced calcium signaling, the dose response curves in the calcium assay correlated with those measured in the viability assay. Based on these data, we conclude that an early calcium signal is involved in the mechanism of TcdB-induced necrosis. Further studies will be needed to fully understand the mechanism for how this occurs.
While none of the lead molecules function directly as ROS scavengers, we were interested in their ability to prevent ROS generation in response to toxin. First, we examined the timing of calcium signaling relative to ROS generation in response to TcdB. The initial calcium event occurs well in advance of ROS generation. Interestingly, the second wave of calcium immediately precedes the first detectable ROS signal. Given the kinetics of calcium, ROS, and necrosis, this suggests that the early calcium events could have a causal relationship with ROS production. For the compounds tested in the ROS assay (2, 8, and 15), the ability of a compound to inhibit calcium events at a given concentration directly correlates with its abilty to suppress ROS production.
Since compounds 2, 8, and 15 all demonstrated strong calcium channel blocking activity, an ability to suppress ROS, and conferred significant protection against cytotoxicity in tissue culture assays, we tested them in a murine toxin challenge model. Advancing these compounds to an animal model allowed us to evaluate the response in the context of physiological tissues and is a step toward evaluating these compounds in more complex infection challenge models. Compounds were simultaneously administered with TcdB directly into the colons of mice. While mice that received vehicle plus toxin showed severe signs of damage including edema, inflammation, and epithelial injury, the compounds 2, 8, and 15 conferred some level of protection against these phenotypes. Compounds 2 and 8 demonstrated significant benefit as shown by reduced injury scores. While compounds 8 and 15 are DHPs, all compounds are CCBs. This opens up the possibility of exploring CCBs as a general class for protection against TcdB-induced tissue necrosis and the most severe sequelae of CDI.
MATERIALS AND METHODS
Expression and Purification of Toxin.
The pBL377 and pBL765 constructs for full-length, recombinant TcdB wild-type, and DXD holotoxins, respectively, with a C-terminal 8xHis tag were expressed in Bacillus megaterium and purified as described previously.15
Cell Culture and Viability Assays.
Hela cells were obtained from ATCC and were cultured in Dulbecco’s Modified Eagle’s Medium (11965092, ThermoFisher Scientific) with 10% v/v heat-inactivated fetal bovine serum (FBS, S11150, Atlanta Biologicals). CHO cells were obtained from ATCC and cultured in Ham’s F-12K (Kaighn’s) (21127022, ThermoFisher Scientific) with 10% v/v heat-inactivated FBS. Cells were maintained at 37 °C with 5% CO2 atmosphere. Compounds 1−15 were purchased from Molport, solubilized in anhydrous dimethylformamide (DMF) to 100 mM, and diluted using a 1:10 titration in a stepwise solubilization scheme of 75/25, 50/50, and 25/75 (%DMF/diluent). Bisindolylmaleimide II (Bis II) from Tocris (Cat. No. 4128) was solubilized in DMSO and added to cells at a final concentration of 10 μM. Ethylene glycol-bis(β-aminoethyl ether)-N,N,N′,N′-tetraacetic acid (EGTA) was solubilized in water adjusted to an initial pH of 11.0 with NaOH and then brought to a final pH of 8.0 with HCl. Compounds were added 1 h prior to intoxication with 10 nM TcdB. Viability was assessed using CellTiter-Glo Luminescent Cell Viability Assay (G7573, Promega), which was diluted 6-fold in tissue culture grade PBS, and then used according to manufacturer’s protocol. Each condition was measured in triplicate and averaged. Relative viability was calculated by normalizing to a vehicle treated control.
HTS Screen.
The Vanderbilt High-Throughput Screening facility plated 16,000 compounds at a final concentration of 10 μM in DMF. CHO cells were added at 3,000 cells/well for 1 h prior to intoxication with 30 nM TcdB. Viability was assessed 6 h postintoxication. Hits were defined as >3 standard deviations (SDs) above the mean of the plate.
Amplex Red Assay.
Compounds were plated at 10 μM in DMF in 96-well plates. Reactions were initiated by adding citrate buffer (20 mM sodium citrate pH 6, 50 mM sodium chloride), 0.1 U/mL horseradish peroxidase solubilized in citrate buffer (P8250, Millipore Sigma), and 50 μM Amplex Red solubilized in DMSO (A12222, ThermoFisher Scientific) in a 100 μL volume reaction. Control wells received 10 U/mL catalase (C9322, Millipore Sigma). Fluorescence readings were taken with a 528 nm excitation/590 nm emission filter set using a Biotek Synergy 4 plate reader.
PKC ELISA.
Active PKC was measured using the PKC Kinase Activity Assay Kit from Abcam (ab139437). Cells were plated in a 10 cm dish and intoxicated with 10 nM TcdB for 60, 45, 30, 15, and 0 min prior to being washed with PBS three times and lysed in RIPA buffer (10 mM Tris pH 8, 1 mM EDTA, 1% Triton X 100, 0.1% sodium deoxycholate, 0.1% sodium dodecyl sulfate, 140 mM sodium chloride). Lysates were processed according to manufacturer’s instructions.
Calcium and ROS Assays.
For calcium and ROS assays, cells were washed three times with Hanks Balanced Salt Solution containing calcium and magnesium, no phenol red (21–023-CV, Corning). Hela cells were seeded in 384-well plates at 10,000 cells per well for viability and calcium assays or at 100,000 cells per well in 96-well plates for ROS assays. Calcium was measured by reconstituting FluoForte (ENZ-52015, Enzo Life Sciences) in DMF and adding to a final concentration of 5 μM simultaneous with toxin addition. Fluorescence readings were taken at 5 min intervals at 488 nm excitation/528 nm emission using a Biotek Synergy 4 plate reader. Intracellular ROS production was assayed with carboxy-2′,7′-dichlorodihydrofluorescein diacetate (C400, Life Technologies). Reagent was reconstituted in DMF, and 10 μM was added to cells 1 h prior to intoxication. Fluorescent readings were taken as for calcium except at 10 min intervals.
Mouse Rectal Installation.
All mouse experiments were approved by Vanderbilt Institutional Animal Care and Use Committee (IACUC). 5−8 week old female C57BL/6 mice were purchased from Jackson Laboratories and were housed five to a cage with free access to food and water. After a 4 day acclimation period, regular water was switched to cefoperazone (0.5 mg mL−1) treated water for 5 days with changes every 48 h. Given that antibiotic treatment disrupts the gut microbiota, and this is known to be a critical step in C. difficile infection, we chose to include this step to create as physiologically relevant an environment as possible in the toxin instillation model.
After 5 days, cefoperazone treated water was switched back to regular water, and a 48 h recovery period was allowed before being intoxicated with a 200 μL volume of (1) 2.5% DMF/PBS control, (2) TcdB (50 μg) in 2.5% DMF/PBS, (3) compound 2 (10 μM) + TcdB (50 μg) in 2.5% DMF/PBS, (4) compound 8 (10 μM) + TcdB (50 μg) in 2.5% DMF/PBS, or (5) compound 15 (10 μM) + TcdB (50 μg) in 2.5% DMF/PBS.
For the intoxication procedure, mice were anesthetized with isoflurane. A 21 gauge flexible gavage was inserted approximately 2 cm in, and each condition was slowly administered. Thirty seconds of rectal pressure was applied to prevent immediate leakage, and mice were placed in a clean cage to recover. After 4 h, the mice were euthanized by CO2 gas, the abdomens were opened up, and colons were extracted. Each colon was flushed with PBS, Swiss-rolled, and fixed in 10% formalin. After embedding in paraffin, the colonic tissue was sliced, mounted to a microscope slide, and stained with H&E by the Translational Pathology Shared Resource (TPSR) center at Vanderbilt University Medical Center. The tissue was then scored for edema, inflammation, and epithelial injury as previously described25 by a pathologist blinded to the experimental conditions.
Supplementary Material
ACKNOWLEDGMENTS
We gratefully acknowledge help from past and current members of the Vanderbilt High-Throughput Screening facility, including P. Vinson.
Funding
This project was initiated with pilot project funds from the Vanderbilt Institute for Chemical Biology and later supported by United States Department of Veterans Affairs Award BX002943 and Public Health Service grant AI095755 from the National Institutes of Health. N.M.C. was funded in part by the Vanderbilt Chemical-Biology Interface training program #5T32GM065086.
Footnotes
Complete contact information is available at: https://pubs.acs.org/10.1021/acschembio.9b00906
Supporting Information
The Supporting Information is available free of charge at https://pubs.acs.org/doi/10.1021/acschembio.9b00906.
Supplemental Figure 1, calcium release in response to wild-type and enzymatically inactive (DXD) toxin and hela cells viability; Supplemental Table 1, panel of 176 compounds (PDF)
The authors declare no competing financial interest.
Contributor Information
Benjamin W. Spiller, Department of Pathology, Microbiology, and Immunology, Vanderbilt University School of Medicine, Nashville, Tennessee 37232-2363, United States;
D. Borden Lacy, Department of Pathology, Microbiology, and Immunology, Vanderbilt University School of Medicine, Nashville, Tennessee 37232-2363, United States; The Veterans Affairs Tennessee Valley Healthcare System, Nashville, Tennessee 37212, United States;.
REFERENCES
- (1).Lessa FC, Mu Y, Bamberg WM, Beldavs ZG, Dumyati GK, Dunn JR, Farley MM, Holzbauer SM, Meek JI, Phipps EC, Wilson LE, Winston LG, Cohen JA, Limbago BM, Fridkin SK, Gerding DN, and McDonald LC (2015) Burden of Clostridium difficile Infection in the United States. N. Engl. J. Med 372, 825–834. [DOI] [PMC free article] [PubMed] [Google Scholar]
- (2).Smits WK, Lyras D, Lacy DB, Wilcox MH, and Kuijper EJ (2016) Clostridium difficile infection. Nat. Rev. Dis Prim 2, 16020. [DOI] [PMC free article] [PubMed] [Google Scholar]
- (3).Chandrasekaran R, and Lacy DB (2017) The role of toxins in clostridium difficile infection. FEMS Microbiol Rev. 41, 723–750. [DOI] [PMC free article] [PubMed] [Google Scholar]
- (4).Lyerly DM, Saum KE, MacDonald DK, and Wilkins TD (1985) Effects of Clostridium difficile toxins given intragastrically to animals. Infect. Immun 47, 349–352. [DOI] [PMC free article] [PubMed] [Google Scholar]
- (5).Triadafilopoulos G, Pothoulakis C, O’Brien MJ, and LaMont JT (1987) Differential effects of Clostridium difficile toxins A and B on rabbit ileum. Gastroenterology 93, 273–279. [DOI] [PubMed] [Google Scholar]
- (6).Sambol SP, Merrigan MM, Lyerly D, Gerding DN, and Johnson S (2000) Toxin gene analysis of a variant strain of Clostridium difficile that causes human clinical disease. Infect. Immun 68, 5480–5487. [DOI] [PMC free article] [PubMed] [Google Scholar]
- (7).Rupnik M, Kato N, Grabnar M, and Kato H (2003) New types of toxin A-negative, toxin B-positive strains among Clostridium difficile isolates from Asia. J. Clin Microbiol 41, 1118–1125. [DOI] [PMC free article] [PubMed] [Google Scholar]
- (8).Lyras D, O’Connor JR, Howarth PM, Sambol SP, Carter GP, Phumoonna T, Poon R, Adams V, Vedantam G, Johnson S, Gerding DN, and Rood JI (2009) Toxin B is essential for virulence of Clostridium difficile. Nature 458, 1176–1179. [DOI] [PMC free article] [PubMed] [Google Scholar]
- (9).Carter GP, Chakravorty A, Nguyen TAP, Mileto S, Schreiber F, Li L, Howarth P, Clare S, Cunningham B, Sambol SP, Cheknis A, Figueroa I, Johnson S, Gerding D, Rood JI, Dougan G, Lawley TD, and Lyras D (2015) Defining the roles of TcdA and TcdB in localized gastrointestinal disease, systemic organ damage, and the host response during Clostridium difficile infections. mBio 6, e00551. [DOI] [PMC free article] [PubMed] [Google Scholar]
- (10).Kuehne SA, Cartman ST, Heap JT, Kelly ML, Cockayne A, and Minton NP (2010) The role of toxin A and toxin B in Clostridium difficile infection. Nature 467, 711–713. [DOI] [PubMed] [Google Scholar]
- (11).Steele J, Mukherjee J, Parry N, and Tzipori S (2013) Antibody against TcdB, but not TcdA, prevents development of gastrointestinal and systemic Clostridium difficile disease. J. Infect. Dis 207, 323–330. [DOI] [PMC free article] [PubMed] [Google Scholar]
- (12).Wilcox MH, Gerding DN, Poxton IR, Kelly C, Nathan R, Birch T, Cornely OA, Rahav G, Bouza E, Lee C, Jenkin G, Jensen W, Kim Y-S, Yoshida J, Gabryelski L, Pedley A, Eves K, Tipping R, Guris D, Kartsonis N, Dorr MB, and MODIFY I and MODIFY II Investigators (2017) Bezlotoxumab for Prevention of Recurrent Clostridium difficile Infection. 376, 305− 317. [DOI] [PubMed] [Google Scholar]
- (13).Voth DE, and Ballard JD (2005) Clostridium difficile toxins: mechanism of action and role in disease. Clin Microbiol Rev. 18, 247–263. [DOI] [PMC free article] [PubMed] [Google Scholar]
- (14).Pruitt RN, and Lacy DB (2012) Toward a structural understanding of Clostridium difficile toxins A and B. Front. Cell. Infect. Microbiol 2, 28. [DOI] [PMC free article] [PubMed] [Google Scholar]
- (15).Chumbler NM, Farrow MA, Lapierre LA, Franklin JL, Haslam D, Goldenring JR, and Lacy DB (2012) Clostridium difficile Toxin B Causes Epithelial Cell Necrosis through an Autoprocessing-Independent Mechanism. PLoS Pathog. 8, No. e1003072. [DOI] [PMC free article] [PubMed] [Google Scholar]
- (16).Wohlan K, Goy S, Olling A, Srivaratharajan S, Tatge H, Genth H, and Gerhard R (2014) Pyknotic cell death induced by Clostridium difficile TcdB: chromatin condensation and nuclear blister are induced independently of the glucosyltransferase activity. Cell. Microbiol 16, 1678–1692. [DOI] [PubMed] [Google Scholar]
- (17).Farrow MA, Chumbler NM, Lapierre LA, Franklin JL, Rutherford SA, Goldenring JR, and Lacy DB (2013) Clostridium difficile toxin B-induced necrosis is mediated by the host epithelial cell NADPH oxidase complex. Proc. Natl. Acad. Sci. U. S. A 110, 18674–18679. [DOI] [PMC free article] [PubMed] [Google Scholar]
- (18).Chumbler NM, Farrow MA, Lapierre LA, Franklin JL, and Lacy DB (2016) Clostridium difficile Toxins TcdA and TcdB Cause Colonic Tissue Damage by Distinct Mechanisms. Infect. Immun 84, 2871–7. [DOI] [PMC free article] [PubMed] [Google Scholar]
- (19).Kelly CP, Pothoulakis C, and LaMont JT (1994) Clostridium difficile Colitis. N. Engl. J. Med 330, 257–262. [DOI] [PubMed] [Google Scholar]
- (20).Ryder AB, Huang Y, Li H, Zheng M, Wang X, Stratton CW, Xu X, and Tang YW (2010) Assessment of Clostridium difficile infections by quantitative detection of tcdB toxin by use of a real-time cell analysis system. J. Clin Microbiol 48, 4129–4134. [DOI] [PMC free article] [PubMed] [Google Scholar]
- (21).Cohen NA, Miller T, Na’aminh W, Hod K, Adler A, Cohen D, Guzner-Gur H, Santo E, Halpern Z, Carmeli Y, and Maharshak N (2018) Clostridium difficile fecal toxin level is associated with disease severity and prognosis. United Eur. Gastro-enterol. J 6, 773–780. [DOI] [PMC free article] [PubMed] [Google Scholar]
- (22).Braunwald E (1982) Mechanism of Action of Calcium-Channel-Blocking Agents. N. Engl. J. Med 307, 1618–1627. [DOI] [PubMed] [Google Scholar]
- (23).Inoguchi T, Sonta T, Tsubouchi H, Etoh T, Kakimoto M, Sonoda N, Sato N, Sekiguchi N, Kobayashi K, Sumimoto H, Utsumi H, and Nawata H (2003) Protein kinase C-dependent increase in reactive oxygen species (ROS) production in vascular tissues of diabetes: Role of vascular NAD(P)H oxidase. J. Am. Soc. Nephrol 14, S227–S232. [DOI] [PubMed] [Google Scholar]
- (24).Godfraind T (2017) Discovery and development of calcium channel blockers. Front. Pharmacol 8, 286. [DOI] [PMC free article] [PubMed] [Google Scholar]
- (25).Theriot CM, Koumpouras CC, Carlson PE, Bergin II, Aronoff DM, and Young VB (2011) Cefoperazone-treated mice as an experimental platform to assess differential virulence of Clostridium difficile strains. Gut Microbes 2, 326–334. [DOI] [PMC free article] [PubMed] [Google Scholar]
- (26).Wang X-T, Nagaba Y, Cross HS, Wrba F, Zhang L, and Guggino SE (2000) The mRNA of L-Type Calcium Channel Elevated in Colon Cancer: Protein Distribution in Normal and Cancerous Colon. Am. J. Pathol 157, 1549–1562. [DOI] [PMC free article] [PubMed] [Google Scholar]
- (27).Gilbert RJ, Pothoulakis C, LaMont JT, and Yakubovich M (1995) Clostridium difficile toxin B activates calcium influx required for actin disassembly during cytotoxicity. Am. J. Physiol 268, G487–95. [DOI] [PubMed] [Google Scholar]
Associated Data
This section collects any data citations, data availability statements, or supplementary materials included in this article.