

Abstract
Reciprocally connected GABAergic external globus pallidus (GPe) and glutamatergic subthalamic nucleus (STN) neurons form a key, centrally-positioned network within the basal ganglia. In Parkinson’s disease (PD) and its models, abnormal rates and patterns of GPe-STN network activity are linked to motor dysfunction. Following the loss of dopamine, the activities of GPe and STN neurons become more temporally offset and strongly correlated with cortical oscillations below 40 Hz. Previous studies utilized cortical slow-wave activity and/or cortical activation (ACT) under anesthesia to probe the mechanisms underlying the normal and pathological patterning of basal ganglia activity. Here, we combined this approach with in vivo optogenetic inhibition to identify and interrupt the activity of D2 dopamine receptor-expressing striatal projection neurons (D2-SPNs), parvalbumin-expressing prototypic GPe (PV GPe) neurons, and STN neurons. We found that in dopamine-depleted mice 1) the firing rate of D2-SPNs was elevated, especially during cortical ACT 2) abnormal phasic suppression of PV GPe neuron activity was ameliorated by optogenetic inhibition of coincident D2-SPN activity 3) autonomous PV GPe neuron firing ex vivo was upregulated, presumably through homeostatic mechanisms 4) STN neurons were not hyperactive, despite being disinhibited 5) optogenetic inhibition of the STN exacerbated abnormal GPe activity 6) exaggerated beta band activity was not present in the cortex or GPe-STN network. Together with recent studies, these data suggest that in dopamine-depleted mice, abnormally correlated and temporally offset PV GPe and STN neuron activity is generated in part by elevated striatopallidal transmission, while compensatory plasticity prevents STN hyperactivity and limits cortical entrainment.
Introduction
Reciprocally connected GABAergic external globus pallidus (GPe) and glutamatergic subthalamic nucleus (STN) neurons form a key, centrally-positioned network within the basal ganglia, a group of subcortical brain nuclei critical for the execution of motivated, goal-directed, and habitual behaviors (Mink & Thach, 1993; Yin & Knowlton, 2006; Redgrave et al., 2010; Keeler et al., 2014; Nelson & Kreitzer, 2014; Klaus et al., 2019). The GPe and STN are components of the so-called “indirect pathway”, which emanates from D2 dopamine receptor expressing GABAergic striatal projection neurons (D2-SPNs), traverses the GPe and STN, and terminates in the GABAergic basal ganglia output nuclei, the internal globus pallidus (GPi) and substantia nigra pars reticulata (SNr) (Albin et al., 1989; Gerfen et al., 1990). Cortical (or thalamic) activation of D2-SPNs leads through the indirect pathway to increased inhibition of basal ganglia targets, which was traditionally thought to suppress movement (Albin et al., 1989; Maurice et al., 1999; Frank et al., 2004; Tachibana et al., 2008; Kravitz et al., 2010). Indeed, sustained optogenetic activation of D2-SPNs rapidly arrests motion (Kravitz et al., 2010). However, recent studies argue that indirect pathway activity is required for the generation of action sequences, possibly through the suppression of competing actions and termination of selected actions. Thus, D2-SPNs are recruited during natural and trained behaviors, and inhibiting them impairs the performance of action sequences (Cui et al., 2013; Sippy et al., 2015; Barbera et al., 2016; Carvalho Poyraz et al., 2016; Lambot et al., 2016; Lemos et al., 2016; Tecuapetla et al., 2016; LeBlanc et al., 2018; Markowitz et al., 2018). The STN is also a component of the so-called hyperdirect pathway, which rapidly relays cortical excitation to the basal ganglia output nuclei (and GPe) (Nambu et al., 1996; Maurice et al., 1999; Nambu et al., 2002; Degos et al., 2008; Tachibana et al., 2008; Kita & Kita, 2012). This pathway is also critical for motor control, possibly through the rapid constraint of competing actions and/or stalling of actions during decision making (Mink & Thach, 1993; Baunez et al., 1995; Nambu et al., 2002; Aron & Poldrack, 2006; Isoda & Hikosaka, 2008; Engel & Fries, 2010; Schmidt et al., 2013; Jahanshahi et al., 2015; Zavala et al., 2015).
In Parkinson’s disease (PD), abnormal GPe-STN network activity is linked to the expression of motor symptoms, specifically akinesia, bradykinesia, and rigidity (Albin et al., 1989; Hammond et al., 2007; Quiroga-Varela et al., 2013; McGregor & Nelson, 2019). The classic view is that loss of midbrain dopamine neurons leads to elevation of D2-SPN activity, which leads to increased inhibition of GPe neurons, disinhibition of STN neurons, and increased basal ganglia output, which suppresses movement (Albin et al., 1989; Mink & Thach, 1993; Kravitz et al., 2010). However, firing rate changes in the parkinsonian basal ganglia are often moderate in nature or absent, and in some cases opposite to those predicted by the classic model (Bergman et al., 1994; Wichmann et al., 1999; Ni et al., 2001; Goldberg et al., 2002; Leblois et al., 2006; Ryu et al., 2011; Nelson & Kreitzer, 2014; McGregor & Nelson, 2019; Willard et al., 2019b). The reasons for these inconsistencies are unclear but could relate to species and technical differences in PD models, variation in recording and cell identification approaches, the influence of brain state and behavior on network dynamics, and homeostatic compensatory cellular and synaptic plasticity. The therapeutic efficacy of high-frequency stimulation of the STN or GPi for the treatment of parkinsonism further challenges the rate foundation of the classic model (Chiken & Nambu, 2016; Wichmann & DeLong, 2016; McGregor & Nelson, 2019).
In idiopathic and experimental PD, the GPe and STN exhibit an increase in correlated, phasic activity (Magill et al., 2001; Walters et al., 2007; Mallet et al., 2008a). Thus, synchronous pauses in discharge and burst firing are relatively prevalent (Quiroga-Varela et al., 2013; Sanders et al., 2013). In addition, these activity patterns can recur irregularly or rhythmically at frequencies between 1–35 Hz depending on the mode of dopamine depletion, species, behavior, and/or brain state (Magill et al., 2001; Mallet et al., 2008b; Kuhn et al., 2009; Devergnas et al., 2014; Delaville et al., 2015; Sharott et al., 2017). Excessively correlated firing is thought to impair the network’s capacity to encode information (Hammond et al., 2007; Mallet et al., 2008b). Indeed, neuronal activity exhibits a marked reduction in somatotopic specificity in parkinsonism (Bergman et al., 1994; Cho et al., 2002; Pessiglione et al., 2005; Leblois et al., 2006; Mallet et al., 2008b; Nambu, 2011; Ketzef et al., 2017). The activity of the reciprocally connected GPe and STN can also become temporally offset, which given the convergence of these nuclei onto the GPi and SNr, may pathologically synchronize basal ganglia output (Bevan et al., 1994; Shink et al., 1996; Walters et al., 2007; Moran et al., 2011; Tachibana et al., 2011; Shouno et al., 2017). The consistently therapeutic effect of manipulations that decorrelate network activity, e.g. STN deep brain stimulation or dopamine-based medications (Brown et al., 2001; Heimer et al., 2002; Sharott et al., 2005; Eusebio et al., 2012; Whitmer et al., 2012), further support the linkage between excessively correlated GPe-STN network activity and motor dysfunction in PD. However, the origins of parkinsonian GPe-STN network activity remain poorly understood. Hyperactivity (Mallet et al., 2006; Kita & Kita, 2011b; Moran et al., 2011; Escande et al., 2016; Sharott et al., 2017) and (mal)adaptive plasticity of D2-SPNs (Day et al., 2006; Taverna et al., 2008; Gittis et al., 2011; Fieblinger et al., 2014), loss of autonomous GPe and STN activity (Zhu et al., 2002; Wilson et al., 2006; Chan et al., 2011; Hernandez et al., 2015; Shouno et al., 2017; McIver et al., 2019), increases in the strength of GPe-STN inputs (Moran et al., 2011; Fan et al., 2012; Chu et al., 2015), and/or downregulation of hyperdirect cortico-STN inputs (Mathai et al., 2015; Chu et al., 2017; Wang et al., 2018) have each been hypothesized to play important roles. GPe and STN neurons are also considerably more complex than once thought, e.g. although the majority of GPe neurons do project to the STN, “prototypic” GPe neurons also project to basal ganglia output neurons, midbrain dopamine neurons, and to the striatum where they preferentially target GABAergic interneurons (Bevan et al., 1998; Mastro et al., 2014; Saunders et al., 2016). In addition, “novel” classes of GPe neuron have been identified recently (Hernandez et al., 2015; Abecassis et al., 2020), among them arkypallidal neurons which as a group comprise one quarter of all GPe neurons and project only to the striatum (Mallet et al., 2012; Abdi et al., 2015; Dodson et al., 2015).
Previous studies in rats utilized cortical slow-wave activity (SWA) and/or sensory stimulation-evoked cortical activation (ACT) under urethane anesthesia to probe the impact of stereotyped patterns of cortical activity on the dopamine-intact and -depleted basal ganglia (Magill et al., 2001; Walters et al., 2007; Mallet et al., 2008a; Mallet et al., 2008b; Zold et al., 2012; Sharott et al., 2017). Cortical SWA and ACT under anesthesia, are analogous to cortical activities associated with natural sleep and arousal, respectively (Steriade, 2000). Cortical SWA is characterized by rhythmic (~ 1 Hz) periods of synchronous activity and inactivity of cortical projection neurons, whereas cortical ACT is characterized by sustained depolarization and desynchronization of cortical projection neurons following sensory-evoked stimulation of the reticular activating system (Steriade, 2000). Here, we combined the anesthetized preparation with cell-class specific optogenetic interrogation. First, well-established mouse cre-driver lines were used to selectively express the inhibitory opsin Arch-GFP in D2-SPNs, parvalbumin (PV)-expressing prototypic GPe (PV GPe) neurons, or STN neurons. Then, optogenetic inhibition and multi-site silicon probe recording were employed to selectively identify and transiently suppress the contribution of each cell class to normal and abnormal GPe-STN network activity in dopamine-intact and -depleted mice, respectively. Finally, to determine whether loss of autonomous firing (Chan et al., 2011) could contribute to alterations in prototypic GPe neuron activity in vivo, the firing of genetically identified PV-GPe neurons was compared in ex vivo brain slices from control and dopamine-depleted mice using non-invasive, cell-attached patch clamp recording.
Materials and Methods
Ethical approval
The present study conforms to the principles and regulations of The Journal of Physiology. Experiments involving mice were carried out in compliance with the Northwestern University and University of Bordeaux Institutional Animal Care and Use Committees (IACUC protocols; Northwestern: IS00001278 and IS00003431; Bordeaux: A5012075) and NIH and European Economic Community guidelines.
Animals
Descriptive data are presented as median and interquartile range (IQR). Adult male mice including A2A-cre (Tg(Adora2a-cre)KG139Gsat, RRID:MMRRC_031168-UCD; 163, 104–196 days old; n = 18), PV-cre (B6.Cg-Pvalbtm1.1(cre)Aibs/J, RRID:IMSR_JAX:012358; 151, 126–167 days old; n = 14), PV-cre X Ai9 mice (B6.129P2-Pvalbtm1(cre)Arbr/J X B6.Cg-Gt(ROSA)26Sortm9(CAG-tdTomato)Hze/J, RRID:IMSR_JAX:017320 X RRID:IMSR_JAX:007909; 69.5, 67–71 days old; n = 14), and GABRR3-cre (Tg(Gabrr3-cre)KC112Gsat, RRID:MMRRC_030709-UCD; 169, 68–293 days old; n = 7) mice were used. Mice were bred in-house and housed under a 14h/10h (in vivo experiments) or 12h/12h (ex vivo experiments) light/dark cycle, with food and water ad libitum. Mice received regular veterinary inspection, and underwent only those procedures detailed here and tail-clipping for the purpose of genotyping. Experiments were performed during the light cycle.
Unilateral 6-hydroxdopamine (6-OHDA)/vehicle and adeno-associated virus (AAV) vector injection
6-OHDA/vehicle and AAVs were injected using a stereotaxic instrument (Neurostar, Tubingen, Germany; David Kopf Instruments, Tujunga, CA, USA). Anesthesia was induced with vaporized 3–4 % isoflurane (Smiths Medical ASD, Inc., Dublin, OH, USA; Tem-Sega, Inc., Pessac, France) before injection of ketamine/xylazine (75/10 or 87/13 mg/kg, respectively, IP). Within 2–5 minutes, desipramine (25 mg/kg, IP) and pargyline (50 mg/kg, IP) were injected to enhance the selectivity and toxicity of intracerebral 6-OHDA injections, respectively. After placing the mouse in the stereotaxic instrument, anesthesia was maintained with 1–2 % isoflurane. 1–2 μl of 6-OHDA (3–5 mg/ml) in HEPES buffered saline (HBS; in mM: 140 NaCl, 23 glucose, 15 HEPES, 3 KCl, 1.5 MgCl2, 1.6 CaCl2; pH 7.2 with NaOH; 300–310 mOsm/L) plus 0.02 % ascorbate or vehicle (HBS plus 0.02 % ascorbate) was then injected into the MFB (from Bregma: AP, −0.7 mm; ML, 1.2 mm; DV, 4.7 mm) over a 10 minute period. The injectate was then allowed to diffuse for a further 10 minutes prior to retraction of the syringe. For D2-SPN, GPe, or STN neuron identification/silencing experiments in which A2A-cre, PV-cre, or GABRR3-cre transgenic mice were used, AAV expressing AAV9.CBA.Flex.Arch-GFP.WPRE.SV40 (Addgene viral prep #22222-AAV9, RRID: Addgene_22222; Chow et al., 2010) was injected into each target structure (striatum: 4 × 300 nl; AP, 0.4 mm and 0.9 mm; ML, 2.2 mm; DV, 3.7 mm and 2.7 mm; GPe: 2 × 300 nl; AP, −0.27 mm; ML, 2 mm; DV, 3.95 mm and 3.45 mm; STN: 500 nl; AP, −2.0 mm; ML, 1.6 mm; DV, 4.65 mm). Each AAV injection took place over 5 minutes, followed by a further 5 minute period prior to syringe retraction.
In vivo electrophysiological recording
Two-Three weeks (18.5, 15–21 days) following surgery, mice were briefly anesthetized with 3–4 % isoflurane in order to inject urethane (1.25 g/kg, IP). Mice were then allowed to rest in their homecage for 1 hour and then injected with ketamine/xylazine (16/0.8 mg/kg, respectively, IP) every 10–20 minutes until the toe-pinch withdrawal reflex was abolished. Mice were then placed into a stereotaxic instrument (David Kopf Instruments) for the duration of the recording session and ketamine/xylazine supplements were administered as needed to maintain anesthesia. Craniotomies were drilled over the ipsilateral motor cortex (AP, 1.4 mm; ML, 1.5 mm) and two recording sites among the striatum (AP, 0.5 mm; ML, 2.5 mm), GPe (AP, −0.3 mm; ML, 2.0 mm), and STN (AP, −1.7 mm; ML, 1.6 mm) depending on the experiment. A peridural screw “electrode” (MS-51960–1; McMaster-Carr, Chicago, IL, USA) was implanted over primary motor cortex from which the intracranial electroencephalogram (EEG) was recorded. Extracellular single unit recordings and local field potentials (LFPs) were acquired using silicon tetrode arrays (A1×4-tet-10mm-100–121-A16; NeuroNexus Technologies, Ann Arbor, MI, USA) connected to a 64-channel Digital Lynx (Neuralynx, Bozeman, MT, USA) data acquisition system with a unity gain headstage, at a sampling frequency of 40 kHz, a gain of 14 X, with reference wire implanted opposed to the ipsilateral temporal musculature. Online digital finite impulse response filters were applied. Single unit activity was band pass filtered between 200–9000 Hz and LFP and EEG signals were band pass filtered between 0.1–400 Hz. Optogenetic stimulation was delivered using a custom 577 nm laser system (Genesis MX STM 577–500 OPSL CW; Coherent Inc., Santa Clara, CA, USA) that was fiber coupled to an optrode with an identical array of tetrodes (A1×4-tet-10mm-100–121-OA16; NeuroNexus Technologies). Silicon probes were dipped in a lipophilic florescent dye (DiI; 20 mg/ml in 50 % acetone/methanol; D282; ThermoFisher Scientific, Waltham, MA, USA) prior to initial penetration to identify sites of recording in histological sections.
Unit activity, LFP, and EEG were simultaneously recorded for several minutes during cortical SWA. This was followed by at least two periods of optogenetic stimulation of Arch-GFP (< 6 mW) for 5 seconds, with each stimulation period being separated by at least three minutes. Laser power was measured at the optrode tip prior to probe implantation and verified at the conclusion of each experiment. Cortical ACT was evoked by tail pinch using a custom pneumatic device. After cortical SWA had stabilized following ACT, another tail pinch was applied. This sequence was repeated until at least three trials had been recorded or units were lost.
Histological processing of in vivo tissue
Following recording, mice were given a lethal dose of anesthetic and transcardially perfused with saline for 2 minutes followed by 4 % w/v paraformaldehyde in 0.1 M PB, pH 7.4 for approximately 20 minutes. The brain was then removed, held in the same fixative overnight, and then washed in 0.01 M phosphate-buffered saline, pH 7.4 (PBS; P3813; Millipore Sigma, Darmstadt, Germany) before being sectioned in the coronal plane at 70 μm using a vibratome (VT1000S; Leica Microsystems Inc., Richmond, Illinois, USA). Sections were then washed 3 times in PBS before incubation for 48–72 hr at 4 °C in a mixture of PBS, 0.5 % Triton X-100 (T8787; Millipore Sigma), and 2 % normal donkey serum (017-000-121; Jackson ImmunoResearch, West Grove, PA, USA; PBS-T) containing primary antibodies (see below). Sections were then washed in PBS before incubation for 90 minutes at room temperature (RT) in PBS-T containing secondary antibodies (see below). Lastly, sections were washed in PBS and mounted on slides with Prolong Gold Antifade Reagent (P36930; ThermoFisher Scientific, Waltham, MA, USA). Mountant was allowed to cure for at least 24 hours prior to storage at 4 °C or imaging. GFP, DiI, and immunofluorescent labelling were imaged using a Zeiss Axioskop 2 microscope (Zeiss, Oberkochen, Germany), an AxioCam CCD camera (426508-9901-000; Zeiss), and Neurolucida software (MFB Bioscience, Williston, VT, USA). Representative images were acquired using confocal laser scanning microscopy (A1R; Nikon, Melville, USA).
A 1:6 series of the striatum and SN was processed for the immunohistochemical detection of tyrosine hydroxylase (TH; 1:500 mouse anti-TH; MAB318, RRID:AB_2201528, Millipore Sigma, Charalampopoulos et al., 2005; Peng et al., 2005; 1:250 Alexa Fluor 488 donkey anti-mouse IgG; 715-545-152, RRID: AB_2313584, Jackson Immunoresearch) and expression was quantified, as described previously (Fan et al., 2012). Immunoreactivity was averaged across three evenly spaced rostral, middle, and caudal sections. Cortical immunoreactivity was then subtracted from striatal immunoreactivity to normalize for background fluorescence. Dopamine depletion was assessed from the immunoreactivity in the vehicle or 6-OHDA-injected hemisphere, expressed as a percentage of immunoreactivity in the contralateral hemisphere (Table 1). For PV-cre mice, in which PV GPe neurons expressed Arch-GFP, adjacent sections of the GPe were processed for the immunohistochemical detection of PV (1:200 rabbit anti-PV; 195 002, RRID:AB_2156474, Basco et al., 2011; or 1:200 guinea pig anti-PV; 195 004, RRID:AB_2156476, Kotzadimitriou et al., 2018; 1:250 Alexa Fluor 594 donkey anti-rabbit IgG; 711-585-152, RRID:AB_2340621; or 1:250 Alexa Fluor 594 donkey anti-guinea pig IgG; 706-585-148, RRID:AB_2340474; Jackson Immunoresearch) or FoxP2 (1:500 rabbit anti-FoxP2; MFCD06411813, RRID:AB_1078909, Millipore Sigma, Hernandez et al., 2015; 1:250 Alexa Fluor 594 donkey anti-rabbit IgG; 711-585-152, RRID:AB_2340621, Jackson Immunoresearch). Sections of the STN from PV-cre and GABRR3-cre mice, the GPe from GABRR3-cre and A2A-cre mice, and the striatum from A2A-cre mice were processed for the immunohistochemical detection of the neuronal markers NeuN (1:200 mouse anti-NeuN; MAB377, RRID:AB_2298772, Millipore Sigma, Aranha et al., 2010; or 1:1,000 rabbit anti-NeuN; AB177487, RRID:AB_2532109, Abcam, Xu et al., 2018; 1:250 Alexa Fluor 594 donkey anti-mouse IgG; 715-585-150; or 1:250 Alexa Fluor 594 donkey anti-rabbit IgG; 711-585-152, Jackson Immunoresearch) or HuC/D (1:66 mouse anti-HuC/D; A-21271, RRID:AB_221448, ThermoFisher Scientific, Nogueira et al., 2017; 1:250 Alexa Fluor 594 donkey anti-mouse; 715-585-150, Jackson Immunoresearch) to aid reconstruction of electrode tracks and sites of recording.
Table 1.
TH immunoreactivity in the striatum of vehicle- and 6-OHDA-injected mice
| Mouse Line/Cell Type | vehicle: TH immunoreactivity (%) | 6-OHDA: TH immunoreactivity (%) | p - value |
|---|---|---|---|
| A2A-cre/D2-SPNs | 101, 98–105; n = 6 | 4, 11–4; n = 9 | p = 0.0004* |
| A2A-cre/GPe | ————————— | 4, 11–5; n = 8 | ————— |
| PV-cre/PV GPe | 103, 96–105; n = 7 | 1, −11–3; n = 6 | p = 0.0012* |
| PV-cre/STN | 103, 96–106; n = 6 | 0, −16–1; n = 5 | p = 0.0043* |
| PV-cre X Ai9/PV GPe | 99, 99–131; n = 3 | 15, 29–6; n = 7 | p = 0.0167* |
| GABRR3-cre/GPe | 102, 96–104; n = 3 | −3, −34-−2; n = 4 | p = 0.0571 |
TH immunoreactivity in the ipsilateral dorsal striatum expressed as a percentage of immunoreactivity in the non-injected contralateral hemisphere, stratified by mouse line and recorded cell type.
p < 0.05 (MWU).
Stereological counts of Arch-GFP-, PV-, and FoxP2-expressing GPe cells were determined using the optical dissector method (West et al., 1991) on a 1:4 series of sections. Structures were traced with a 10 × objective (420943-9900-000; Zeiss, Oberkochen, Germany) and imaged using a 40 × oil- (000000-1022-818; Zeiss, Oberkochen, Germany) or 60 × water-immersion (UplanApo 60X/1.2 NA; Olympus, Tokyo, Japan) objectives. Counting frames of 100 × 100 or 90 × 90 μm, and grid sizes of 300 × 300 or 200 × 200 μm, respectively were used. Images were taken at 1 μm intervals for 5 μm beneath a 1 μm guard zone (Neurolucida system, MFB Bioscience, Williston, VT, USA).
In Vivo Electrophysiological Analysis
Due to the impaired movement of 6-OHDA-dopamine-depleted mice, experimenters were not blinded to the experimental group of the mice that they were recording from. Putative single-unit activity was discriminated with Plexon Offline Sorter software (Version 3; Plexon. Inc., Dallas, TX; RRID:SCR_000012) using a combination of template matching, principal component analysis, and manual clustering. Spike times were aligned to the peak of the extracellularly recorded action potential and a dead time of 500 μs was utilized during discrimination of units (Maccione et al., 2009; Adamos et al., 2010; Lu et al., 2016). Given that action potential widths varied between ~ 1.0 and 1.5 ms and assuming an absolute refractory period of ~ 1.0 ms, the minimum interspike interval (ISI) of a single neuron’s spike train should be ~ 2 ms. A threshold of < 1 % of ISIs < 2 ms was therefore utilized for the designation of putative single units in this study (Mallet et al., 2008a; Mallet et al., 2008b; Sharott et al., 2017). Of the 551 putative single unit spike trains reported here, the percentage of ISIs with durations < 2 ms was 0.0457, 0–0.227 %, suggesting that there was minimal contamination by stray units.
All data were visually inspected in Neuroexplorer 4 (Nex Technologies, Colorado Springs, CO; RRID:SCR_001818) and exported to MATLAB 2017b (MathWorks, Matick, MA; RRID:SCR_001622) for analysis. Epochs with consistent, robust cortical SWA or ACT were selected for analysis. During cortical SWA, 30 second epochs were used to assess baseline neuronal activity. During cortical SWA, the impact of optogenetic inhibition was assessed by comparing neuronal activity 5 seconds prior to Arch-GFP stimulation with neuronal activity during 5 seconds of Arch-GFP stimulation. Neurons that were responsive to Arch-GFP stimulation are reported. In areas that received direct optogenetic stimulation of Arch-GFP, neurons were considered to be responsive if their firing rate was rapidly, consistently, and persistently suppressed by at least 2 SD. Although polysynaptic mechanisms cannot be completely excluded, these effects are consistent with direct optogenetic inhibition as the primary cause of firing rate reduction.
In most cases the activity of downstream/postsynaptic neurons increased when the upstream/presynaptic nucleus was GABAergic (i.e., striatum or GPe) and decreased when the upstream/presynaptic nucleus was glutamatergic (i.e., STN). In a small number of neurons, the opposite response was observed or more subtle changes in firing pattern occurred without a change in firing rate. Therefore, downstream/postsynaptic neurons were deemed to be responsive to optogenetic inhibition of the upstream/presynaptic nucleus if their firing rate or regularity changed by greater than 2 SD during inhibition of the upstream/presynaptic nucleus. Although polysynaptic mechanisms cannot be completely excluded, the typical effects on downstream/postsynaptic activity are consistent with optogenetic inhibition of the presynaptic nucleus as the primary cause.
During cortical ACT, five seconds of neuronal activity prior to and during tail pinch were compared. “Putative PV” GPe neurons were “isolated” from unidentified populations of GPe neurons in A2A-cre and GABRR3-cre mice by restricting analysis of unidentified GPe neurons to those with an in-:antiphase ratio within the interquartile range of optogenetically identified PV GPe neurons in PV-cre mice. Mean firing rates were calculated from the number of spikes divided by epoch length. The coefficient of variation of the interspike interval (CV) was used as a metric of regularity.
To examine the relationship between cortical SWA and neuronal firing, phase histograms were generated in MATLAB: 1) cortical SWA was extracted from the raw EEG signal by applying a bandpass 0.5–1.5 Hz 2nd order Butterworth filter in the forward and reverse directions to avoid phase shifts; 2) the EEG was downsampled to 1 kHz using the MATLAB function ”resample”; 3) the instantaneous phase of the EEG was calculated from the Hilbert transform (Le Van Quyen et al., 2001); 4) the empirical cumulative distribution function (MATLAB) was applied to correct for the non-sinusoidal nature of slow cortical oscillations, (Siapas et al., 2005; Mallet et al., 2008b; Abdi et al., 2015) 5) each spike was assigned to a phase of the EEG from 0–360° (0°/360° and 180° corresponding to the peak-active and -inactive components of the EEG, respectively). Each neuron’s spike probability was calculated from (spikes/bin)/(total # of spikes) × 100. Data were binned at 10° in figures, and at 180° for statistical comparisons. Population phase histograms are plotted as median and interquartile range.
The multitaper Fourier transform function (Bokil et al., 2010; McConnell et al., 2012; Brazhnik et al., 2016) was applied using MATLAB to assess spectral power within the 1 kHz downsampled EEG, GPe and STN LFP (chronux.org; NW = 3, K = 5). 5 s epochs during cortical SWA or ACT were examined to determine total power in the 0.5–1.5 Hz, 10–39.9 Hz, and 40–250 Hz frequency bands respectively. Power within each band of interest was then normalized to the total power from 0–250 Hz to control for variability in signal amplitude between recordings.
Ex vivo electrophysiological recording
Acute brain slices were prepared from PV-cre X Ai9 mice as previously described (Chazalon et al., 2018). Briefly, mice were anesthetized with ketamine/xylazine (100/20 mg/kg, respectively) and perfused transcardially with ice-cold modified artificial cerebrospinal fluid (ACSF), equilibrated with 95% O2 and 5% CO2, and containing (in mM): 230 sucrose, 26 NaHCO3, 2.5 KCl, 1.25 NaH2PO4, 0.5 CaCl2, 10 MgSO4 and 10 glucose. Brains were rapidly removed and sectioned into 300 μm-thick parasagittal slices with a vibrating blade microtome (VT1200S; Leica Microsystems, Germany). Slices containing the GPe were then left to equilibrate for 1 h (at 35°C) in ACSF of the following composition (in mM): 126 NaCl, 26 NaHCO3, 2.5 KCl, 1.25 NaH2PO4, 2 CaCl2, 2 MgSO4, 10 glucose, 1 sodium pyruvate and 4.9 reduced L-glutathione (equilibrated with 95% O2 and 5% CO2). Individual brain slices were placed in a recording chamber where they were perfused at 4–5 ml/min with synthetic interstitial fluid (SIF) at 35 °C containing (in mM): 126 NaCl, 3 KCl, 1.25 NaH2PO4, 1.6 CaCl2, 1.5 MgSO4, 10 glucose and 26 NaHCO3 (equilibrated with 95 % O2 and 5 % CO2). Somatic patch-clamp recordings were obtained under visual guidance (E600FN Eclipse workstation, Nikon, Japan; Nikon Fluor 60 X/1.0 NA) using motorized manipulators (Patchman NP2, Eppendorf, France). PV GPe neurons were identified by visualization of tdTomato under epifluorescence. Autonomous PV GPe neuron activity was recorded in the presence of the GABAA receptor (GABAzine, 20 μM), GABAB receptor (CGP 55845, 1 μM), AMPA/Kainate receptor (DNQX, 20 μM), and NMDA receptor (D-APV, 50 μM) antagonists in the loose-seal configuration of the patch clamp technique in current clamp mode using borosilicate glass pipettes (4–6 MΩ) containing (in mM): 140 NaCl, 23 glucose, 15 HEPES, 3 KCl, 1.5 MgCl2, 1.6 CaCl2. pH and osmolarity were adjusted to 7.2 with 1 M NaOH and to 300–310 mOsm, respectively. Electrophysiological recordings were acquired using a computer running Clampex 9.2 software (Molecular Devices, Palo Alto, CA, USA) connected to a Multiclamp 700B amplifier (Molecular Devices) via a Digidata 1320A digitizer (Molecular Devices). Data were low-pass filtered at 4 kHz and sampled at 20 kHz.
Histological processing for ex vivo experiments
PV-cre X Ai9 mice were euthanized with 20 % urethane and transcardially perfused with PBS, followed by 4 % w/v paraformaldehyde in 0.1 M PB, pH 7.4. The brain was then removed and incubated overnight in the same fixative at 4°C, then immersed in PBS containing 20 % w/v sucrose for 24h at 4°C, and stored in this solution at −80°C before being sectioned in the coronal plane at 50 μm on a cryostat (CM3000; Leica Microsystems Inc.). Sections were then washed in PBS and those containing ‘rostral’, ‘central’, and ‘caudal’ GPe (corresponding approximately to AP −0.2 mm, −0.45 mm, and −0.7 mm from Bregma, respectively (Paxinos & Franklin, 2001) were selected for immunohistochemical detection of GPe markers. Sections were incubated overnight at RT in a mixture of 3 primary antibodies diluted in PBS-T (1:100 goat anti-FoxP2; sc-21069, RRID:AB_2107124, Santa Cruz, Fu et al., 2014; 1:1,000 guinea pig anti-parvalbumin; 195 004, RRID:AB_2156476, Synaptic Systems, Abbas et al., 2018; 1:1,000 rat anti red fluorescent protein 5f8, RRID:AB_2336064, Chromotek). Sections were then washed and incubated for 1 hour at RT in PBS-T containing a mixture of secondary antibodies (1:500 Alexa Fluor 488 donkey anti guinea-pig IgG; A11073, RRID:AB_2534117, Life Technologies; 1:500 Alexa Fluor 647 donkey anti-goat IgG; A21447, RRID:AB_2535864, Life Technologies; 1:500 DyLight 594 donkey anti rat IgG; NBP1–75661, RRID:AB_11055284, Novus). Finally, sections were washed in PBS, mounted in Vectashield (Vector Laboratories), and imaged on a confocal fluorescence microscope (TCS SP8, Leica Microsystems Inc.). Images were acquired using a 20 × 1.0 NA objective lens in 1.0 μm steps between 2 μm and 17 μm from the upper surface of each section. Colocalization was assessed from maximal z-projection images using the cell counter plug-in of ImageJ.
Sections containing the striatum were processed for the immunohistochemical detection of TH. Sections were first incubated in primary antibody (1:10,000 monoclonal anti-TH; MAB318, RRID:AB_2201528, Millipore Bioscience Research Reagents) in PBS-T overnight at RT. Subsequently, the sections were incubated in secondary antibody in PBS-T (1:1000 biotinylated horse anti-mouse IgG; BA-2000, RRID:AB_2313581, Vector Laboratories) for 90 min at RT. Finally, sections were incubated in avidin-biotin peroxidase complex (1:500; PK-4002, RRID:AB_2336811, Vector Laboratories) for 60 min at RT and immunoreactivity was revealed using AMEC (SK-4285, RRID:AB_2336519, Vector Laboratories). Sections were then rinsed, mounted on gelatin-coated slides, and coverslipped in VectaMount (Vector Laboratories). At least three sections from each hemisphere containing the striatum were scanned in an Epson expression 10000XL high-resolution scanner. Mean optical density was measured in the top half of the striatum (Mercator; Explora Nova, La Rochelle, France) and values were corrected for background staining as above. TH immunoreactivity ipsilateral to vehicle or 6-OHDA injection was expressed as a percentage of immunoreactivity in the contralateral hemisphere, as described above (Table 1).
Statistical analysis
Statistics were performed using Prism 6 (GraphPad Software, Inc., La Jolla, CA, USA; RRID:SCR_002798) or R (https://www.r-project.org/; exactRankTests package; RRID:SCR_001905). Population data are expressed as median and interquartile range and illustrated using box plots (central line: median; box: 25 % – 75 %; whiskers: 10 % – 90 %); outliers were not excluded from analysis. Paired data are illustrated using line plots. It should be noted that some data were excluded from paired analyses that were included in unpaired analyses (e.g. when CV could not be calculated due to an absence of firing); these data are represented in box plots overlying paired line plots. Because no assumptions were made concerning the distribution of population data, non-parametric statistics were used throughout. Paired and unpaired data were compared using the non-parametric Mann-Whitney U (MWU) and Wilcoxon Signed Rank (WSR) tests, respectively, and Fisher’s exact test was used for contingency analyses. When applicable, the Holm-Bonferroni correction for multiple comparisons (Holm, 1997) was applied (adjusted p-values are indicated as ph#, where # is the adjustment factor). P values < 0.05 were considered significant. To ensure the proposed research was adequately powered, sample sizes were estimated using the formulae described by Noether (Noether, 1987) assuming 80% power (i.e. the probability of a Type 2 error of 20%) and a two-tailed level of 0.05. For unpaired data (groups X and Y), and probabilities of X > Y (or X < Y) being 0.7, 0.8, and 0.9, the estimated sample sizes for each group are 33, 15, and 9, respectively. For paired data (where Xi and Xj are independent samples from X, reflecting effect size and sign) and the probabilities of Xi + Xj > 0 being 0.7, 0.8, and 0.9, the estimated sample sizes are 66, 30, and 17, respectively. Probabilities between 0.7 and 0.9 are representative of our historical, pilot, and actual data. Thus, for all core findings our study was at 80% power to detect probabilities of X > Y (or X < Y) and Xi + Xj > 0 (for unpaired and paired tests, respectively) between approximately 0.7 and 0.9.
Results
To determine the activity patterns of D2-SPNs, PV GPe neurons, and STN neurons, and their impact on GPe-STN network activity in vivo, neurons were identified and their activities manipulated through activation of the inhibitory opsin Arch-GFP (Chow et al., 2010). Arch-GFP was expressed virally in a cre-dependent manner in D2-SPNs, PV GPe neurons, and STN neurons in A2A-cre, PV-cre, and GABRR3-cre mice, respectively. In addition, mice received ipsilateral injections of 6-OHDA or vehicle in the MFB to lesion midbrain dopamine neurons and to control for surgical injection, respectively. Two-three weeks after surgery, mice were anesthetized with a combination of urethane and ketamine/xylazine and ipsilateral neuronal activity was recorded and manipulated optogenetically using silicon tetrodes/optrodes. Concurrent cortical activity was assessed from the EEG. After recording, mice were perfuse-fixed and the locations of recording tetrodes/optrodes were determined histologically (Fig. 1). Dopaminergic innervation of the striatum was quantified through immunohistochemistry for TH (Table 1). During cortical SWA and ACT, the relative powers of oscillatory activity in the EEG and LFPs in the GPe and STN in the 0.5–1.5 Hz, 10–39.9 Hz, and 40–250 Hz bands were similar in vehicle- and 6-OHDA-injected mice (Tables 2 and 3, respectively).
Figure 1. Schematic representation of electrode recording sites.

A-E, maps of electrode recording sites used in this study. Recording sites in vehicle- and 6-OHDA-injected mice are plotted as black and green, respectively. The rostrocaudal location of each map is denoted relative to Bregma. The dorsoventral (DV) and mediolateral (ML) axes, scale bar, and recording key denoted in A refer to each panel. The number of units per recording site is denoted by marker symbol. A, electrode sites in the striatum of A2A-cre mice. B, GPe electrode sites in A2A-Cre mice. C, GPe electrode sites in PV-Cre mice. D, STN recording sites in PV-Cre mice. E, GPe electrode sites in GABRR3-Cre mice.
Table 2.
Spectral properties of the EEG during cortical SWA and ACT in vehicle- and 6-OHDA-injected mice
| Frequency Band (Hz) | vehicle: Relative Power | 6-OHDA: Relative Power | p - value | vehicle: Peak Frequency (Hz) | 6-OHDA: Peak Frequency (Hz) | p - value | n (vehicle/6-OHDA) |
|---|---|---|---|---|---|---|---|
| 0.5–1.5 (SWA) | 0.247, 0.169–0.375 | 0.233, 0.124–0.335, | 0.2769 | 1.22, 0.855–1.34 | 1.1, 0.855–1.40 | 0.7042 | 60/69 |
| 10–39.9 (SWA) | (0.792, 0.53–1.23) × 10−2 | (0.827, 0.617–1.21) × 10−2 | 0.6455 | 10.4, 10.1–11.4 | 10.9, 10.3–12.3 | 0.0121* | 60/69 |
| 40–250 (SWA) | (0.332, 0.235–0.565) × 10−2 | (0.341, 0.193–0.523) × 10−2 | 0.4576 | 48.3, 44.1–54.1 | 45.0, 41.9–49.7 | 0.0090* | 60/69 |
| 0.5–1.5 (ACT) | (6.97, 3.43–13.4) × 10−2 | (7.21, 4.39–12.3) × 10−2 | 0.9121 | 0.610, 0.610–1.22 | 0.610, 0.610–1.47 | 0.7522 | 39/35 |
| 10–39.9 (ACT) | (2.55, 0.798–4.15) × 10−2 | (2.51, 1.88–4.18) × 10−2 | 0.2175 | 11, 10.1–12.7 | 11.5, 10.5–14.7 | 0.2907 | 39/35 |
| 40–250 (ACT) | (1.39, 0.608–2.44) × 10−2 | (1.47, 0.674–2.11) × 10−2 | 0.9549 | 45.7, 41.8–51.5 | 42.7, 41.0–44.7 | 0.0103* | 39/35 |
Relative power and peak frequency in the EEG of vehicle- and 6-OHDA-injected mice during cortical SWA or ACT in the 0.5–1.5 Hz, 10–39.9 Hz, and 40–250 Hz frequency bands. Power in each band was normalized to the power in the 0–250 Hz range.
p < 0.05 (MWU).
Table 3.
Spectral analysis of LFPs in the GPe and STN during cortical SWA and ACT in vehicle- and 6-OHDA-injected mice
| Frequency Band (Hz) | vehicle: Relative Power | 6-OHDA: Relative Power | p - value | vehicle: Peak Frequency (Hz) | 6-OHDA: Peak Frequency (Hz) | p - value | n vehicle/6-OHDA) |
|---|---|---|---|---|---|---|---|
| GPe 0.5–1.5 (SWA) | 0.408, 0.248 – 0.446 | 0.272, 0.135 – 0.347 | 0.0014 | 1.22, 0.977 – 1.34 | 0.977, 0.732 – 1.31 | 0.0749 | 25/48 |
| GPe 10–39.9 (SWA) | (0.912, 0.504 – 1.67) × 10−2 | (0.548, 0.281 – 0.124) × 10−2 | 0.0705 | 10.6, 10.0 – 11.8 | 10.4, 10.2 – 11.4 | 0.9464 | 25/48 |
| GPe 40–250 (SWA) | (4.06, 2.19 −6.90) × 10−3 | (3.33, 2.18 −9.48) × 10−3 | 0.7509 | 180, 59.8 – 180 | 180, 60.1 – 180 | 0.4841 | 25/48 |
| GPe 0.5–1.5 (ACT) | (3.61, 1.97 – 8.47) × 10−2 | (4.09, 2.40 – 8.58) × 10−2 | 0.5502 | 0.610, 0.610 – 1.22 | 0.610, 0.610 – 0.732 | 0.9704 | 21/24 |
| GPe 10–39.9 (ACT) | (2.66, 1.74 – 4.98) × 10−2 | (3.82, 1.29 – 4.64) × 10−2 | 0.8659 | 11.2, 10.3 – 12.8 | 10.7, 10.1 – 11.8 | 0.2312 | 21/24 |
| GPe 40–250 (ACT) | (1.48, 0.611 – 2.82) × 10−2 | (1.61, 0.573 −3.29) × 10−2 | 0.5963 | 180, 43.3 – 180 | 60.2, 45.5 – 180 | 0.5834 | 21/24 |
| STN 0.5–1.5 (SWA) | 0.194, 0.103 – 0.336 | 0.0878, 0.0506 – 0.161 | 0.0754 | 0.977, 0.763 – 1.31 | 1.34, 1.22 – 1.47 | 0.0303 | 8/11 |
| STN 10–39.9 (SWA) | (1.76, 0.622 – 2.90) × 10−2 | (0.913, 0.78 – 1.42) × 10−2 | 0.4421 | 11.5, 10.7 – 12.4 | 10.9, 10.3 – 12 | 0.5282 | 8/11 |
| STN 40–250 (SWA) | (2.19, 0.601 – 3.48) × 10−2 | (11.2, 0.71 – 1.47) × 10−2 | 0.3100 | 120, 60.0 – 180 | 180, 59.8 – 180 | 0.9525 | 8/11 |
| STN 0.5–1.5 (ACT) | (5.43, 1.66 −9.75) × 10−2 | (5.32, 3.92 – 6.61) × 10−2 | 0.9015 | 0.610, 0.610 – 0.610 | 0.610, 0.610 – 0.732 | 0.7308 | 7/7 |
| STN 10–39.9 (ACT) | (1.98, 0.853 – 3.39) × 10−2 | (1.3, 0.754 – 2.65) × 10−2 | 0.4557 | 11.2, 10.7 – 13.4 | 23.2, 14.8 – 30.5 | 0.0390 | 7/7 |
| STN 40–250 (ACT) | (2.40, 0.435 – 4.10) × 10−2 | (1.24, 1.22 – 2.14) × 10−2 | 0.8048 | 180, 59.8 – 180 | 180, 45.3 – 180 | 0.6503 | 7/7 |
Relative power and peak frequency in the LFPs of vehicle- and 6-OHDA-injected mice during cortical SWA or ACT in the 0.5–1.5 Hz, 10–39.9 Hz, and 40–250 Hz frequency bands. Power in each band was normalized to the power in the 0–250 Hz range.
p < 0.05 (MWU).
During cortical SWA the frequency of D2-SPN activity is greater in 6-OHDA-injected mice
Dopamine negatively modulates both cortico-striatal transmission (Bamford et al., 2004; Higley & Sabatini, 2010) and the intrinsic excitability of D2-SPNs (Gerfen & Surmeier, 2011; Planert et al., 2013). Therefore, we predicted that following the loss of dopamine, cortical SWA-associated D2-SPN activity would be elevated despite the similarity of cortical SWA in vehicle- and 6-OHDA-injected mice (Tables 2, 3). The specificity of Arch-GFP expression in D2-SPNs in A2A-cre mice was confirmed by its presence in the subset of SPNs that project to the GPe (Fig. 2A–C) but not to the SNr (Fig. 2D). In regions expressing Arch-GFP, approximately one half of striatal neurons were directly inhibited by activation of Arch-GFP and therefore identified as D2-SPNs (Fig. 2E and F; vehicle: 55 %, n = 62 of 112; 6-OHDA: 54 %, n = 34 of 63; p = 1.0000; Fisher’s Exact). Of the neurons that were excluded due to the absence of direct inhibition, 2 % (n = 1 of 50) in vehicle- and 8 % (n = 3 of 28) in 6-OHDA-treated mice were disinhibited during optogenetic stimulation. In both vehicle- and 6-OHDA-injected mice, D2-SPN activity was highly phasic and entrained to the active (positive) component of cortical SWA in the EEG in dopamine-intact and -depleted mice, consistent with direct driving of D2-SPN activity by cortical inputs (Fig. 2F). The frequency of D2-SPN activity measured during 30 second epochs of cortical SWA was elevated in 6-OHDA-injected mice relative to vehicle-injected controls (Fig. 2F and Ga; vehicle: rate = 1.75, 0.91–3.55 Hz; n = 62; 6-OHDA: rate = 3.02, 1.53–4.58 Hz; n = 34; p = 0.02068; MWU). The median increase was modest in absolute terms (~ 1.27 Hz) but large in relative terms (~ 72.6%). There was also a significant but slight increase in the, presumably due to the more intense phasic activity (Fig. 2Ga vehicle: CV = 1.47, 1.19–1.77; n = 62; 6-OHDA: CV = 1.65, 1.25–2.18; n = 34; p = 0.04235; MWU), equivalent to a 12% increase in median. The relationship between cortical SWA and D2-SPN firing was further examined through the generation of phase histograms. Firing in phase with cortical SWA was designated as activity within a 180° window centered on 0/360°. Antiphasic firing was designated as activity within a 180° window centered on 180°. The ratio of in-:antiphase spike probability in D2-SPNs was not altered by dopamine depletion (Fig. 2Ga and Gb; vehicle = 9.81, 3.60–14.4; n = 48; 6-OHDA = 3.91, 2.51–17.0; n = 27; p = 0.4671; MWU). Together these data demonstrate that following the loss of dopamine, the firing rate of D2-SPNs increased but the phase relationship of D2-SPN activity to cortical SWA was not altered. These data in mice are consistent with the activity of putative and identified striatopallidal neuron activity in dopamine intact and -depleted rats during cortical SWA (Mallet et al., 2006; Walters et al., 2007; Zold et al., 2012; Escande et al., 2016; Sharott et al., 2017).
Figure 2. During cortical SWA the frequency of D2-SPN activity is greater in 6-OHDA-injected mice.

A-D, immunohistochemistry was used to verify cre-dependent viral expression of Arch-GFP in D2-SPNs in vehicle- and 6-OHDA-injected A2A-cre mice. Aa and Ba, schematic representations of areas imaged in Ab and Bb (red box denotes the imaged subregion; ic, internal capsule). Ab, Bb, and C, expression of Arch-GFP (green) in D2-SPNs in the striatum (Ab and Ca) and their axon terminals in the GPe (Bb and Cb). Ca and Cb, expression of NeuN (red) in the somata of striatal (Ca) and GPe (Cb) neurons. NeuN-immunoreactive neurons that express or do not express Arch-GFP are denoted by arrows and asterisks, respectively. Da and Db, absence of Arch-GFP expressing axon terminals (Da) and TH-immunoreactive neurons (Db) ipsilateral to injections of AAV in the striatum and 6-OHDA in the MFB. TH-immunoreactive substantia nigra (SN) and ventral tegmental area (VTA) neurons (red; arrows) are visible contralateral to the injection of 6-OHDA (Db). E-G, optogenetically identified D2-SPN firing rate was elevated in 6-OHDA-injected mice relative to vehicle-injected mice. E, schematic representation of EEG electrode and optrode placement (dark blue line indicates electrode; yellow line denotes affixed optical fiber; M1, primary motor cortex). Fa and Fb, representative EEG (upper trace; filtered at 0.5–1.5 Hz) and D2-SPN unit activity (below) from vehicle- (Fa) and 6-OHDA-injected (Fb) mice. D2-SPNs were identified by their inhibited activity during optogenetic stimulation of Arch-GFP (yellow bar). G, the frequency and to a lesser extent the CV of D2-SPN activity were significantly greater in 6-OHDA- versus vehicle-injected mice. However, D2-SPN activity was similarly entrained to the active component of cortical SWA. Ga, population box plots, D2-SPN firing rate (left), CV (middle), and in-:antiphase spikes (right); representative examples plotted with magenta symbols; five individual outlier data points were not plotted for legibility (outliers; 6-OHDA frequency: 15.5, 15.4, 30.3 Hz; vehicle in-:antiphase spikes: 193; 6-OHDA in-:antiphase spikes: 91.0). Gb, population linear phase histograms illustrate the phase relationship between D2-SPN neuron firing and cortical SWA in vehicle- and 6-OHDA-injected mice. Active (blue) and inactive (gray) components of SWA are denoted. *, p < 0.05. ns, not significant.
In dopamine-depleted mice PV GPe neuron activity is relatively antiphasic to cortical SWA
Given the elevation of D2-SPN activity in dopamine-depleted mice and loss of presynaptic D2R-mediated inhibition of striatopallidal GABA release (Miguelez et al., 2012; Lemos et al., 2016), we predicted that D2-SPNs would more effectively pattern postsynaptic prototypic GPe neuron activity in the absence of dopamine. Because D2-SPNs exhibit increased firing in phase with cortical SWA in dopamine-depleted mice, we predicted that the firing of postsynaptic prototypic GPe neurons would be relatively antiphasic to cortical SWA. To identify prototypic GPe neurons, the majority of which express PV (Mastro et al., 2014; Abdi et al., 2015; Dodson et al., 2015; Hernandez et al., 2015), Arch-GFP was virally expressed in PV-cre mice (Fig. 3A–C). Immunohistochemistry confirmed that the majority of Arch-GFP-expressing neurons co-expressed PV (Fig. 3A; 83, 73–93 %; n = 2 mice). Consistent with their prototypic identity, Arch-GFP was also strongly expressed by axon terminals in the STN (Fig. 3B). Incomplete immunohistochemical detection of PV was presumably the reason for the absence of PV immunoreactivity in 17 % of Arch-GFP expressing GPe neurons. In contrast, arkypallidal neurons, identified by their immunoreactivity for FoxP2 (Abdi et al., 2015; Dodson et al., 2015; Hernandez et al., 2015), did not co-express Arch-GFP (Fig. 3Ad; 0, 0–0 %; n = 2 mice). Together these data confirm the selective expression of Arch-GFP in PV GPe neurons and the absence of Arch-GFP expression in arkypallidal FoxP2 GPe neurons. Consistent with the relative abundance of PV GPe neurons, the majority of GPe neurons that were recorded were inhibited by optogenetic activation of Arch-GFP (Fig. 3C and D; vehicle: 82 %, n = 27 of 33; 6-OHDA: 84 %, n = 27 of 32; p = 1.0000; Fisher’s Exact). However, given that recordings were initiated from tetrode locations where at least one GPe neuron was inhibited during optogenetic activation of Arch-GFP, recordings were likely to be biased toward prototypic neurons. Of those GPe neurons that were not directly inhibited by stimulation, 83 % (n = 5 of 6) in vehicle and 40 % (n = 2 of 5) in 6-OHDA-treated mice were disinhibited, presumably due to inhibition of presynaptic PV GPe neurons.
Figure 3. In 6-OHDA-injected mice PV GPe neuron activity is relatively antiphasic to cortical SWA.

A and B, immunohistochemistry was used to verify the cre-dependent viral expression of Arch-GFP in PV GPe neurons in vehicle- and 6-OHDA-injected PV-cre mice. Aa and Ba, schematic representations of areas imaged in Ab and Bb (red box denotes the imaged subregion). Ab-d, Bb, and Bc, expression of Arch-GFP (green) in GPe neurons (Ab-d) and their axon terminals in the STN (Bb, Bc; zi, zona incerta). Ac, expression of Arch-GFP in PV-immunoreactive prototypic GPe neurons (red; arrows). Ad, absence of Arch-GFP expression in FoxP2-immunoreactive arkypallidal GPe neurons (red; arrows). Bb, Arch-GFP expression in GPe axon terminals in the STN arising from the injection in Ab. Bc, Arch-GFP expressing axon terminals in the vicinity of NeuN-immunoreactive STN neurons (red; asterisks). C, schematic representation of optrode and EEG electrode placement (dark blue line indicates electrode; yellow line denotes affixed optical fiber). D, PV GPe neurons were identified through optogenetic stimulation of Arch-GFP which inhibited their activity (yellow bar). Da and E, in vehicle-injected dopamine-intact mice PV GPe neuron activity was relatively tonic and not consistently phase-related to cortical SWA. Db and E, in 6-OHDA-injected, dopamine-depleted mice PV GPe neuron activity was more entrained to the inactive component of cortical SWA. Ea, population data, PV GPe neuron firing rate (left), CV (middle), and in-:antiphase spikes (right); example data plotted with magenta symbols; two outlier data points were not plotted for legibility (vehicle in-:antiphase spike probability outliers: 2.05, 6.63). Eb, Population linear phase histograms of PV GPe neuron firing relative to cortical SWA in vehicle- and 6-OHDA-injected mice. *, p < 0.05. ns, not significant.
As for D2-SPNs, PV GPe neuron firing was first recorded during 30 second epochs of robust cortical SWA. In control mice, PV GPe neurons discharged in a tonic, irregular firing pattern during cortical SWA (Fig. 3Da and Ea; vehicle: frequency = 16.8, 9.23–30.1 Hz; n = 27; CV = 0.868, 0.554–1.01; n = 27). In dopamine-depleted mice, the rate of discharge of PV GPe neurons was similar but firing was more irregular relative to control (Fig. 3Db and Ea; 6-OHDA: frequency = 15.6, 12.5–25.2 Hz; n = 27; p = 0.9280; MWU; CV = 1.29, 0.824–1.59; n = 27; p = 2.163 × 10⁻³; MWU). Comparison of the in-:antiphase spike probability ratio in vehicle- and 6-OHDA-injected mice, revealed a shift in PV GPe neuron phase preference to firing that was more antiphasic to cortical SWA (Fig. 3E; SWA: vehicle = 0.801, 0.664–1.18; n = 27; 6-OHDA = 0.675, 0.418–0.883; n = 27; p = 9.16 × 10⁻³; MWU). These data are consistent with studies in dopamine-depleted rats, which demonstrated that juxtacellularly labeled prototypic GPe neurons, defined on the basis of their descending axon collaterals and in some cases their expression of PV, exhibited firing that was relatively antiphasic to cortical SWA (Magill et al., 2001; Mallet et al., 2008b; Mallet et al., 2012; Abdi et al., 2015). Past studies focused on prototypic GPe neuron populations that adhered to specific firing characteristics such as phase locking to cortical SWA for analysis (Magill et al., 2001; Mallet et al., 2008b; Mallet et al., 2012; Abdi et al., 2015). Here, we included all optogenetically identified PV GPe neurons and report more variability in phase preference. Our use of mice versus rats in earlier studies may also contribute to this variability.
During cortical SWA, D2-SPNs contribute to the antiphasic firing of GPe neurons in 6-OHDA-injected mice
To determine whether the relatively antiphasic firing of GPe neurons is linked to the increased in-phase activity of D2-SPNs in dopamine-depleted mice, D2-SPNs were optogenetically inhibited for 5 second epochs and the effect on GPe neuron activity was assessed. Use of A2A-cre mice to selectively express Arch-GFP in D2-SPNs precluded optogenetic identification of PV GPe neurons. Although recordings were only initiated where putative disinhibition of GPe neurons was observed during optical stimulation, responsive GPe neurons were relatively rare (46 %, n = 26 of 57), presumably because 1) the zone of optogenetic inhibition versus the size of the striatum was small and 2) the striatopallidal projection is highly topographic in nature (Chang et al., 1981; Wilson & Phelan, 1982; Hedreen & DeLong, 1991; Hazrati & Parent, 1992; Smith et al., 1998), lowering the probability of recording from connected parts of the striatum and GPe. In the majority of responsive GPe neurons D2-SPN inhibition elevated the frequency (Fig. 4A and Ba; 6-OHDA: 85 %, n = 22 of 26; laser off = 17.9, 11.3–29.4 Hz; laser on = 23.0, 15.9–34.0 Hz; n = 26; p = 1.013 × 10⁻⁶; WSR) and regularity (Fig. 4A and Ba; 6-OHDA: 92 %, n = 23 of 25; laser off CV = 1.10, 0.898–1.27; laser on CV = 0.701, 0.561–0.817; n = 25; p = 2.98 × 10⁻⁷; WSR) of their firing. Furthermore, inhibition of D2-SPNs reduced antiphasic GPe activity, as indicated by an increase in in-:antiphase spike probability (Fig. 4Ba and Bb; 6-OHDA: 64 %, n = 16 of 25; laser off = 0.694, 0.567–1.07; laser on = 0.897, 0.791–1.02; n = 25; p = 0.04826; WSR).
Figure 4. Optogenetic inhibition of D2-SPNs reduces antiphasic GPe activity in 6-OHDA-injected mice.

A-C, optogenetic inhibition of D2-SPNs in 6-OHDA-injected A2A-cre mice increased the frequency and decreased the variability (CV) of firing, and increased the in-:antiphase spike probability of unidentified (B) and putative PV GPe neurons (C). A, schematic representation of optrode and electrode placement (Aa, dark blue line indicates electrode; yellow line denotes affixed optical fiber) and representative example (Ab). Ba and Ca, population firing rate (left), CV (middle), and in-:antiphase spike probability (right) for unidentified (Ba) and putative PV (Ca) GPe neurons; example data plotted in magenta. Bb and Cb, population linear phase histograms for unidentified (Bb) and putative PV (Cb) GPe neurons (C). *, p < 0.05.
To more selectively examine the impact of D2-SPN input on PV GPe neurons, putative PV GPe neuron activity was isolated by analyzing neurons with in-:antiphase spike probability ratios falling within the IQR of identified PV GPe (putative PV GPe) neurons in PV-cre mice. In response to optogenetic inhibition of D2-SPNs, putative PV GPe neurons in A2A-cre mice were uniformly disinhibited, (Fig. 4Ca; 6-OHDA: 100 %, n = 14 of 14; laser off = 24.3, 16.3–34.2 Hz; laser on = 30, 20.5–40.9 Hz; n = 14; p = 1.221 × 10⁻⁴; WSR). In addition, their firing decreased in irregularity (Fig. 4Ca; 6-OHDA: 93 %, n = 13 of 14; laser off CV = 1.24, 0.967–1.37; laser on CV = 0.752, 0.536–0.870; n = 14; p = 2.441 × 10⁻⁴; WSR) and became less antiphasic (Fig. 4C; 6-OHDA: 93 %, n = 13 of 14; in-:antiphase spike probability: laser off = 0.638, 0.574–0.721; laser on = 0.813, 0.76–102; n = 14; p = 2.441 × 10⁻⁴; WSR). Thus, optogenetic inhibition of D2-SPNs reduced antiphasic discharge and normalized the pattern of unidentified GPe neuron activity in dopamine-depleted mice. These effects were more uniform in the putative PV GPe subset of GPe neurons. Together, these data demonstrate that during cortical SWA, D2-SPN activity contributes to the abnormally antiphasic firing of GPe neurons in dopamine-depleted mice.
Following loss of dopamine the autonomous firing of PV GPe neurons is significantly elevated
Loss of autonomous activity in GPe neurons has been suggested to contribute to their abnormally phasic activity in vivo following dopamine depletion (Chan et al., 2011). However, this work was carried out before the more recent discovery of multiple GPe neuron subtypes. Therefore, the autonomous firing of PV GPe neurons was compared in ex vivo brain slices derived from vehicle- and 6-OHDA-injected mice. In order to identify PV GPe neurons for patch clamp recording, tdTomato was conditionally expressed in PV neurons by crossing PV-cre mice with Ai9 reporter mice in which a loxP-flanked STOP cassette prevents transcription of downstream tdTomato. Selective expression of tdTomato in PV GPe neurons was first confirmed using immunohistochemistry for PV (Fig. 5A and B). Of neurons expressing tdTomato, PV, or both markers: 1) 73, 66–78 % co-expressed tdTomato and PV (n = 3 mice) 2) 9, 4–14 % expressed tdtomato but were not immunoreactive for PV (n = 3 mice), most likely due to less than 100% efficiency of immunodetection 3) 18, 18–20 % (n = 3 mice) of neurons did not express tdTomato but were PV-immunoreactive, presumably due to < 100 % efficiency of cre-mediated excision of the loxP-flanked STOP cassette. Less than 1 % of tdTomato expressing GPe neurons co-expressed the arkypallidal neuron marker FoxP2, consistent with previous reports (Abdi et al., 2015; Hernandez et al., 2015; data not shown). Together, these data suggest that tdTomato expression in this mouse line is a reliable marker of prototypic, PV GPe neurons. Cell-attached, current clamp recordings of GPe tdTomato-expressing neurons in ex vivo brain slices were conducted in the presence of AMPA, NMDA, GABAA, and GABAB receptor antagonists in order to measure their autonomous activity. As described previously, PV GPe neurons discharged regularly and at high frequency in brain slices derived from dopamine-intact mice (Fig. 5C and D; vehicle: frequency = 35.1, 26.8–44.0 Hz; CV = 0.13, 0.10–0.23; n = 89) (Mastro et al., 2014; Abdi et al., 2015; Dodson et al., 2015; Hernandez et al., 2015). The autonomous firing of PV GPe neurons in slices from 6-OHDA-injected mice was not only retained but significantly elevated compared to firing of PV GPe neurons in vehicle-injected mice (Fig. 5C and D; 6-OHDA: frequency = 41.7, 34.0–50.2 Hz; CV = 0.12, 0.08–0.20; n = 98; frequency, p = 5.35 × 10⁻⁴; CV, p = 0.1336; WSR). Together these data suggest that the abnormally phasic pattern of PV GPe neuron firing in dopamine-depleted mice in vivo is not caused by loss of autonomous firing. In fact, autonomous firing was significantly up-regulated following the loss of dopamine, presumably through engagement of homeostatic compensatory mechanisms that were triggered by elevated striatopallidal transmission.
Figure 5. In 6-OHDA-injected mice the frequency of autonomous PV GPe neuron activity ex vivo is elevated.

A and B, in PV-cre X Ai9 mice the majority of GPe neurons that expressed tdTomato (red) or were immunohistochemically labeled for PV (green), co-expressed both proteins (yellow), as evinced by a representative coronal section through the GPe (Aa, schematic representation of the area imaged in Ab; Ac, upper panel, PV; middle panel, tdTomato; lower panel, both) and quantitative population data (B). C and D, the autonomous activity of tdTomato-expressing GPe neurons recorded in the loose-seal, cell-attached configuration was not disrupted in 6-OHDA-injected mice relative to activity in control mice. Indeed, the frequency of autonomous firing was significantly greater in 6-OHDA-injected dopamine-depleted mice compared to that in control mice. C, representative examples. D, population data. *, p < 0.05. ns, not significant.
The STN opposes rather than facilitates antiphasic GPe neuron activity
The GPe-STN network has been proposed to be a central pattern generator of abnormal oscillatory activity in PD (Plenz & Kital, 1999; Holgado et al., 2010; Moran et al., 2011). In dopamine-depleted mice, if the STN contributes to the abnormal antiphasic activity of the GPe during cortical SWA, optogenetic inhibition of the STN should regularize GPe activity. Thus, we compared the responses of GPe neurons to optogenetic inhibition of the STN for 5 seconds in vehicle- and 6-OHDA-injected GABRR3-cre mice (Table 1) during cortical SWA. Confocal imaging confirmed the robust, selective, cre-dependent expression of Arch-GFP in STN neurons (Fig. 6A and Ca) and their axon terminals in the GPe (Fig. 6B and Cb). However, the use of this cre-driver line to virally express Arch-GFP in the STN precluded optogenetic identification of PV GPe neurons. The proportion of GPe neurons that responded to optogenetic inhibition of the STN was not significantly different in vehicle- and 6-OHDA-injected mice (vehicle: 62 % responsive, n = 23 of 37; 6-OHDA 70 % responsive, n = 21 of 30; p = 0.6076; Fisher’s Exact). Optogenetic inhibition of STN neurons reduced GPe neuron activity in all responsive neurons in both vehicle- and 6-OHDA-injected mice (Figs. 6D, 7A and Ba; vehicle: laser off = 14.3, 7.60–21.5 Hz; laser on = 7.90, 4.90–12.6 Hz; n = 23; ph4 = 9.54 × 10⁻⁷; WSR; 6-OHDA: laser off = 17.8, 13.1–28.3 Hz; laser on = 15.6, 7.50–23.2 Hz; n = 21; ph3 = 8.58 × 10⁻⁶; WSR). The firing rate of GPe neurons in vehicle-injected mice was not significantly different to those in 6-OHDA-injected mice (Figs. 6D, 7A and 7Ba; laser off: ph1 = 0.05722; MWU); however, during optogenetic inhibition of the STN, GPe neuron firing rates were relatively elevated in 6-OHDA mice (Figs. 6D, 7A and 7Ba; laser on: ph2 = 0.02696; MWU).
Figure 6. Effect of optogenetic inhibition of the STN on GPe activity.

A-C, histological verification of cre-dependent expression of Arch-GFP in STN-GPe neurons in GABRR3-cre mice. Aa and Ba, schematic representations of areas imaged in Ab and Bb, respectively (red box denotes the imaged subregion). Ab, Bb, and C, coronal sections illustrating expression of Arch-GFP (green) in STN neuron somata (Ab and Ca; arrows) and their axon terminals in the GPe (Bb and Cb). Ca, expression of Arch-GFP in HuC/D-immunoreactive (red) STN neurons. Cb, Arch-GFP expressing STN axon terminals in the vicinity of HuC/D-immunoreactive (red; asterisks) GPe neurons. D, schematic representation of optrode and electrode placement (Da; dark blue line indicates electrode; yellow line denotes affixed optical fiber) and representative examples from vehicle- (Db) and 6-OHDA-injected (Dc) mice. Note that multi-unit STN activity is illustrated due to the greater difficulty of spike sorting individual STN units when recorded with an optrode versus a silicon tetrode without a fiber optic.
Figure 7. Optogenetic inhibition of STN neurons decreases the firing rate of unidentified and putative PV GPe neurons and increases their antiphasic activity in 6-OHDA-injected mice.
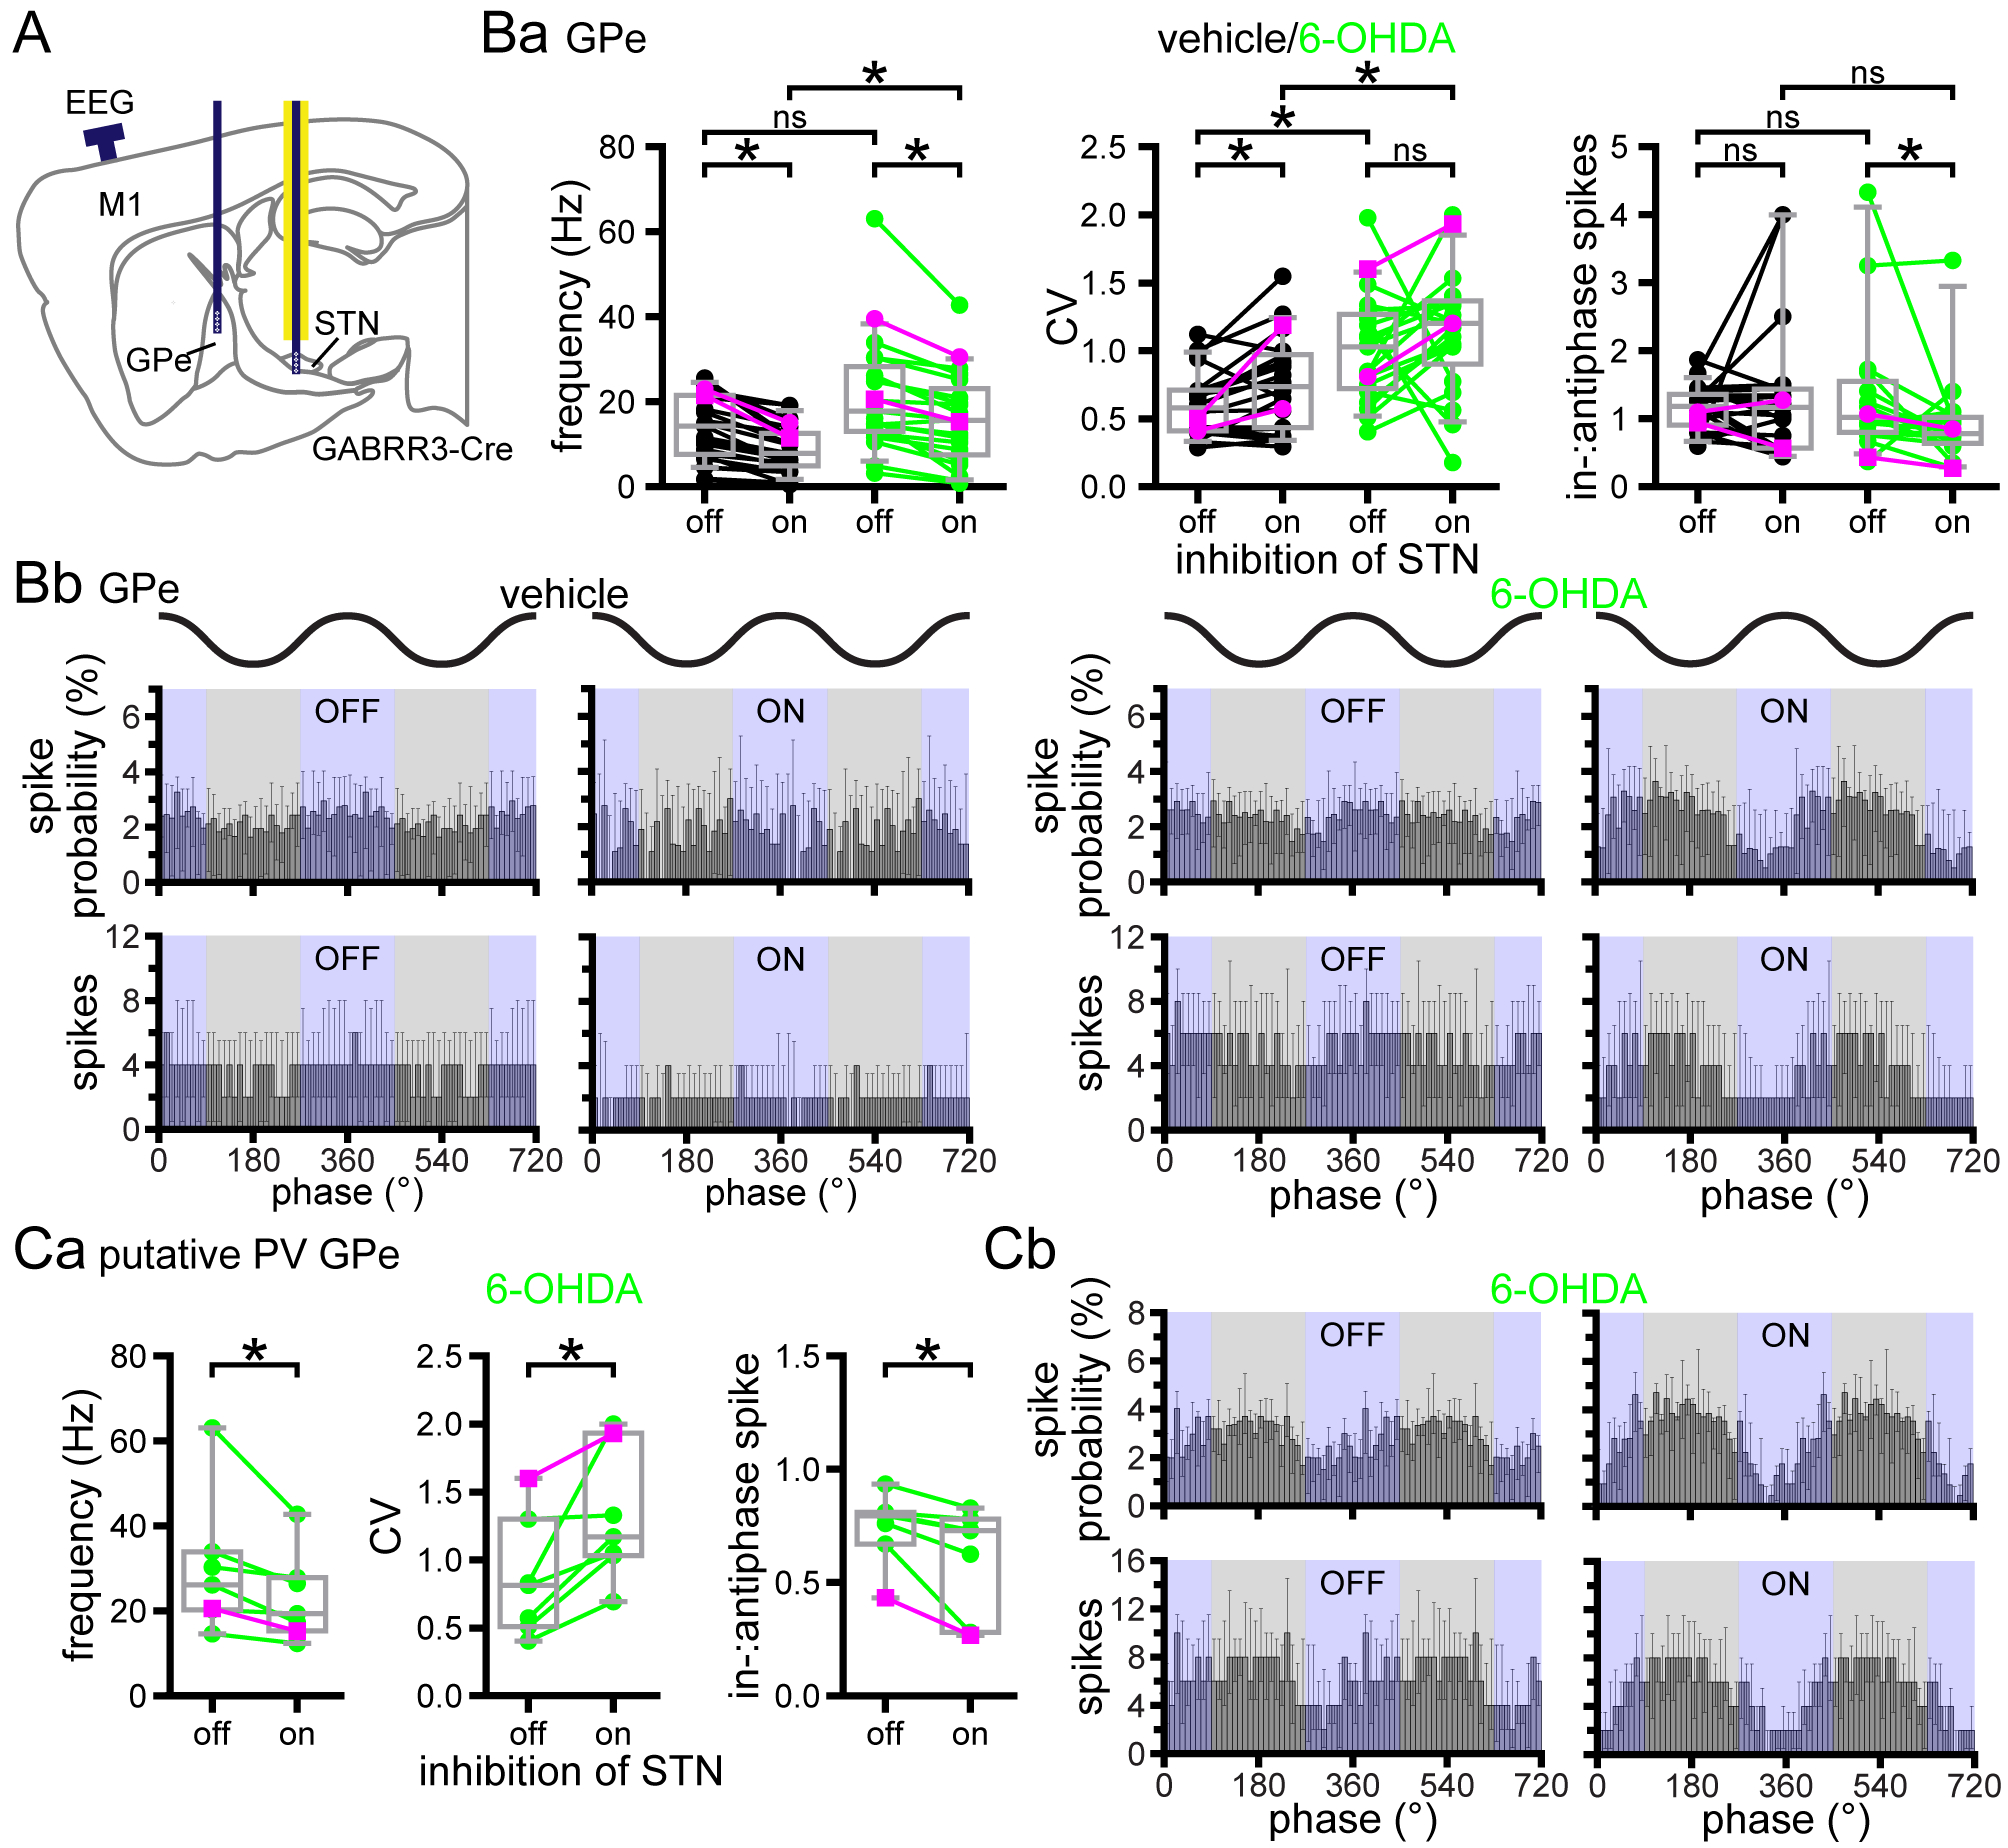
A-C, optogenetic inhibition of STN neurons in vehicle-injected GABRR3-cre mice reduced the firing frequency and firing regularity of unidentified GPe neurons (B). Inhibition of the STN also reduced the firing frequency and in-:antiphase spike probability of unidentified (B) and putative PV GPe (C) neurons in 6-OHDA-injected mice. A, schematic representation of optrode and electrode placement (A; dark blue line indicates electrode; yellow line denotes affixed optical fiber). Ba and Ca, population data of unidentified (Ba) and putative PV (Ca) GPe neurons; firing rate (left), CV (middle), and in-:antiphase spike probability (right); example data from Fig. 6D plotted in magenta. Note an extreme outlier was excluded from the 6-OHDA-injected mouse in-:antiphase plot for clarity (Ba; in- to antiphase spike probability ratio: laser off = 18.5, laser on = 7.0). Bb and Cb, linear phase histograms of unidentified (Bb) and putative PV (Cb) GPe neuron activity prior to and during optogenetic inhibition of STN neurons. *, p < 0.05. ns, not significant.
The firing of unidentified GPe neurons in vehicle- and 6-OHDA-injected mice prior to and during optogenetic inhibition of the STN was significantly more irregular in 6-OHDA-injected mice (Figs. 6D and 7Ba; vehicle: laser off CV = 0.606, 0.413–0.717; n = 23; 6-OHDA: laser off CV = 1.03, 0.723–1.27, n = 21; ph4 = 2.502 × 10⁻³; MWU; vehicle: laser on CV = 0.737, 0.436–0.973; n = 22; 6-OHDA: laser on CV = 1.20, 0.903–1.37; n = 21; ph3 = 6.951 × 10⁻³; MWU). During optogenetic inhibition of STN neurons, the regularity of firing of responsive GPe neurons decreased in vehicle-injected mice but was not altered in 6-OHDA-injected mice (Figs. 6D and 7Ba; vehicle: laser off CV = 0.581, 0.410–0.711; n = 22; vehicle: laser on CV = 0.737, 0.436–0.973; n = 22; ph2 = 9.37 × 10⁻³; WSR; 6-OHDA: laser off CV = 1.03, 0.723–1.27; n = 21; 6-OHDA: laser on CV = 1.20, 0.903–1.37; n = 21; ph1 = 0.1281; WSR). During optogenetic inhibition of the STN, the in-:antiphase spike probability of GPe neurons decreased in 6-OHDA- but was unaltered in vehicle-injected mice (Fig. 7B; vehicle: laser off = 1.18, 0.908–1.36; laser on = 1.11, 0.571–1.43; n = 22; ph2 = 1.000; WSR; 6-OHDA: laser off = 1.02, 0.799–1.55; laser on = 0.781, 0.641–1.02; n = 21; ph4 = 0.01143; WSR). Unidentified GPe neurons in dopamine-depleted GABRR3-cre mice were less antiphasic than optogenetically identified PV GPe neurons in dopamine-depleted PV-cre mice. The reason for this difference could be inclusion of arkypallidal GPe neurons thought to fire in phase with cortical SWA following dopamine depletion and perhaps also non-PV-expressing prototypic GPe neurons, whose phase preference has not been well characterized (Mallet et al., 2012; Abdi et al., 2015).
To examine the impact of STN inhibition on PV GPe neuron firing, putative PV GPe neurons in 6-OHDA-injected mice were isolated from the unidentified population as for unidentified GPe neurons in A2A-cre mice on the basis of their in-:antiphase spike probability. The firing rate of all putative PV GPe neurons decreased during optogenetic inhibition of the STN (Fig. 7Ca; 6-OHDA: laser off = 26.2, 20.3–33.9 Hz; laser on = 19.4, 15.3–27.9 Hz; n = 7; p = 0.01562; WSR). Unlike the unidentified population of GPe neurons, the irregularity of putative PV GPe neurons was elevated by optogenetic inhibition of the STN (Fig. 7Ca; 6-OHDA: laser off CV = 0.815, 0.509–1.3; laser on CV = 1.17, 1.03–1.93; n = 7; p = 0.01562; WSR). Lastly, all putative PV GPe neurons became more antiphasic during optogenetic inhibition of the STN as evinced by a significant decrease in in-:antiphase spike probability (Fig. 7C; 6-OHDA: laser off = 0.795, 0.670–0.811; laser on = 0.731, 0.280–0.781; n = 7; p = 0.01562; WSR). Overall, STN silencing enhanced antiphasic firing in unidentified and putative GPe neurons in dopamine-depleted mice, arguing that STN-GPe transmission opposes rather than facilitates the abnormal patterning of GPe neurons during cortical SWA.
Dopamine depletion reduces phase locking of STN neuron firing to cortical SWA
Parkinsonian circuit activity in humans (Sharott et al., 2014), monkeys (Soares et al., 2004; Deffains et al., 2016b), and rats (Magill et al., 2001; Ni et al., 2001; Walters et al., 2007; Mallet et al., 2008b; Ryu et al., 2011; Tachibana et al., 2011; Delaville et al., 2015) is typically associated with alterations in STN activity, including relative entrainment to cortical rhythmic activity, increased phasic or burst firing, and overall hyperactivity. Thus, in urethane-anesthetized dopamine-depleted mice, we predicted similar changes in the rate and pattern of STN activity as those reported in equivalent rat studies. To assess the impact of dopamine depletion on the rate and pattern of STN activity, 30 s epochs of firing during robust cortical SWA were compared in vehicle- and 6-OHDA-injected PV-cre mice (Table 1). Similar proportions of STN neurons were responsive to optogenetic inhibition of PV GPe neurons in vehicle and 6-OHDA treated mice (vehicle: 82 %, n = 18 of 22; 6-OHDA: 84 %, n = 21 of 25; p = 1.000; Fisher’s Exact). Dopamine depletion did not alter the firing rate (Fig. 8A, and Ba; SWA: vehicle = 9.38, 5.90–16.4 Hz; n = 18; 6-OHDA = 11.7, 8.17–13.3 Hz; n = 21; p = 0.7122; MWU) or CV (SWA: vehicle = 1.3, 0.979–1.64; n = 18; 6-OHDA = 1.35, 1.15–1.68; n = 21; p = 0.494; MWU) of responsive STN neurons. However, there was a significant reduction in in-:antiphase spike probability following dopamine depletion (Fig. 8B; SWA: vehicle = 3.45, 1.92–6.54; n = 18; 6-OHDA = 1.69, 0.992–3.16; n = 21; p = 0.0148; MWU). These findings are in contrast to what has been reported in dopamine-depleted rats (Magill et al., 2001; Mallet et al., 2008a; Mallet et al., 2008b) and unexpected given the emergence of phase-offset prototypic GPe neuron activity, but are consistent with downregulation of cortico-STN transmission strength in parkinsonian rats (Kita & Kita, 2011a; Wang et al., 2018), mice (Chu et al., 2017), and non-human primates (Mathai et al., 2015) and downregulation of intrinsic excitability in rats and mice (Zhu et al., 2002; Wilson et al., 2006; McIver et al., 2019).
Figure 8. In 6-OHDA-injected mice phase locking of STN firing to cortical SWA is reduced.

A and B, although STN neuron firing rate and CV were unaffected by dopamine depletion, there was a significant reduction in in-:antiphase spike probability. A, schematic representation of electrode placement (Aa; dark blue line indicates electrode) mice and representative examples from vehicle- (Ab) and 6-OHDA- (Ac) injected PV-cre mice. Ba, population firing rate (left), CV (middle), and in-:antiphase spike probability (right); example data plotted in magenta; three individual outlier data points were not plotted for legibility (vehicle frequency outlier: 36.7 Hz; vehicle in-:antiphase spike probability outlier: 28.7; 6-OHDA in-:antiphase spike probability outlier: 50.2). (Bb) Population linear phase histograms. *, p < 0.05. ns, not significant.
PV GPe neuron activity enhances STN neuron entrainment to cortical SWA in control- and dopamine-depleted mice
To determine how alterations in the firing pattern, and intrinsic and synaptic properties of prototypic GPe neurons following the loss of dopamine (Fan et al., 2012; Mallet et al., 2012; Abdi et al., 2015; Chu et al., 2015; this study) affect their regulation of STN activity in vivo, the effects of optogenetically inhibiting Arch-GFP expressing PV GPe neurons for 5 seconds on STN neuron firing in control and dopamine-depleted mice (Table 1) were compared. The majority of responsive STN neurons were disinhibited during optogenetic inhibition of PV GPe neurons (vehicle: 72 %, n = 13 of 18; 6-OHDA: 100 %, n = 21 of 21, p = 0.6356; Fisher’s Exact). Inhibition of a minority of responsive STN neurons during PV GPe neuron silencing in vehicle-injected mice may reflect disinhibition of GPe-STN neurons due to reduced lateral inhibition in the GPe (11 %, n = 2 of 18). The failure of a subset of STN neurons to respond to PV GPe neuron inhibition presumably reflects a failure to inhibit GPe neurons that were presynaptic to recorded STN neurons (vehicle: 18 %, n = 4 of 22; 6-OHDA: 16 %, n = 4 of 25). Given that STN activity was not recorded at sites where optogenetic inhibition of PV GPe neurons failed to elicit a response from at least one STN neuron, the proportion of STN neurons that did not respond to optical stimulation is likely to be higher than that reported here. During optogenetic inhibition of PV GPe neurons, the rate and regularity of STN firing increased in both vehicle- and 6-OHDA-injected mice consistent with disinhibition of STN neurons (Fig. 9A and Ba; vehicle: laser off = 11.9, 6.58–16.6 Hz; laser on = 15, 8.88–22.7 Hz; n = 18; ph3 = 8.424 × 10⁻³; WSR; laser off CV = 1.38, 1.04–1.82; laser on CV = 0.891, 0.704–0.968; n = 17; ph3 = 6.27 × 10⁻³; WSR; 6-OHDA: laser off =10.3, 7.30–13.7 Hz; laser on = 18.3, 12.3–29.9 Hz; n = 21; ph4 = 3.815 × 10⁻⁶; WSR; laser off CV = 1.22, 0.985–1.47; laser on CV = 0.727, 0.538–0.872; n = 21; ph4 = 7.628–6; WSR). The firing rate of responsive STN neurons was not significantly different in dopamine-intact and -depleted mice in the absence of or during optogenetic inhibition of PV GPe neurons (Fig. 9A and Ba; laser off: ph1 = 0.4990; MWU; laser on: ph2 = 0.4464; MWU). Although the CV of STN neuron firing was not altered by dopamine depletion alone, it was relatively reduced in 6-OHDA-injected mice during optogenetic inhibition of PV GPe neurons (Fig. 9A and Ba; vehicle: laser off CV = 1.36, 0.936–1.79, n = 18; 6-OHDA laser off CV = 1.22, 0.985–1.47; n = 21; ph1 = 0.770 MWU; vehicle: laser on CV = 0.891, 0.704–0.968; n = 17; 6-OHDA: laser on CV = 0.727, 0.538–0.872; n = 21; ph2 = 0.02074; MWU).
Figure 9. Optogenetic inhibition of PV GPe neurons disinhibits STN neurons and reduces their phase locking to cortical SWA in both vehicle- and 6-OHDA-injected mice.
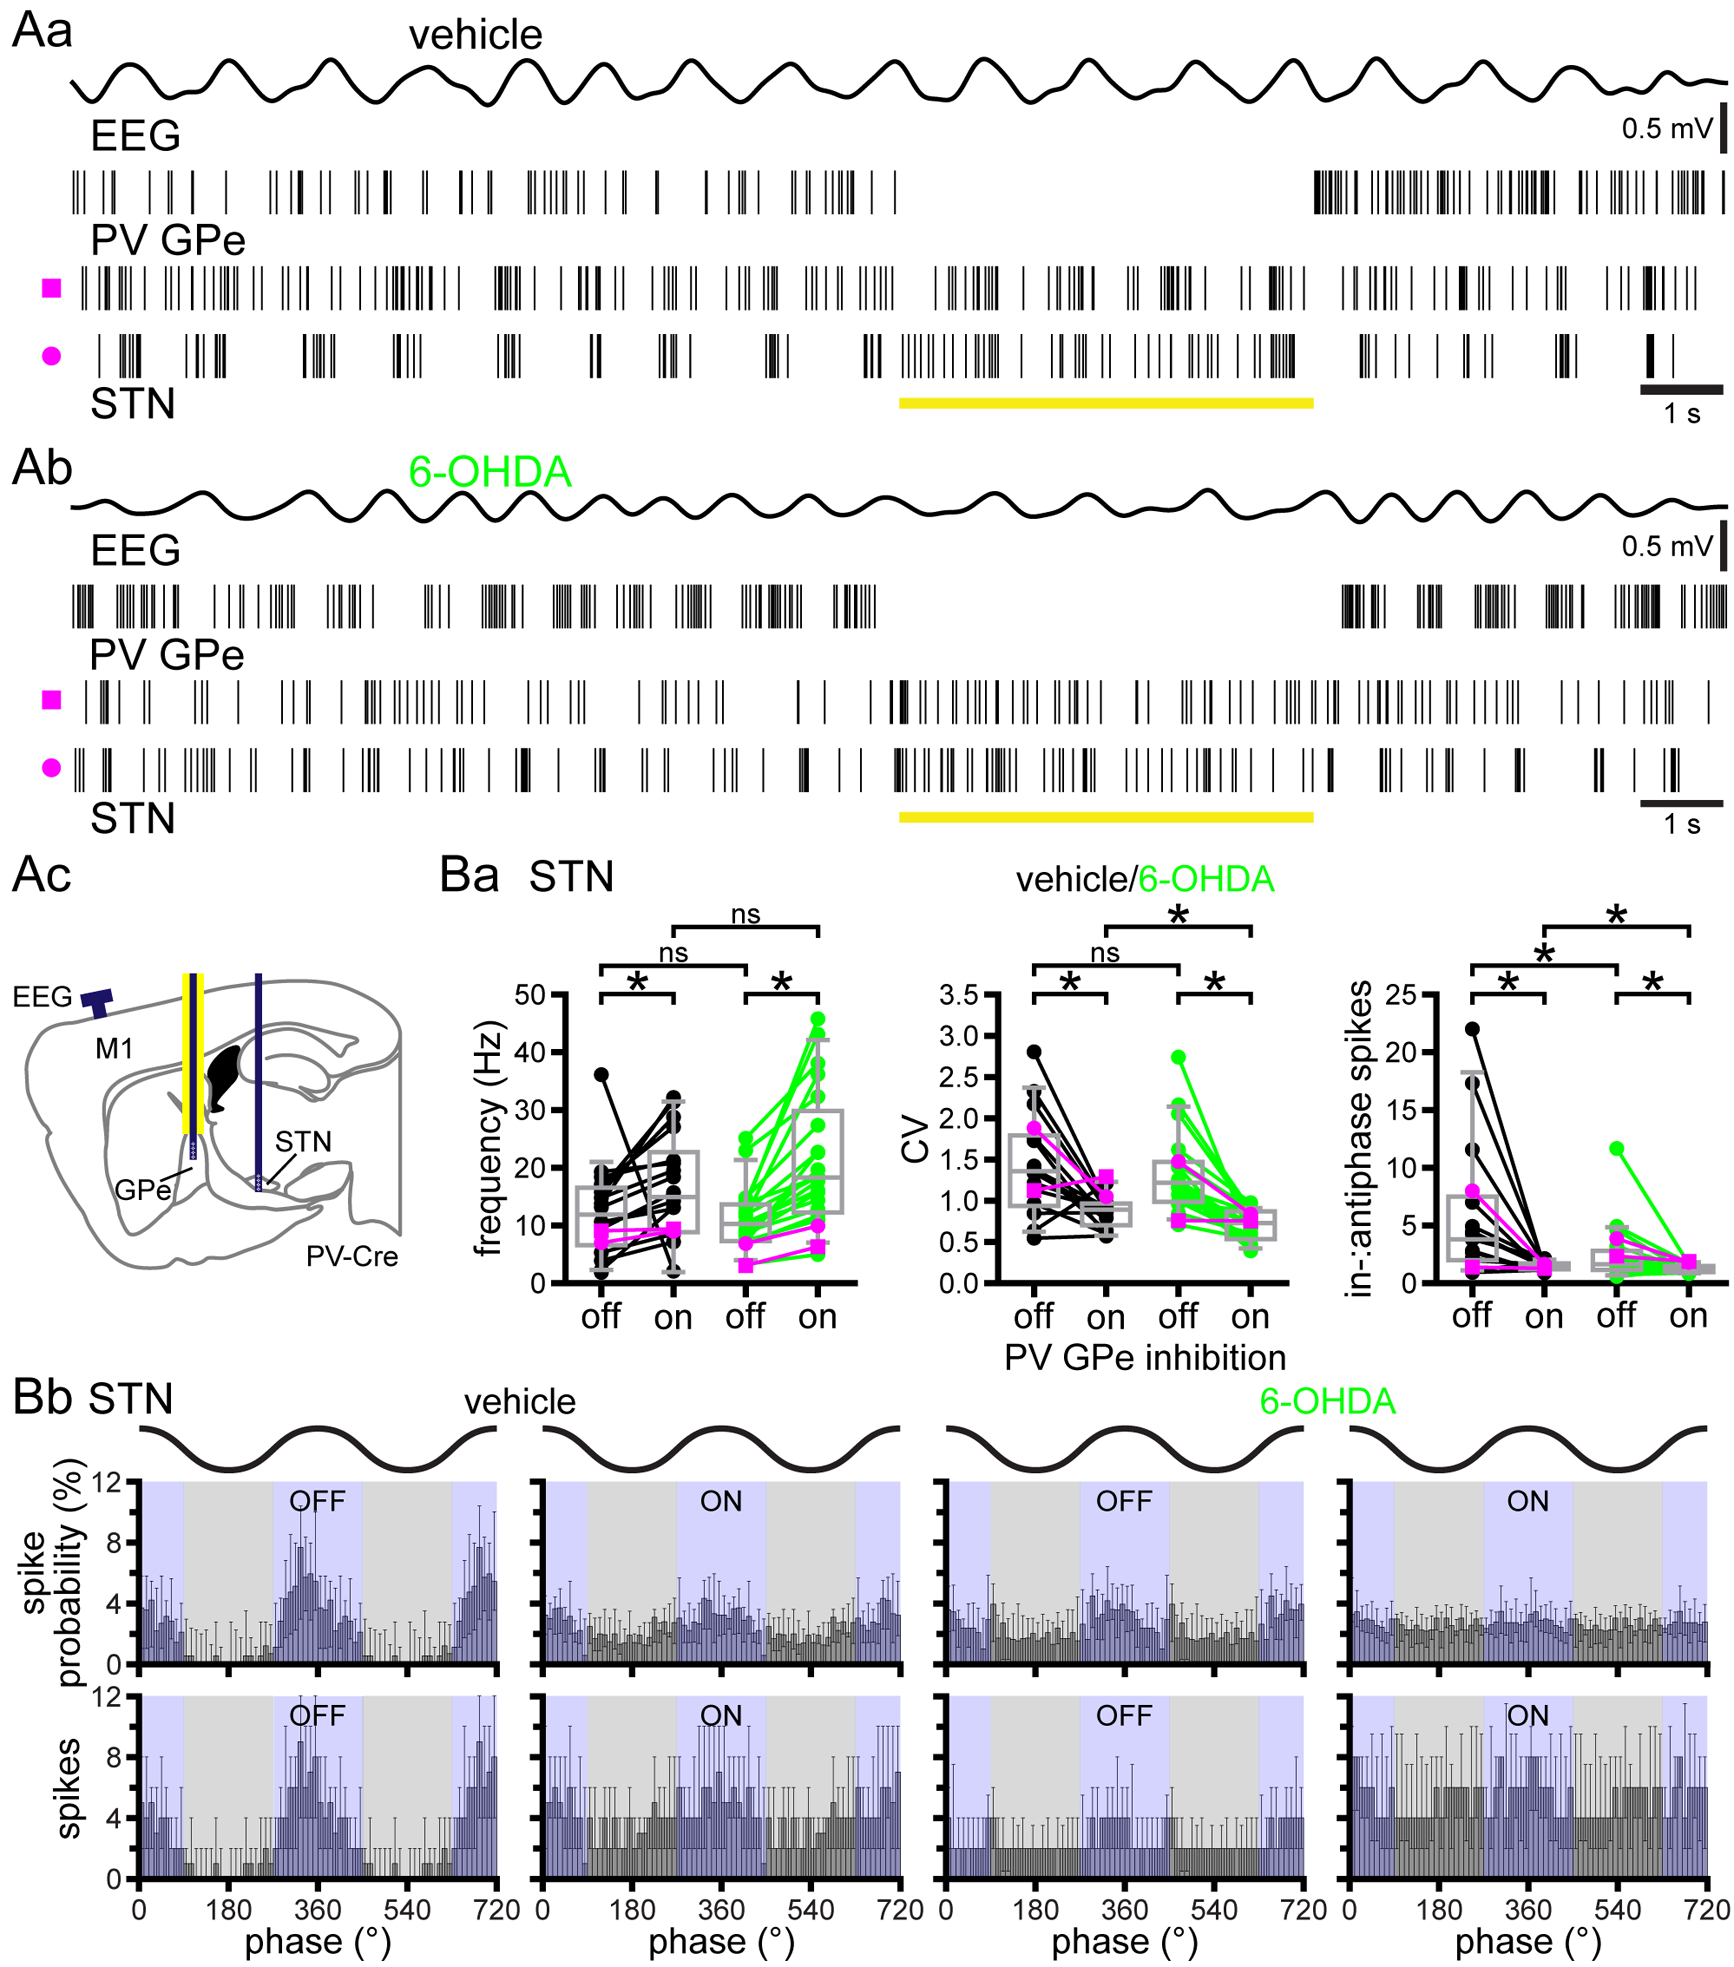
A and B, optogenetic inhibition of PV GPe neurons increased the frequency and regularity of STN activity and reduced the in-:antiphase spike probability of STN neurons (B) in vehicle- (Aa) and 6-OHDA- (Ab) injected PV-cre mice. A, representative examples (Aa and Ab) and schematic representation of optrode and electrode placement (Ac; dark blue line indicates electrode; yellow line denotes affixed optical fiber). Ba, Population data; firing rate (left), CV (middle), and in-:antiphase spikes (right); example data plotted in magenta symbols. Bb, Population linear phase histograms of STN activity relative to cortical SWA in vehicle- (left) and 6-OHDA-injected (right) mice prior to and during optogenetic inhibition of PV GPe neurons. *p < 0.05. ns, not significant.
Inhibition of PV GPe neurons in vehicle- and 6-OHDA-injected mice also reduced STN in-:antiphase spike probability (Fig. 9B; vehicle: laser off = 4.05, 2.02–7.75; laser on = 1.45, 1.19–1.69; n = 16; ph4 = 1.709 × 10⁻³; WSR; 6-OHDA: laser off = 1.64, 1.13–2.80; laser on = 1.17, 0.986–1.50; n = 21; ph3 = 6.453 × 10⁻³; WSR). In 6-OHDA-injected mice, STN neurons also exhibited a reduced in-:antiphase spike probability relative to vehicle-injected controls both before and during optogenetic inhibition of PV GPe neurons (Fig. 9B; vehicle: laser off = 3.8, 1.98–7.50; n = 17; 6-OHDA: laser off = 1.64, 1.13–2.80; n = 21; ph2 = 0.03024; MWU; vehicle: laser on = 1.46, 1.22–1.70; n = 17; 6-OHDA: laser on = 1.17, 0.986–1.50; n = 21; ph1 = 0.04414; MWU). The reduced in-:antiphase spike probability of STN neurons in 6-OHDA mice is consistent with the downregulation of cortico-STN transmission strength in parkinsonian rats (Kita & Kita, 2011a; Wang et al., 2018), mice (Chu et al., 2017), and non-human primates (Mathai et al., 2015). The additional decrease in in-:antiphase STN activity that occurred during optogenetic inhibition of PV GPe neurons in 6-OHDA-injected mice may reflect a reduction in post-inhibitory rebound neuron firing in the STN (Bevan et al., 2002; Baufreton et al., 2005; Hallworth & Bevan, 2005) when phase-offset inhibition from the GPe is suppressed (Mallet et al., 2008b; this study; Mallet et al., 2012). Interestingly, optogenetic inhibition of PV GPe neurons also significantly reduced in-:antiphase STN activity in dopamine-intact mice, arguing GPe-STN inhibition also enhances in-:antiphase STN activity under normal conditions, despite the fact that inhibition was less antiphasic to cortical SWA. Together, these data argue that prototypic PV GPe neurons powerfully regulate the frequency and pattern of postsynaptic STN activity in both dopamine-intact and -depleted mice but their relative effects are difficult to decipher, presumably in part due to adaptive alterations in the intrinsic and synaptic properties of STN neurons (Chu et al., 2015; Mathai et al., 2015; Chu et al., 2017; Wang et al., 2018; McIver et al., 2019).
Loss of dopamine profoundly alters the responses of D2-SPNs and prototypic PV GPe neurons to cortical ACT, whereas STN activity is relatively unaffected
Dopamine depletion profoundly alters the response of the basal ganglia to pinch-evoked cortical ACT in rats (Magill et al., 2001; Mallet et al., 2008a; Mallet et al., 2008b; Mallet et al., 2012; Abdi et al., 2015; Sharott et al., 2017). Consistent with elevated striatopallidal transmission, rat D2-SPNs were hyperactive, GPe neurons were hypoactive, and STN neurons were hyperactive in 6-OHDA-injected rats during this brain state (Magill et al., 2001; Mallet et al., 2008a; Mallet et al., 2008b; Mallet et al., 2012; Abdi et al., 2015; Sharott et al., 2017). In addition, tail pinch-evoked sustained periods of cortical ACT, which were associated with exaggerated beta band activity in dopamine-depleted rats (Mallet et al., 2008b; Mallet et al., 2012). To determine whether parkinsonian mice exhibit similar alterations, we compared the activities of D2-SPNs, PV GPe neurons, and STN neurons in vehicle- and 6-OHDA-injected mice during and following 5-second tail pinch-evoked cortical ACT (Magill et al., 2001). However, prolonged periods of cortical ACT could not be induced in mice without clear signs of inadequate anesthesia. Therefore our study was restricted to the tail-pinch period. The failure to elicit prolonged cortical ACT may explain the absence of exaggerated beta band activity in dopamine-depleted mice (Tables 2 and 3). That said, exaggerated beta band activity has been rarely reported in the cortex or basal ganglia of awake dopamine-depleted mice, arguing that this activity pattern is simply less prominent in this model (Lobb & Jaeger, 2015; Willard et al., 2019b). Prior to tail pinch, the firing rate of D2-SPNs during cortical SWA was elevated in 6-OHDA- versus vehicle-injected mice, as described above (Fig. 10A; vehicle: SWA = 2.5, 1.60–3.40 Hz; n = 34; 6-OHDA: SWA = 3.4, 2.10–7.80; n = 21; ph2 = 0.02476; MWU). In response to cortical ACT, the firing rate of D2-SPNs in vehicle-injected mice decreased (Fig. 10A; vehicle: ACT = 0.300, 0.00–1.35 Hz; n = 34; ph3 = 1.751 × 10⁻³; WSR), whereas in 6-OHDA-injected mice, D2-SPNs maintained their elevated rate of firing (Fig. 10A; 6-OHDA: ACT = 4.00, 2.10–9.60 Hz; n = 21; ph1 = 0.5578; WSR). As a result, the median firing rate of D2-SPNs during tail pinch-evoked cortical ACT was approximately 13 times greater in dopamine-depleted mice (MWU; ph4 = 2.656 × 10⁻⁴).
Figure 10. Effects of tail pinch-evoked cortical ACT on D2-SPNs, PV GPe neurons, and STN neurons in vehicle- and 6-OHDA injected mice.

A, in vehicle-injected, dopamine-intact A2A-cre mice D2-SPN activity decreased during cortical ACT relative to cortical SWA. In 6-OHDA-injected, dopamine-depleted mice D2-SPN activity was similar during cortical SWA and ACT. Thus the firing rate of D2-SPNs during cortical ACT was greater in 6-OHDA-injected mice. B, in vehicle-injected dopamine-intact PV-cre mice PV GPe neuron activity increased during cortical ACT, relative to cortical SWA. In 6-OHDA-injected, dopamine-depleted PV-cre mice, PV GPe neuron activity was suppressed during cortical ACT. C, STN neuron activity significantly increased during cortical ACT relative to SWA in both vehicle- and 6-OHDA-injected mice. The rate of STN activity during cortical ACT was similar in dopamine-intact and -depleted mice. Aa, Ba, and Ca, schematic representations of electrode placement (dark blue line indicates electrode). Ab, Bb, and Cb, representative examples of neuronal activity in D2-SPNs (Ab), PV GPe neurons (Bb), and STN neurons (Cb) in vehicle- (top) and 6-OHDA-injected (bottom) mice; onset of tail pinch denoted by dashed red line. Ac, Bc, and Cc, population firing rate data; examples plotted in magenta. *, p < 0.05; ns, not significant.
In addition, the spiking of D2-SPNs was relatively sustained during cortical ACT compared to cortical SWA-associated firing, as evinced by a reduction in CV in both control and dopamine-depleted mice (vehicle: SWA = 1.53, 1.21–1.78; ACT = 0.935, 0.229–1.29; n = 17; p = 0.0147; WSR; 6-OHDA: SWA = 1.87, 1.35–2.45; ACT = 0.955, 0.737–1.16; n = 18; p = 0.0001; WSR). These data are consistent with a recent study in rats (Sharott et al., 2017) in which the firing of D2-SPNs was elevated in dopamine-depleted rats during prolonged cortical ACT.
Because D2-SPNs were relatively active in 6-OHDA-injected mice during cortical ACT, we hypothesized that the firing of downstream PV GPe neurons would be suppressed. Indeed, dopamine depletion profoundly altered the response of optogenetically identified PV GPe neurons to cortical ACT, consistent with earlier studies in rats (Fig. 10B) (Magill et al., 2001; Mallet et al., 2008a; Mallet et al., 2012; Abdi et al., 2015). In vehicle-injected mice, the firing of PV GPe neurons increased during cortical ACT (Fig. 10B; vehicle: SWA = 15.8, 9.00–42.0 Hz; ACT = 27.2, 18.6–41.0 Hz; n = 23; ph2 = 0.02512; WSR), whereas firing decreased in 6-OHDA-injected mice (Fig. 10B; 6-OHDA: SWA = 15.6, 12.4–19.0 Hz; ACT = 1.8, 0.20–16.0 Hz; n = 15; ph3 = 3.48 × 10⁻³; WSR). As a result, the frequency of PV GPe neuron firing during cortical ACT was considerably lower in dopamine-depleted mice; the median firing rate of PV-GPe neurons in 6-OHDA-injected mice was only 7% of that in vehicle-injected mice (Fig. 10B; ACT: ph4 = 1.31× 10⁻⁵; MWU)
Despite the hugely different firing rates of presynaptic PV GPe neurons, the frequency of downstream STN neuron activity 1) increased during tail pinch-evoked cortical ACT in both vehicle- and 6-OHDA-injected mice; 2) the firing rates of STN neurons during cortical ACT were similar in dopamine-intact and -depleted mice (Fig. 10C; vehicle: SWA = 13.8, 10.0–17.8 Hz; ACT = 18.8, 12.2–23.0; n = 15; ph3 = 0.03552; WSR; 6-OHDA: SWA = 9.60, 6.70–13.3 Hz; ACT = 15.6, 8.6–18.3 Hz; n = 13; ph4 = 0.0371; WSR) (SWA: ph2 = 0.1407; MWU; ACT: ph1 = 0.1589; MWU). These data are in contrast to studies in rats (Magill et al., 2001; Mallet et al., 2008a; Mallet et al., 2012). Thus, in dopamine-depleted mice, the activity of STN neurons during cortical ACT does not reflect the hypoactivity of upstream prototypic PV GPe neurons, presumably due to adaptive changes triggered by the loss of dopamine (Fan et al., 2012; Chu et al., 2015; Mathai et al., 2015; Chu et al., 2017; Wang et al., 2018; McIver et al., 2019).
Discussion
Although brain circuit activity under anesthesia does not recapitulate activity in awake behaving animals, this preparation enabled us to study 1) how dopamine depletion alters basal ganglia activity during multi-second periods of stereotyped cortical activity, which is informative given the emergence of excessively correlated cortico-basal ganglia-thalamocortical activity in PD 2) basal ganglia activity in the absence of movement-associated feedback signals, which given the perturbation of movement kinematics in parkinsonism, restricts the potential sources of abnormal firing. By combining this recording configuration with optogenetic identification and inhibition, we were able to not only measure the activity of specific classes of neuron in the basal ganglia but also to determine how each neuron type influenced its targets.
We demonstrated that during cortical SWA, abnormally antiphasic firing of PV GPe neurons in 6-OHDA-injected mice was dependent in part on D2-SPN activity. Downregulation of autonomous PV GPe neuron firing was not observed following the loss of dopamine, and was therefore not responsible for the emergence of abnormally phasic and irregular PV GPe neuron activity in vivo. Despite the development of cortical SWA-associated, temporally offset activity in the GPe and STN in 6-OHDA-injected mice, the STN did not exhibit elevated firing. Furthermore, STN output opposed rather than facilitated abnormal, cortical SWA-associated GPe activity in 6-OHDA-injected mice. Finally, during cortical ACT in 6-OHDA-injected mice, D2-SPNs exhibited hyperactivity and PV GPe neurons exhibited hypoactivity, while the firing rate of STN neurons was unchanged relative to that in dopamine-intact control mice. Together, these data argue that in dopamine-depleted mice increased striatopallidal patterning is at least in part responsible for abnormal prototypic PV GPe neuron activity, and that despite being disinhibited, the STN does not exhibit hyperactivity, presumably due to cellular and synaptic adaptations triggered by the loss of dopamine.
Our finding that the firing rate D2-SPNs was elevated by approximately 73% and 1,333% during cortical SWA or ACT, respectively, in dopamine-depleted mice relative to controls is consistent with 1) the loss of inhibitory dopaminergic modulation of cortico-D2-SPN transmission and D2-SPN excitability (Gerfen & Surmeier, 2011) 2) D2-SPN hyperactivity in the majority of studies in anesthetized rats (Mallet et al., 2006; Ballion et al., 2009; Sharott et al., 2017) and in immobile mice (Parker et al., 2018; Ryan et al., 2018). Furthermore, if a larger proportion of D2-SPNs are silent in dopamine-intact mice, they would be invisible to electrophysiological detection. Thus, estimates of D2-SPN firing rate under control conditions reported here and in other studies may be relatively inflated. Excessive firing of D2-SPNs in immobile dopamine-depleted mice but not during movement could indicate that movement-associated D2-SPN activity is limited by reduced cortical drive and/or abnormal proprioceptive feedback, despite the best attempts of experimenters to control for these issues. Another possibility is that adaptive alterations in cortico-D2-SPN synaptic transmission and connectivity as well as alterations to the intrinsic excitability of D2-SPNs underlie the reduction of movement-related D2-SPN ensemble activity in dopamine-depleted mice (Day et al., 2006; Mallet et al., 2006; Taverna et al., 2008; Fieblinger et al., 2014; Escande et al., 2016). However, why such homeostatic plasticity would not also limit cortical driving of D2-SPNs during cortical SWA, ACT, or periods of awake immobility currently remains unclear (Parker et al., 2018; Ryan et al., 2018).
Under normal conditions, GPe-STN network activity is largely irregular and de-correlated (Matsumura et al., 1992; Wichmann et al., 1994; Magill et al., 2000; Arkadir et al., 2004; Elias et al., 2007). In PD and its models, GPe and STN neurons exhibit more numerous and robust pauses in firing and/or burst discharge, the occurrence of which may be correlated and coherent with cortical activity (Magill et al., 2001; Walters et al., 2007; Mallet et al., 2008b; Tachibana et al., 2011; Quiroga-Varela et al., 2013; Sanders et al., 2013; Delaville et al., 2015). To determine how abnormal D2-SPN activity affects the GPe-STN network, we first examined the effects of dopamine depletion on PV GPe neurons – a subset of prototypic GPe neurons that represents over half of all GPe neurons, approximately 85% of prototypic GPe neurons, and the vast majority of STN projecting neurons (Abdi et al., 2015; Dodson et al., 2015; Hernandez et al., 2015). We focused on this GPe cell type because we were primarily interested in the impact of the GPe neurons on downstream STN activity. We found that following dopamine depletion, PV GPe neuron firing was relatively antiphasic to cortical SWA, as previously demonstrated in rats (Walters et al., 2007; Zold et al., 2007; Mallet et al., 2008b; Abdi et al., 2015). No accompanying change in firing rate was observed, consistent with the majority of these reports (Walters et al., 2007; Zold et al., 2012; Abdi et al., 2015).
Given the phase offset of GPe neuron activity in dopamine-depleted rats relative to cortical SWA, D2-SPN, and STN activity, D2-SPNs were proposed to be responsible for increased antiphasic GPe neuron activity (Walters et al., 2007; Nevado-Holgado et al., 2014). Consistent with this proposition, pharmacological manipulations such as intrastriatal delivery of the NMDAR antagonist D-APV (Zold et al., 2012) or the GABAAR agonist muscimol (Kita & Kita, 2011b), that suppress striatal activity and output, diminished antiphasic GPe activity. Given that D1-SPNs also provide a substantial collateral projection to the GPe (Kawaguchi et al., 1990; Wu et al., 2000; Fujiyama et al., 2011; Cazorla et al., 2014), it is possible that they also contribute to abnormal GPe activity. However, D1-SPN activity is suppressed in dopamine-depleted mice, arguing that their inhibition of GPe neurons may be less significant than that mediated by D2-SPNs (Mallet et al., 2006; Escande et al., 2016; Parker et al., 2018). Here, we demonstrate that selective optogenetic inhibition of D2-SPNs was sufficient to rapidly and reversibly reduce antiphasic GPe neuron activity in dopamine-depleted mice, in a manner that was precisely time-locked to the 5 second period of optogenetic manipulation. Thus, D2-SPNs are key to the generation of abnormal GPe activity in the dopamine-depleted state (Miguelez et al., 2012; Zold et al., 2012; Escande et al., 2016; Lemos et al., 2016; Parker et al., 2018; Ryan et al., 2018). That said, antiphasic GPe activity was not completely eliminated, possibly because the presynaptic D2-SPN population was only partially inhibited due to the spatially restricted nature of optogenetic stimulation and less than 100 % expression of Arch-GFP in D2-SPNs. PV GPe neurons also exhibited dramatic hypoactivity during cortical ACT in dopamine-depleted mice. This finding is consistent with the hugely elevated and relatively sustained activity of D2-SPNs in this brain state, as reported here and in analogous studies of identified striatopallidal neurons (Sharott et al., 2017) and unidentified (Magill et al., 2001; Mallet et al., 2008) and prototypic (Abdi et al., 2015) GPe neurons in rats. The convergence of large numbers of D2-SPNs onto a much smaller population of GPe neurons suggests that changes in the rate and/or synchrony of D2-SPN activity could greatly affect the patterning of GPe activity. Thus, the 73% and 1333% greater activities of D2-SPNs in 6-OHDA-injected mice versus vehicle-injected control mice during cortical SWA and cortical ACT, respectively, are likely to contribute to the aberrant patterning of the GPe. However, other factors may also be important. Following the loss of dopamine, increased recruitment of D2-SPNs may contribute. Loss of D2 receptor-mediated regulation of D2-SPN transmission probability is another potential major factor, which could greatly influence the activity-dependent dynamics and thus impact of striatopallidal transmission (Chuhma et al., 2011; Miguelez et al., 2012; Lemos et al., 2016; Chazalon et al., 2018). Although, non-selective optogenetic stimulation of striatopallidal inputs did not reveal substantial changes in synaptic properties (Miguelez et al., 2012), it is not yet clear whether dopamine-depletion triggers alterations in D2-SPN inputs to prototypic PV GPe neurons. Finally, inhibitory striatopallidal patterning may be less effectively counteracted by STN excitation, due to reduced cortical driving of STN activity and reduced STN-GPe synaptic transmission following the loss of dopamine (Kita & Kita, 2011a; Mathai et al., 2015; this study; Chu et al., 2017).
Previous studies suggested that dopamine depletion-triggered downregulation of GPe HCN channels causes a reduction in autonomous firing, which leaves GPe neurons more susceptible to entrainment by synaptic inputs (Chan et al., 2011; Shouno et al., 2017). However, another study reported that only Npas1 GPe neurons, the majority of which are arkypallidal neurons that project to the striatum, exhibit downregulated activity (Hernandez et al., 2015). Here, we found that the autonomous activity of PV GPe neurons was significantly upregulated in 6-OHDA-injected mice, consistent with upregulated autonomous and post-inhibitory rebound firing in a subset of unidentified GPe neurons in 6-OHDA-injected rats (Miguelez et al., 2012). Therefore, loss of intrinsic activity cannot contribute to the abnormal phasic interruption of PV GPe neuron firing in dopamine-depleted mice in vivo. The upregulation of autonomous firing in PV GPe neurons presumably represents a homeostatic response to elevated D2-SPN-GPe transmission in dopamine-depleted mice, which may contribute to the maintenance of PV GPe neuron firing rates during cortical SWA. That said, in dopamine-depleted mice upregulated autonomous firing was clearly insufficient to prevent PV GPe neuron hypoactivity during sustained cortical ACT and D2-SPN hyperactivity. The mechanisms underlying the upregulation of autonomous PV GPe neuron firing have yet to be elucidated but could be triggered by alterations in the activation of postsynaptic Cav1 channels that report spiking activity (Chan et al., 2011) or NMDARs that report the strength of synaptic excitation (c.f. McIver et al., 2019).
In urethane-anesthetized rats STN neurons discharge in phase with cortical SWA due to direct cortical excitation (Magill et al., 2000, 2001; Mallet et al., 2008b). Despite the emergence of antiphasic PV GPe neuron activity and disinhibition of STN neurons at the time that they are receiving cortical excitation, the activity of STN neurons was not elevated in dopamine-depleted mice. The mean frequency of STN activity in vehicle- and 6-OHDA-injected mice was similar and the ratio of in phase to antiphase STN activity decreased modestly but significantly in dopamine-depleted mice. A similar picture emerged during cortical ACT, although the frequency of PV GPe neuron activity was dramatically reduced in 6-OHDA-injected mice, the frequency of STN activity was similar in dopamine-intact and -depleted mice. These data are in contrast to some (Magill et al., 2001; Wichmann et al., 2002; Soares et al., 2004; Walters et al., 2007; Mallet et al., 2008b; Tachibana et al., 2011; Delaville et al., 2015; Deffains et al., 2016a) but not other (Ni et al., 2001; Ryu et al., 2011) in vivo recording studies of STN activity in rat and monkey PD models. Why is the STN not hyperactive in parkinsonian mice when the frequency of presynaptic PV GPe neuron firing is reduced (Atherton et al., 2013)? One possible explanation is the engagement of homeostatic synaptic and cellular plasticity triggered by the loss of dopamine. Thus, following degeneration of midbrain dopamine neurons, GPe-STN inputs proliferate (Fan et al., 2012; Chu et al., 2015) and cortico-STN inputs are lost (Mathai et al., 2015; Chu et al., 2017; Wang et al., 2018), leading to an approximately 4-fold reduction in the strength of synaptic excitation versus inhibition in the STN. Furthermore, the autonomous activity of STN neurons is downregulated (McIver et al., 2019). These alterations are NMDAR-dependent and can be generated in dopamine-intact mice through chemogenetic activation of D2-SPNs and subsequent disinhibition of the STN or through application of exogenous NMDA ex vivo (Chu et al., 2015; Chu et al., 2017; McIver et al., 2019). In dopamine-depleted mice, plasticity induced by chemogenetic activation of D2-SPNs is occluded (Chu et al., 2017; McIver et al., 2019). Thus, following the loss of dopamine, enhanced D2-SPN transmission leads to reduced firing of GPe neurons at the same time the STN receives synaptic excitation from hyperdirect pathway cortical inputs, which leads to increased activation of STN NMDARs that in turn triggers compensatory synaptic and cellular adaptations. As a result, the impact of cortical excitation on STN activity is downregulated both ex vivo and in vivo (Kita & Kita, 2011a; Mathai et al., 2015; this study; Chu et al., 2017). It has been suggested that enhanced hyperdirect pathway patterning contributes to oscillatory entrainment of the basal ganglia in PD and its models (Moran et al., 2011; Tachibana et al., 2011; Pavlides et al., 2015) but our results and recent studies that demonstrate that cortico-STN input is strongly downregulated in mice, rats, and monkeys (Kita & Kita, 2011a; Mathai et al., 2015; Chu et al., 2017; Wang et al., 2018), argue against this thesis. Indeed, if hyperdirect cortical input was sufficient to pattern parkinsonian STN activity it should be more apparent during inhibition of PV GPe neurons, but in fact we found the opposite to be the case. In 6-OHDA-injected mice, inhibition of PV GPe neurons almost entirely eliminated phase locking of STN activity to cortical SWA, consistent with the idea that patterning of STN activity by the indirect pathway relative to the hyperdirect pathway is elevated in parkinsonism.
The reciprocally connected GPe-STN network has been suggested to be a generator of pathologically correlated cortico-basal ganglia-thalamocortical activity in PD (Moran et al., 2011; Tachibana et al., 2011; Shouno et al., 2017). Indeed, lesion (Bergman et al., 1990), electrical stimulation (Benabid et al., 2009; Wichmann et al., 2018), pharmacological (Levy et al., 2001; Tachibana et al., 2011), optogenetic (Yoon et al., 2014; Mallet et al., 2019 in press; Mastro et al., 2017), genetic (Chu et al., 2017; Zhuang et al., 2018), and chemogenetic (Assaf & Schiller, 2019; McIver et al., 2019) manipulation of the GPe and/or STN have demonstrated that disrupting their pathological activity can ameliorate motor dysfunction in PD and its models. Interestingly, we found that optogenetic inhibition of STN activity facilitated rather than ameliorated abnormal antiphasic GPe neuron activity during cortical SWA, arguing that STN-GPe transmission opposed the abnormal patterning of the GPe by indirect pathway D2-SPNs in dopamine-depleted mice. Although the rate and pattern of STN activity were not significantly altered by dopamine depletion, the emergence of temporally offset prototypic GPe activity may cause the GPe-STN network to more powerfully synchronize basal ganglia output neurons in PD (Lobb & Jaeger, 2015; Mastro et al., 2017; Willard et al., 2019a). Thus, increased patterning of GPi/SNr could occur through alternating bouts of concurrent 1) GPe inactivity and STN activity, both of which should elevate basal ganglia output; 2) GPe activity and STN inactivity, which should inhibit basal ganglia output. Indeed, manipulations that oppose the patterning of GPe (and STN) neurons by D2-SPNs e.g. optogenetic activation of PV GPe neurons (Mastro et al., 2017), chemogenetic activation of the GPe (Assaf & Schiller, 2019), and chemogenetic and genetic manipulation of the STN (Chu et al., 2017; Zhuang et al., 2018; McIver et al., 2019) ameliorate motor dysfunction in PD models.
Supplementary Material
Key points.
Reciprocally connected GABAergic external globus pallidus (GPe) and glutamatergic subthalamic nucleus (STN) neurons form a key network within the basal ganglia.
In Parkinson’s disease and its models, abnormal rates and patterns of GPe-STN network activity are linked to motor dysfunction.
Using cell class-specific optogenetic identification and inhibition during cortical slow-wave activity and activation, we report that in dopamine-depleted mice 1) D2 dopamine receptor expressing striatal projection neurons (D2-SPNs) discharge at higher rates, especially during cortical activation 2) prototypic parvalbumin-expressing GPe neurons are excessively patterned by D2-SPNs even though their autonomous activity is upregulated 3) despite being disinhibited, STN neurons are not hyperactive 4) STN activity opposes striatopallidal patterning.
These data argue that in parkinsonian mice, abnormal, temporally offset prototypic GPe and STN neuron firing results in part from increased striatopallidal transmission and that compensatory plasticity limits STN hyperactivity and cortical entrainment.
Funding:
This study was funded by NIH NINDS grants 2R37 NS041280, P50 NS047085, 5T32 NS041234 and the French Research National Agency grant ANR-2015-CE37-0006. Confocal imaging work performed at the Northwestern Center for Advanced Microscopy and the University of Bordeaux Imaging Center, supported by NCI CCSG grant P30 CA060553 and the Labex-BRAIN ANR-10-LABX-43 grant.
Footnotes
Competing Interests
The authors declare that no competing interests exist.
References:
- Abbas AI, Sundiang MJM, Henoch B, Morton MP, Bolkan SS, Park AJ, Harris AZ, Kellendonk C & Gordon JA. (2018). Somatostatin interneurons facilitate hippocampal-prefrontal synchrony and prefrontal spatial encoding. Neuron 100, 926–939. [DOI] [PMC free article] [PubMed] [Google Scholar]
- Abdi A, Mallet N, Mohamed FY, Sharott A, Dodson PD, Nakamura KC, Suri S, Avery SV, Larvin JT, Garas FN, Garas SN, Vinciati F, Morin S, Bezard E, Baufreton J & Magill PJ. (2015). Prototypic and arkypallidal neurons in the dopamine-intact external globus pallidus. J Neurosci 35, 6667–6688. [DOI] [PMC free article] [PubMed] [Google Scholar]
- Abecassis ZA, Berceau BL, Win PH, Garcia D, Xenias HS, Cui Q, Pamukcu A, Cherian S, Hernandez VM, Chon U, Lim BK, Kim Y, Justice NJ, Awatramani R, Hooks BM, Gerfen CR, Boca SM & Chan CS. (2020). Npas1(+)-Nkx2.1(+) neurons are an integral part of the cortico-pallido-cortical loop. J Neurosci 40, 743–768. [DOI] [PMC free article] [PubMed] [Google Scholar]
- Adamos DA, Laskaris NA, Kosmidis EK & Theophilidis G. (2010). NASS: an empirical approach to spike sorting with overlap resolution based on a hybrid noise-assisted methodology. J Neurosci Methods 190, 129–142. [DOI] [PubMed] [Google Scholar]
- Albin RL, Young AB & Penney JB. (1989). The functional anatomy of basal ganglia disorders. Trends Neurosci 12, 366–375. [DOI] [PubMed] [Google Scholar]
- Aranha MM, Santos DM, Xavier JM, Low WC, Steer CJ, Sola S & Rodrigues CM. (2010). Apoptosis-associated microRNAs are modulated in mouse, rat and human neural differentiation. BMC Genomics 11, 514. [DOI] [PMC free article] [PubMed] [Google Scholar]
- Arkadir D, Morris G, Vaadia E & Bergman H. (2004). Independent coding of movement direction and reward prediction by single pallidal neurons. J Neurosci 24, 10047–10056. [DOI] [PMC free article] [PubMed] [Google Scholar]
- Aron AR & Poldrack RA. (2006). Cortical and subcortical contributions to stop signal response inhibition: role of the subthalamic nucleus. J Neurosci 26, 2424–2433. [DOI] [PMC free article] [PubMed] [Google Scholar]
- Assaf F & Schiller Y. (2019). A chemogenetic approach for treating experimental Parkinson’s disease. Mov Disord 34, 469–479. [DOI] [PubMed] [Google Scholar]
- Atherton JF, Menard A, Urbain N & Bevan MD. (2013). Short-term depression of external globus pallidus-subthalamic nucleus synaptic transmission and implications for patterning subthalamic activity. J Neurosci 33, 7130–7144. [DOI] [PMC free article] [PubMed] [Google Scholar]
- Ballion B, Frenois F, Zold CL, Chetrit J, Murer MG & Gonon F. (2009). D2 receptor stimulation, but not D1, restores striatal equilibrium in a rat model of parkinsonism. Neurobiol Dis 35, 376–384. [DOI] [PubMed] [Google Scholar]
- Bamford NS, Zhang H, Schmitz Y, Wu NP, Cepeda C, Levine MS, Schmauss C, Zakharenko SS, Zablow L & Sulzer D. (2004). Heterosynaptic dopamine neurotransmission selects sets of corticostriatal terminals. Neuron 42, 653–663. [DOI] [PubMed] [Google Scholar]
- Barbera G, Liang B, Zhang L, Gerfen CR, Culurciello E, Chen R, Li Y & Lin DT. (2016). Spatially compact neural clusters in the dorsal striatum encode locomotion relevant information. Neuron 92, 202–213. [DOI] [PMC free article] [PubMed] [Google Scholar]
- Basco D, Nicchia GP, D’Alessandro A, Zolla L, Svelto M & Frigeri A. (2011). Absence of aquaporin-4 in skeletal muscle alters proteins involved in bioenergetic pathways and calcium handling. PLoS One 6, e19225. [DOI] [PMC free article] [PubMed] [Google Scholar]
- Baufreton J, Atherton JF, Surmeier DJ & Bevan MD. (2005). Enhancement of excitatory synaptic integration by GABAergic inhibition in the subthalamic nucleus. J Neurosci 25, 8505–8517. [DOI] [PMC free article] [PubMed] [Google Scholar]
- Baunez C, Nieoullon A & Amalric M. (1995). In a rat model of parkinsonism, lesions of the subthalamic nucleus reverse increases of reaction time but induce a dramatic premature responding deficit. J Neurosci 15, 6531–6541. [DOI] [PMC free article] [PubMed] [Google Scholar]
- Benabid AL, Chabardes S, Mitrofanis J & Pollak P. (2009). Deep brain stimulation of the subthalamic nucleus for the treatment of Parkinson’s disease. Lancet Neurol 8, 67–81. [DOI] [PubMed] [Google Scholar]
- Bergman H, Wichmann T & DeLong M. (1990). Reversal of experimental parkinsonism by lesions of the subthalamic nucleus. Science 249, 1436–1438. [DOI] [PubMed] [Google Scholar]
- Bergman H, Wichmann T, Karmon B & DeLong MR. (1994). The primate subthalamic nucleus. II. Neuronal activity in the MPTP model of parkinsonism. J Neurophysiol 72, 507–520. [DOI] [PubMed] [Google Scholar]
- Bevan MD, Bolam JP & Crossman AR. (1994). Convergent synaptic input from the neostriatum and the subthalamus onto identified nigrothalamic neurons in the rat. Eur J Neurosci 6, 320–334. [DOI] [PubMed] [Google Scholar]
- Bevan MD, Booth PA, Eaton SA & Bolam JP. (1998). Selective innervation of neostriatal interneurons by a subclass of neuron in the globus pallidus of the rat. J Neurosci 18, 9438–9452. [DOI] [PMC free article] [PubMed] [Google Scholar]
- Bevan MD, Magill PJ, Hallworth NE, Bolam JP & Wilson CJ. (2002). Regulation of the timing and pattern of action potential generation in rat subthalamic neurons in vitro by GABA-A IPSPs. J Neurophysiol 87, 1348–1362. [DOI] [PubMed] [Google Scholar]
- Bokil H, Andrews P, Kulkarni JE, Mehta S & Mitra PP. (2010). Chronux: A platform for analyzing neural signals. J Neurosci Methods 192, 146–151. [DOI] [PMC free article] [PubMed] [Google Scholar]
- Brazhnik E, McCoy AJ, Novikov N, Hatch CE & Walters JR. (2016). Ventral medial thalamic nucleus promotes synchronization of increased high beta oscillatory activity in the basal ganglia-thalamocortical network of the hemiparkinsonian rat. J Neurosci 36, 4196–4208. [DOI] [PMC free article] [PubMed] [Google Scholar]
- Brown P, Oliviero A, Mazzone P, Insola A, Tonali P & Di Lazzaro V. (2001). Dopamine dependency of oscillations between subthalamic nucleus and pallidum in Parkinson’s disease. J Neurosci 21, 1033–1038. [DOI] [PMC free article] [PubMed] [Google Scholar]
- Carvalho Poyraz F, Holzner E, Bailey MR, Meszaros J, Kenney L, Kheirbek MA, Balsam PD & Kellendonk C. (2016). Decreasing striatopallidal pathway function enhances motivation by energizing the initiation of goal-directed action. J Neurosci 36, 5988–6001. [DOI] [PMC free article] [PubMed] [Google Scholar]
- Cazorla M, de Carvalho FD, Chohan MO, Shegda M, Chuhma N, Rayport S, Ahmari SE, Moore H & Kellendonk C. (2014). Dopamine D2 receptors regulate the anatomical and functional balance of basal ganglia circuitry. Neuron 81, 153–164. [DOI] [PMC free article] [PubMed] [Google Scholar]
- Chan CS, Glajch KE, Gertler TS, Guzman JN, Mercer JN, Lewis AS, Goldberg AB, Tkatch T, Shigemoto R, Fleming SM, Chetkovich DM, Osten P, Kita H & Surmeier DJ. (2011). HCN channelopathy in external globus pallidus neurons in models of Parkinson’s disease. Nat Neurosci 14, 85–94. [DOI] [PMC free article] [PubMed] [Google Scholar]
- Chang HT, Wilson CJ & Kitai ST. (1981). Single neostriatal efferent axons in the globus pallidus: a light and electron microscopic study. Science 213, 915–918. [DOI] [PubMed] [Google Scholar]
- Charalampopoulos I, Dermitzaki E, Vardouli L, Tsatsanis C, Stournaras C, Margioris AN & Gravanis A. (2005). Dehydroepiandrosterone sulfate and allopregnanolone directly stimulate catecholamine production via induction of tyrosine hydroxylase and secretion by affecting actin polymerization. Endocrinology 146, 3309–3318. [DOI] [PubMed] [Google Scholar]
- Chazalon M, Paredes-Rodriguez E, Morin S, Martinez A, Cristovao-Ferreira S, Vaz S, Sebastiao A, Panatier A, Boue-Grabot E, Miguelez C & Baufreton J. (2018). GAT-3 dysfunction generates tonic inhibition in external globus pallidus neurons in parkinsonian rodents. Cell Rep 23, 1678–1690. [DOI] [PubMed] [Google Scholar]
- Chiken S & Nambu A. (2016). Mechanism of deep brain stimulation: inhibition, excitation, or disruption? Neuroscientist 22, 313–322. [DOI] [PMC free article] [PubMed] [Google Scholar]
- Cho J, Duke D, Manzino L, Sonsalla PK & West MO. (2002). Dopamine depletion causes fragmented clustering of neurons in the sensorimotor striatum: evidence of lasting reorganization of corticostriatal input. J Comp Neurol 452, 24–37. [DOI] [PubMed] [Google Scholar]
- Chow BY, Han X, Dobry AS, Qian X, Chuong AS, Li M, Henninger MA, Belfort GM, Lin Y, Monahan PE & Boyden ES. (2010). High-performance genetically targetable optical neural silencing by light-driven proton pumps. Nature 463, 98–102. [DOI] [PMC free article] [PubMed] [Google Scholar]
- Chu HY, Atherton JF, Wokosin D, Surmeier DJ & Bevan MD. (2015). Heterosynaptic regulation of external globus pallidus inputs to the subthalamic nucleus by the motor cortex. Neuron 85, 364–376. [DOI] [PMC free article] [PubMed] [Google Scholar]
- Chu HY, McIver EL, Kovaleski RF, Atherton JF & Bevan MD. (2017). Loss of hyperdirect pathway cortico-subthalamic inputs following degeneration of midbrain dopamine neurons. Neuron 95, 1306–1318.e1305. [DOI] [PMC free article] [PubMed] [Google Scholar]
- Chuhma N, Tanaka KF, Hen R & Rayport S. (2011). Functional connectome of the striatal medium spiny neuron. J Neurosci 31, 1183–1192. [DOI] [PMC free article] [PubMed] [Google Scholar]
- Cui G, Jun SB, Jin X, Pham MD, Vogel SS, Lovinger DM & Costa RM. (2013). Concurrent activation of striatal direct and indirect pathways during action initiation. Nature 494, 238–242. [DOI] [PMC free article] [PubMed] [Google Scholar]
- Day M, Wang Z, Ding J, An X, Ingham CA, Shering AF, Wokosin D, Ilijic E, Sun Z, Sampson AR, Mugnaini E, Deutcch AY, Sesack SR, Arbuthnott GW & Surmeier DJ. (2006). Selective elimination of glutamatergic synapses on striatopallidal neurons in Parkinson disease models. Nat Neurosci 9, 251–259. [DOI] [PubMed] [Google Scholar]
- Deffains M, Iskhakova L, Katabi S, Haber SN, Israel Z & Bergman H. (2016a). Subthalamic, not striatal, activity correlates with basal ganglia downstream activity in normal and parkinsonian monkeys. Elife 5. [DOI] [PMC free article] [PubMed] [Google Scholar]
- Deffains M, Iskhakova L, Katabi S, Haber SN, Israel Z & Bergman H. (2016b). Subthalamic, not striatal, activity correlates with basal ganglia downstream activity in normal and parkinsonian monkeys. Elife 5, e16443. [DOI] [PMC free article] [PubMed] [Google Scholar]
- Degos B, Deniau JM, Le Cam J, Mailly P & Maurice N. (2008). Evidence for a direct subthalamo-cortical loop circuit in the rat. Eur J Neurosci 27, 2599–2610. [DOI] [PubMed] [Google Scholar]
- Delaville C, McCoy AJ, Gerber CM, Cruz AV & Walters JR. (2015). Subthalamic nucleus activity in the awake hemiparkinsonian rat: relationships with motor and cognitive networks. J Neurosci 35, 6918–6930. [DOI] [PMC free article] [PubMed] [Google Scholar]
- Devergnas A, Pittard D, Bliwise D & Wichmann T. (2014). Relationship between oscillatory activity in the cortico-basal ganglia network and parkinsonism in MPTP-treated monkeys. Neurobiol Dis 68, 156–166. [DOI] [PMC free article] [PubMed] [Google Scholar]
- Dodson PD, Larvin JT, Duffell JM, Garas FN, Doig NM, Kessaris N, Duguid IC, Bogacz R, Butt SJB & Magill PJ. (2015). Distinct developmental origins manifest in the specialized encoding of movement by adult neurons of the external globus pallidus. Neuron 86, 501–513. [DOI] [PMC free article] [PubMed] [Google Scholar]
- Elias S, Joshua M, Goldberg JA, Heimer G, Arkadir D, Morris G & Bergman H. (2007). Statistical properties of pauses of the high-frequency discharge neurons in the external segment of the globus pallidus. J Neurosci 27, 2525–2538. [DOI] [PMC free article] [PubMed] [Google Scholar]
- Engel AK & Fries P. (2010). Beta-band oscillations — signalling the status quo? Curr Opin Neurobiol 20, 156–165. [DOI] [PubMed] [Google Scholar]
- Escande MV, Taravini IR, Zold CL, Belforte JE & Murer MG. (2016). Loss of homeostasis in the direct pathway in a mouse model of asymptomatic Parkinson’s disease. J Neurosci 36, 5686–5698. [DOI] [PMC free article] [PubMed] [Google Scholar]
- Eusebio A, Cagnan H & Brown P. (2012). Does suppression of oscillatory synchronisation mediate some of the therapeutic effects of DBS in patients with Parkinson’s disease? Front Integr Neurosci 6, 47. [DOI] [PMC free article] [PubMed] [Google Scholar]
- Fan KY, Baufreton J, Surmeier DJ, Chan CS & Bevan MD. (2012). Proliferation of external globus pallidus-subthalamic nucleus synapses following degeneration of midbrain dopamine neurons. J Neurosci 32, 13718–13728. [DOI] [PMC free article] [PubMed] [Google Scholar]
- Fieblinger T, Graves SM, Sebel LE, Alcacer C, Plotkin JL, Gertler TS, Chan CS, Heiman M, Greengard P, Cenci MA & Surmeier DJ. (2014). Cell type-specific plasticity of striatal projection neurons in parkinsonism and L-DOPA-induced dyskinesia. Nat Commun 5, 5316. [DOI] [PMC free article] [PubMed] [Google Scholar]
- Frank MJ, Seeberger LC & O’Reilly RC. (2004). By carrot or by stick: cognitive reinforcement learning in parkinsonism. Science 306, 1940–1943. [DOI] [PubMed] [Google Scholar]
- Fu L, Shi Z, Luo G, Tu W, Wang X, Fang Z & Li X. (2014). Multiple microRNAs regulate human FOXP2 gene expression by targeting sequences in its 3’ untranslated region. Mol Brain 7, 71. [DOI] [PMC free article] [PubMed] [Google Scholar]
- Fujiyama F, Sohn J, Nakano T, Furuta T, Nakamura KC, Matsuda W & Kaneko T. (2011). Exclusive and common targets of neostriatofugal projections of rat striosome neurons: a single neuron-tracing study using a viral vector. Eur J Neurosci 33, 668–677. [DOI] [PubMed] [Google Scholar]
- Gerfen CR, Engber TM, Mahan LC, Susel Z, Chase TN, Monsma FJ & Sibley DR. (1990). D1 and D2 dopamine receptor regulated gene expression of striatonigral and striatopallidal neurons. Science 250, 1429–1432. [DOI] [PubMed] [Google Scholar]
- Gerfen CR & Surmeier DJ. (2011). Modulation of striatal projection systems by dopamine. Annu Rev Neurosci 34, 441–466. [DOI] [PMC free article] [PubMed] [Google Scholar]
- Gittis AH, Hang GB, LaDow ES, Shoenfeld LR, Atallah BV, Finkbeiner S & Kreitzer AC. (2011). Rapid target-specific remodeling of fast-spiking inhibitory circuits after loss of dopamine. Neuron 71, 858–868. [DOI] [PMC free article] [PubMed] [Google Scholar]
- Goldberg Ja, Boraud T, Maraton S, Haber SN, Vaadia E & Bergman H. (2002). Enhanced synchrony among primary motor cortex neurons in the 1-methyl-4-phenyl-1,2,3,6-tetrahydropyridine primate model of Parkinson’s disease. J Neurosci 22, 4639–4653. [DOI] [PMC free article] [PubMed] [Google Scholar]
- Hallworth NE & Bevan MD. (2005). Globus pallidus neurons dynamically regulate the activity pattern of subthalamic nucleus neurons through the frequency-dependent activation of postsynaptic GABAA and GABAB receptors. J Neurosci 25, 6304–6315. [DOI] [PMC free article] [PubMed] [Google Scholar]
- Hammond C, Bergman H & Brown P. (2007). Pathological synchronization in Parkinson’s disease: networks, models and treatments. Trends Neurosci 30, 357–364. [DOI] [PubMed] [Google Scholar]
- Hazrati LN & Parent A. (1992). The striatopallidal projection displays a high degree of anatomical specificity in the primate. Brain Res 592, 213–227. [DOI] [PubMed] [Google Scholar]
- Hedreen JC & DeLong MR. (1991). Organization of striatopallidal, striatonigral, and nigrostriatal projections in the macaque. J Comp Neurol 304, 569–595. [DOI] [PubMed] [Google Scholar]
- Heimer G, Bar-Gad I, Goldberg JA & Bergman H. (2002). Dopamine replacement therapy reverses abnormal synchronization of pallidal neurons in the 1-methyl-4-phenyl-1,2,3,6-tetrahydropyridine primate model of parkinsonism. J Neurosci 22, 7850–7855. [DOI] [PMC free article] [PubMed] [Google Scholar]
- Hernandez VM, Hegeman DJ, Cui Q, Kelver DA, Fiske MP, Glajch KE, Pitt JE, Huang TY, Justice NJ & Chan CS. (2015). Parvalbumin+ neurons and Npas1+ neurons are distinct neuron classes in the mouse external globus pallidus. J Neurosci 35, 11830–11847. [DOI] [PMC free article] [PubMed] [Google Scholar]
- Higley MJ & Sabatini BL. (2010). Competitive regulation of synaptic Ca2+ influx by D2 dopamine and A2A adenosine receptors. Nat Neurosci 13, 958–966. [DOI] [PMC free article] [PubMed] [Google Scholar]
- Holgado AJ, Terry JR & Bogacz R. (2010). Conditions for the generation of beta oscillations in the subthalamic nucleus-globus pallidus network. J Neurosci 30, 12340–12352. [DOI] [PMC free article] [PubMed] [Google Scholar]
- Holm S. (1997). A Simple Sequentially Rejective Multiple Test Procedure. Scandinavian Journal of Statistics 6, 65–70. [Google Scholar]
- Isoda M & Hikosaka O. (2008). Role for subthalamic nucleus neurons in switching from automatic to controlled eye movement. J Neurosci 28, 7209–7218. [DOI] [PMC free article] [PubMed] [Google Scholar]
- Jahanshahi M, Obeso I, Rothwell JC & Obeso JA. (2015). A fronto-striato-subthalamic-pallidal network for goal-directed and habitual inhibition. Nat Rev Neurosci 16, 719–732. [DOI] [PubMed] [Google Scholar]
- Kawaguchi Y, Wilson CJ & Emson PC. (1990). Projection subtypes of rat neostriatal matrix cells revealed by intracellular injection of biocytin. J Neurosci 10, 3421–3438. [DOI] [PMC free article] [PubMed] [Google Scholar]
- Keeler JF, Pretsell DO & Robbins TW. (2014). Functional implications of dopamine D1 vs. D2 receptors: A ‘prepare and select’ model of the striatal direct vs. indirect pathways. Neuroscience 282, 156–175. [DOI] [PubMed] [Google Scholar]
- Ketzef M, Spigolon G, Johansson Y, Bonito-Oliva A, Fisone G & Silberberg G. (2017). Dopamine depletion impairs bilateral sensory processing in the striatum in a pathway-dependent manner. Neuron 94, 855–865. [DOI] [PubMed] [Google Scholar]
- Kita H & Kita T. (2011a). Cortical stimulation evokes abnormal responses in the dopamine-depleted rat basal ganglia. J Neurosci 31, 10311–10322. [DOI] [PMC free article] [PubMed] [Google Scholar]
- Kita H & Kita T. (2011b). Role of striatum in the pause and burst generation in the globus pallidus of 6-OHDA-treated rats. Front Syst Neurosci 5, 42. [DOI] [PMC free article] [PubMed] [Google Scholar]
- Kita T & Kita H. (2012). The subthalamic nucleus is one of multiple innervation sites for long-range corticofugal axons: a single-axon tracing study in the rat. J Neurosci 32, 5990–5999. [DOI] [PMC free article] [PubMed] [Google Scholar]
- Klaus A, Alves da Silva J & Costa RM. (2019). What, if, and when to move: basal ganglia circuits and self-paced action initiation. Annu Rev Neurosci 42, 459–483. [DOI] [PubMed] [Google Scholar]
- Kotzadimitriou D, Nissen W, Paizs M, Newton K, Harrison PJ, Paulsen O & Lamsa K. (2018). Neuregulin 1 Type I Overexpression Is Associated with Reduced NMDA Receptor-Mediated Synaptic Signaling in Hippocampal Interneurons Expressing PV or CCK. eNeuro 5, ENEURO.0418–0417.2018. [DOI] [PMC free article] [PubMed] [Google Scholar]
- Kravitz AV, Freeze BS, Parker PR, Kay K, Thwin MT, Deisseroth K & Kreitzer AC. (2010). Regulation of parkinsonian motor behaviours by optogenetic control of basal ganglia circuitry. Nature 466, 622–626. [DOI] [PMC free article] [PubMed] [Google Scholar]
- Kuhn AA, Tsui A, Aziz T, Ray N, Brucke C, Kupsch A, Schneider GH & Brown P. (2009). Pathological synchronisation in the subthalamic nucleus of patients with Parkinson’s disease relates to both bradykinesia and rigidity. Exp Neurol 215, 380–387. [DOI] [PubMed] [Google Scholar]
- Lambot L, Chaves Rodriguez E, Houtteman D, Li Y, Schiffmann SN, Gall D & de Kerchove d’Exaerde A. (2016). Striatopallidal neuron NMDA receptors control synaptic connectivity, locomotor, and goal-directed behaviors. J Neurosci 36, 4976–4992. [DOI] [PMC free article] [PubMed] [Google Scholar]
- Le Van Quyen M, Foucher J, Lachaux J, Rodriguez E, Lutz A, Martinerie J & Varela FJ. (2001). Comparison of Hilbert transform and wavelet methods for the analysis of neuronal synchrony. J Neurosci Methods 111, 83–98. [DOI] [PubMed] [Google Scholar]
- LeBlanc KH, London TD, Szczot I, Bocarsly ME, Friend DM, Nguyen KP, Mengesha MM, Rubinstein M, Alvarez VA & Kravitz AV. (2018). Striatopallidal neurons control avoidance behavior in exploratory tasks. Mol Psychiatry. [DOI] [PMC free article] [PubMed] [Google Scholar]
- Leblois A, Boraud T, Meissner W, Bergman H & Hansel D. (2006). Competition between feedback loops underlies normal and pathological dynamics in the basal ganglia. J Neurosci 26, 3567–3583. [DOI] [PMC free article] [PubMed] [Google Scholar]
- Lemos JC, Friend DM, Kaplan AR, Shin JH, Rubinstein M, Kravitz AV & Alvarez VA. (2016). Enhanced GABA transmission drives bradykinesia following loss of dopamine D2 receptor signaling. Neuron 90, 824–838. [DOI] [PMC free article] [PubMed] [Google Scholar]
- Levy R, Lang AE, Dostrovsky JO, Pahapill P, Romas J, Saint-Cyr J, Hutchison WD & Lozano AM. (2001). Lidocaine and muscimol microinjections in subthalamic nucleus reverse parkinsonian symptoms. Brain 124, 2105–2118. [DOI] [PubMed] [Google Scholar]
- Lobb CJ & Jaeger D. (2015). Bursting activity of substantia nigra pars reticulata neurons in mouse parkinsonism in awake and anesthetized states. Neurobiol Dis 75, 177–185. [DOI] [PMC free article] [PubMed] [Google Scholar]
- Lu Y, Zhong C, Wang L, Wei P, He W, Huang K, Zhang Y, Zhan Y, Feng G & Wang L. (2016). Optogenetic dissection of ictal propagation in the hippocampal-entorhinal cortex structures. Nat Commun 7, 10962. [DOI] [PMC free article] [PubMed] [Google Scholar]
- Maccione A, Gandolfo M, Massobrio P, Novellino A, Martinoia S & Chiappalone M. (2009). A novel algorithm for precise identification of spikes in extracellularly recorded neuronal signals. J Neurosci Methods 177, 241–249. [DOI] [PubMed] [Google Scholar]
- Magill PJ, Bolam JP & Bevan MD. (2000). Relationship of activity in the subthalamic nucleus-globus pallidus network to cortical electroencephalogram. J Neurosci 20, 820–833. [DOI] [PMC free article] [PubMed] [Google Scholar]
- Magill PJ, Bolam JP & Bevan MD. (2001). Dopamine regulates the impact of the cerebral cortex on the subthalamic nucleus-globus pallidus network. Neuroscience 106, 313–330. [DOI] [PubMed] [Google Scholar]
- Mallet N, Ballion B, Le Moine C & Gonon F. (2006). Cortical inputs and GABA interneurons imbalance projection neurons in the striatum of parkinsonian rats. J Neurosci 26, 3875–3884. [DOI] [PMC free article] [PubMed] [Google Scholar]
- Mallet N, Micklem BR, Henny P, Brown MT, Williams C, Bolam JP, Nakamura KC & Magill PJ. (2012). Dichotomous organization of the external globus pallidus. Neuron 74, 1075–1086. [DOI] [PMC free article] [PubMed] [Google Scholar]
- Mallet N, Pogosyan A, Marton LF, Bolam JP, Brown P & Magill PJ. (2008a). Parkinsonian beta oscillations in the external globus pallidus and their relationship with subthalamic nucleus activity. J Neurosci 28, 14245–14258. [DOI] [PMC free article] [PubMed] [Google Scholar]
- Mallet N, Pogosyan A, Sharott A, Csicsvari J, Bolam JP, Brown P & Magill PJ. (2008b). Disrupted dopamine transmission and the emergence of exaggerated beta oscillations in subthalamic nucleus and cerebral cortex. J Neurosci 28, 4795–4806. [DOI] [PMC free article] [PubMed] [Google Scholar]
- Markowitz JE, Gillis WF, Beron CC, Neufeld SQ, Robertson K, Bhagat ND, Peterson RE, Peterson E, Hyun M, Linderman SW, Sabatini BL & Datta SR. (2018). The striatum organizes 3D behavior via moment-to-moment action selection. Cell 174, 44–58. [DOI] [PMC free article] [PubMed] [Google Scholar]
- Mastro KJ, Bouchard RS, Holt HAK & Gittis AH. (2014). Transgenic mouse lines subdivide external segment of the globus pallidus (GPe) neurons and reveal distinct GPe output pathways. J Neurosci 34, 2087–2099. [DOI] [PMC free article] [PubMed] [Google Scholar]
- Mastro KJ, Zitelli KT, Willard AM, Leblanc KH, Kravitz AV & Gittis AH. (2017). Cell-specific pallidal intervention induces long-lasting motor recovery in dopamine-depleted mice. Nat Neurosci 20, 815–823. [DOI] [PMC free article] [PubMed] [Google Scholar]
- Mathai A, Ma Y, Pare JF, Villalba RM, Wichmann T & Smith Y. (2015). Reduced cortical innervation of the subthalamic nucleus in MPTP-treated parkinsonian monkeys. Brain 138, 946–962. [DOI] [PMC free article] [PubMed] [Google Scholar]
- Matsumura M, Kojima J, Gardiner TW & Hikosaka O. (1992). Visual and oculomotor functions of monkey subthalamic nucleus. J Neurophysiol 67, 1615–1632. [DOI] [PubMed] [Google Scholar]
- Maurice N, Deniau JM, Glowinski J & Thierry AM. (1999). Relationships between the prefrontal cortex and the basal ganglia in the rat: physiology of the cortico-nigral circuits. J Neurosci 19, 4674–4681. [DOI] [PMC free article] [PubMed] [Google Scholar]
- McConnell GC, So RQ, Hilliard JD, Lopomo P & Grill WM. (2012). Effective deep brain stimulation suppresses low-frequency network oscillations in the basal ganglia by regularizing neural firing patterns. J Neurosci 32, 15657–15668. [DOI] [PMC free article] [PubMed] [Google Scholar]
- McGregor MM & Nelson AB. (2019). Circuit mechanisms of Parkinson’s disease. Neuron 101, 1042–1056. [DOI] [PubMed] [Google Scholar]
- McIver EL, Atherton JF, Chu HY, Cosgrove KE, Kondapalli J, Wokosin D, Surmeier DJ & Bevan MD. (2019). Maladaptive downregulation of autonomous subthalamic nucleus activity following the loss of midbrain dopamine neurons. Cell Reports 28, 992–1002. [DOI] [PMC free article] [PubMed] [Google Scholar]
- Miguelez C, Morin S, Martinez A, Goillandeau M, Bezard E, Bioulac B & Baufreton J. (2012). Altered pallido-pallidal synaptic transmission leads to aberrant firing of globus pallidus neurons in a rat model of Parkinson’s disease. J Physiol 590, 5861–5875. [DOI] [PMC free article] [PubMed] [Google Scholar]
- Mink JW & Thach WT. (1993). Basal ganglia intrinsic circuits and their role in behavior. Curr Opin Neurobiol 3, 950–957. [DOI] [PubMed] [Google Scholar]
- Moran RJ, Mallet N, Litvak V, Dolan RJ, Magill PJ, Friston KJ & Brown P. (2011). Alterations in brain connectivity underlying beta oscillations in parkinsonism. PLoS Comp Biol 7. [DOI] [PMC free article] [PubMed] [Google Scholar]
- Nambu A. (2011). Somatotopic organization of the primate basal banglia. Front Neuroanat 5, 26. [DOI] [PMC free article] [PubMed] [Google Scholar]
- Nambu A, Takada M, Inase M & Tokuno H. (1996). Dual somatotopical representations in the primate subthalamic nucleus: evidence for ordered but reversed body-map transformations from the primary motor cortex and the supplementary motor area. J Neurosci 16, 2671–2683. [DOI] [PMC free article] [PubMed] [Google Scholar]
- Nambu A, Tokuno H & Takada M. (2002). Functional significance of the cortico-subthalamo-pallidal ‘hyperdirect’ pathway. Neurosci Res 43, 111–117. [DOI] [PubMed] [Google Scholar]
- Nelson AB & Kreitzer AC. (2014). Reassessing models of basal ganglia function and dysfunction. Annu Rev Neurosci 37, 117–135. [DOI] [PMC free article] [PubMed] [Google Scholar]
- Nevado-Holgado AJ, Mallet N, Magill PJ & Bogacz R. (2014). Effective connectivity of the subthalamic nucleus-globus pallidus network during Parkinsonian oscillations. J Physiol 592, 1429–1455. [DOI] [PMC free article] [PubMed] [Google Scholar]
- Ni ZG, Bouali-Benazzouz R, Gao DM, Benabid AL & Benazzouz A. (2001). Time-course of changes in firing rates and firing patterns of subthalamic nucleus neuronal activity after 6-OHDA-induced dopamine depletion in rats. Brain Res 899, 142–147. [DOI] [PubMed] [Google Scholar]
- Noether GE. (1987). Sample size determination for some common nonparametric tests. J Am Stat Assoc 82, 645–647. [Google Scholar]
- Nogueira LT, Costa DV, Gomes AS, Martins CS, Silva AM, Coelho-Aguiar JM, Castelucci P, Lima-Junior RC, Leitao RF, Moura-Neto V & Brito GA. (2017). The involvement of mast cells in the irinotecan-induced enteric neurons loss and reactive gliosis. J Neuroinflammation 14, 79. [DOI] [PMC free article] [PubMed] [Google Scholar]
- Parker JG, Marshall JD, Ahanonu B, Wu YW, Kim TH, Grewe BF, Zhang Y, Li JZ, Ding JB, Ehlers MD & Schnitzer MJ. (2018). Diametric neural ensemble dynamics in parkinsonian and dyskinetic states. Nature 557, 177–182. [DOI] [PMC free article] [PubMed] [Google Scholar]
- Pavlides A, Hogan SJ & Bogacz R. (2015). Computational models describing possible mechanisms for generation of excessive beta oscillations in Parkinson’s disease. PLoS Comp Biol 11, e1004609. [DOI] [PMC free article] [PubMed] [Google Scholar]
- Paxinos G & Franklin KBJ. (2001). The Mouse Brain in Stereotaxic Coordinates (2nd Edition). Academic Press, London. [Google Scholar]
- Peng X, Tehranian R, Dietrich P, Stefanis L & Perez RG. (2005). Alpha-synuclein activation of protein phosphatase 2A reduces tyrosine hydroxylase phosphorylation in dopaminergic cells. J Cell Sci 118, 3523–3530. [DOI] [PubMed] [Google Scholar]
- Pessiglione M, Guehl D, Rolland AS, Francois C, Hirsch EC, Feger J & Tremblay L. (2005). Thalamic neuronal activity in dopamine-depleted primates: evidence for a loss of functional segregation within basal ganglia circuits. J Neurosci 25, 1523–1531. [DOI] [PMC free article] [PubMed] [Google Scholar]
- Planert H, Berger TK & Silberberg G. (2013). Membrane properties of striatal direct and indirect pathway neurons in mouse and rat slices and their modulation by dopamine. PLoS One 8, e57054. [DOI] [PMC free article] [PubMed] [Google Scholar]
- Plenz D & Kital ST. (1999). A basal ganglia pacemaker formed by the subthalamic nucleus and external globus pallidus. Nature 400, 677–682. [DOI] [PubMed] [Google Scholar]
- Quiroga-Varela A, Walters JR, Brazhnik E, Marin C & Obeso JA. (2013). What basal ganglia changes underlie the parkinsonian state? The significance of neuronal oscillatory activity. Neurobiol Dis 58, 242–248. [DOI] [PMC free article] [PubMed] [Google Scholar]
- Redgrave P, Rodriguez M, Smith Y, Rodriguez-Oroz MC, Lehericy S, Bergman H, Agid Y, DeLong MR & Obeso JA. (2010). Goal-directed and habitual control in the basal ganglia: implications for Parkinson’s disease. Nat Rev Neurosci 11, 760–772. [DOI] [PMC free article] [PubMed] [Google Scholar]
- Ryan MB, Bair-Marshall C & Nelson AB. (2018). Aberrant striatal activity in parkinsonism and levodopa-induced dyskinesia. Cell Reports 23, 3438–3446 e3435. [DOI] [PMC free article] [PubMed] [Google Scholar]
- Ryu SB, Bae EK, Hwang YS, Lee HJ, Im CK, Chang JW, Shin HC & Kim KH. (2011). A quantitative comparison of basal ganglia neuronal activities of normal and Parkinson’s disease model rats. Neurosci Lett 505, 113–118. [DOI] [PubMed] [Google Scholar]
- Sanders TH, Clements MA & Wichmann T. (2013). Parkinsonism-related features of neuronal discharge in primates. J Neurophysiol 110, 720–731. [DOI] [PMC free article] [PubMed] [Google Scholar]
- Saunders A, Huang KW & Sabatini BL. (2016). Globus pallidus externus neurons expressing parvalbumin interconnect the subthalamic nucleus and striatal interneurons. PLoS One 11, e0149798. [DOI] [PMC free article] [PubMed] [Google Scholar]
- Schmidt R, Leventhal DK, Mallet N, Chen F & Berke JD. (2013). Canceling actions involves a race between basal ganglia pathways. Nat Neurosci 16, 1118–1124. [DOI] [PMC free article] [PubMed] [Google Scholar]
- Sharott A, Gulberti A, Zittel S, Tudor Jones AA, Fickel U, Munchau A, Koppen JA, Gerloff C, Westphal M, Buhmann C, Hamel W, Engel AK & Moll CK. (2014). Activity parameters of subthalamic nucleus neurons selectively predict motor symptom severity in Parkinson’s disease. J Neurosci 34, 6273–6285. [DOI] [PMC free article] [PubMed] [Google Scholar]
- Sharott A, Magill PJ, Harnack D, Kupsch A, Meissner W & Brown P. (2005). Dopamine depletion increases the power and coherence of beta-oscillations in the cerebral cortex and subthalamic nucleus of the awake rat. Eur J Neurosci 21, 1413–1422. [DOI] [PubMed] [Google Scholar]
- Sharott A, Vinciati F, Nakamura KC & Magill PJ. (2017). A population of indirect pathway striatal projection neurons is selectively entrained to parkinsonian beta oscillations. J Neurosci 37, 9977–9998. [DOI] [PMC free article] [PubMed] [Google Scholar]
- Shink E, Bevan MD, Bolam JP & Smith Y. (1996). The subthalamic nucleus and the external pallidum: Two tightly interconnected structures that control the output of the basal ganglia in the monkey. Neuroscience 73, 335–357. [DOI] [PubMed] [Google Scholar]
- Shouno O, Tachibana Y, Nambu A & Doya K. (2017). Computational model of recurrent subthalamo-pallidal circuit for generation of parkinsonian oscillations. Front Neuroanat 11, 21. [DOI] [PMC free article] [PubMed] [Google Scholar]
- Siapas AG, Lubenov EV & Wilson MA. (2005). Prefrontal phase locking to hippocampal theta oscillations. Neuron 46, 141–151. [DOI] [PubMed] [Google Scholar]
- Sippy T, Lapray D, Crochet S & Petersen CC. (2015). Cell-type-specific sensorimotor processing in striatal projection neurons during goal-directed behavior. Neuron 88, 298–305. [DOI] [PMC free article] [PubMed] [Google Scholar]
- Smith Y, Bevan MD, Shink E & Bolam JP. (1998). Microcircuitry of the direct and indirect pathways of the basal ganglia. Neuroscience 86, 353–387. [DOI] [PubMed] [Google Scholar]
- Soares J, Kliem MA, Betarbet R, Greenamyre JT, Yamamoto B & Wichmann T. (2004). Role of external pallidal segment in primate parkinsonism: comparison of the effects of 1-methyl-4-phenyl-1,2,3,6-tetrahydropyridine-induced parkinsonism and lesions of the external pallidal segment. J Neurosci 24, 6417–6426. [DOI] [PMC free article] [PubMed] [Google Scholar]
- Steriade M. (2000). Corticothalamic resonance, states of vigilance and mentation. Neuroscience 101, 243–276. [DOI] [PubMed] [Google Scholar]
- Tachibana Y, Iwamuro H, Kita H, Takada M & Nambu A. (2011). Subthalamo-pallidal interactions underlying parkinsonian neuronal oscillations in the primate basal ganglia. Eur J Neurosci 34, 1470–1484. [DOI] [PubMed] [Google Scholar]
- Tachibana Y, Kita H, Chiken S, Takada M & Nambu A. (2008). Motor cortical control of internal pallidal activity through glutamatergic and GABAergic inputs in awake monkeys. Eur J Neurosci 27, 238–253. [DOI] [PubMed] [Google Scholar]
- Taverna S, Ilijic E & Surmeier DJ. (2008). Recurrent collateral connections of striatal medium spiny neurons are disrupted in models of Parkinson’s disease. J Neurosci 28, 5504–5512. [DOI] [PMC free article] [PubMed] [Google Scholar]
- Tecuapetla F, Jin X, Lima SQ & Costa RM. (2016). Complementary contributions of striatal projection pathways to action initiation and execution. Cell 166, 703–715. [DOI] [PubMed] [Google Scholar]
- Walters JR, Hu D, Itoga CA, Parr-Brownlie LC & Bergstrom DA. (2007). Phase relationships support a role for coordinated activity in the indirect pathway in organizing slow oscillations in basal ganglia output after loss of dopamine. Neuroscience 144, 762–776. [DOI] [PMC free article] [PubMed] [Google Scholar]
- Wang YY, Wang Y, Jiang HF, Liu JH, Jia J, Wang K, Zhao F, Luo MH, Luo MM & Wang XM. (2018). Impaired glutamatergic projection from the motor cortex to the subthalamic nucleus in 6-hydroxydopamine-lesioned hemi-parkinsonian rats. Exp Neurol 300, 135–148. [DOI] [PubMed] [Google Scholar]
- West MJ, Slomianka L & Gundersen HJ. (1991). Unbiased stereological estimation of the total number of neurons in the subdivisions of the rat hippocampus using the optical fractionator. Anat Rec 231, 482–497. [DOI] [PubMed] [Google Scholar]
- West MO. (1998). Anesthetics eliminate somatosensory-evoked discharges of neurons in the somatotopically organized sensorimotor striatum of the rat. J Neurosci 18, 9055–9068. [DOI] [PMC free article] [PubMed] [Google Scholar]
- Whitmer D, de Solages C, Hill B, Yu H, Henderson JM & Bronte-Stewart H. (2012). High frequency deep brain stimulation attenuates subthalamic and cortical rhythms in Parkinson’s disease. Front Hum Neurosci 6, 155. [DOI] [PMC free article] [PubMed] [Google Scholar]
- Wichmann T, Bergman H & DeLong MR. (1994). The primate subthalamic nucleus. I. Functional properties in intact animals. J Neurophysiol 72, 494–506. [DOI] [PubMed] [Google Scholar]
- Wichmann T, Bergman H & DeLong MR. (2018). Basal ganglia, movement disorders and deep brain stimulation: advances made through non-human primate research. J Neural Transm 125, 419–430. [DOI] [PMC free article] [PubMed] [Google Scholar]
- Wichmann T, Bergman H, Starr PA, Subramanian T, Watts RL & DeLong MR. (1999). Comparison of MPTP-induced changes in spontaneous neuronal discharge in the internal pallidal segment and in the substantia nigra pars reticulata in primates. Exp Brain Res 125, 397–409. [DOI] [PubMed] [Google Scholar]
- Wichmann T & DeLong MR. (2016). Deep brain stimulation for movement disorders of basal ganglia origin: Restoring function or functionality? Neurotherapeutics 13, 264–283. [DOI] [PMC free article] [PubMed] [Google Scholar]
- Wichmann T, Kliem MA & Soares J. (2002). Slow oscillatory discharge in the primate basal ganglia. J Neurophysiol 87, 1145–1148. [DOI] [PubMed] [Google Scholar]
- Willard AM, Isett BR, Whalen TC, Mastro KJ, Ki CS, Mao X & Gittis AH. (2019a). State transitions in the substantia nigra reticulata predict the onset of motor deficits in models of progressive dopamine depletion in mice. Elife 8. [DOI] [PMC free article] [PubMed] [Google Scholar]
- Willard AM, Isett BR, Whalen TC, Mastro KJ, Ki CS, Mao X & Gittis AH. (2019b). State transitions in the substantia nigra reticulata predict the onset of motor deficits in models of progressive dopamine depletion in mice. Elife 8, e42746. [DOI] [PMC free article] [PubMed] [Google Scholar]
- Wilson CJ & Phelan KD. (1982). Dual topographic representation of neostriatum in the globus pallidus of rats. Brain Res 243, 354–359. [DOI] [PubMed] [Google Scholar]
- Wilson CL, Cash D, Galley K, Chapman H, Lacey MG & Stanford IM. (2006). Subthalamic nucleus neurones in slices from 1-methyl-4-phenyl-1,2,3,6-tetrahydropyridine-lesioned mice show irregular, dopamine-reversible firing pattern changes, but without synchronous activity. Neuroscience 143, 565–572. [DOI] [PubMed] [Google Scholar]
- Wu Y, Richard S & Parent A. (2000). The organization of the striatal output system: a single-cell juxtacellular labeling study in the rat. Neurosci Res 38, 49–62. [DOI] [PubMed] [Google Scholar]
- Xu B, Lian S, Li SZ, Guo JR, Wang JF, Wang D, Zhang LP & Yang HM. (2018). GABAB receptor mediate hippocampal neuroinflammation in adolescent male and female mice after cold expose. Brain Res Bull 142, 163–175. [DOI] [PubMed] [Google Scholar]
- Yin HH & Knowlton BJ. (2006). The role of the basal ganglia in habit formation. Nat Rev Neurosci 7, 464–476. [DOI] [PubMed] [Google Scholar]
- Yoon HH, Park JH, Kim YH, Min J, Hwang E, Lee CJ, Suh JK, Hwang O & Jeon SR. (2014). Optogenetic inactivation of the subthalamic nucleus improves forelimb akinesia in a rat model of Parkinson disease. Neurosurgery 74, 533–541. [DOI] [PubMed] [Google Scholar]
- Zavala B, Zaghloul K & Brown P. (2015). The subthalamic nucleus, oscillations, and conflict. Mov Disord 30, 328–338. [DOI] [PMC free article] [PubMed] [Google Scholar]
- Zhu Z, Bartol M, Shen K & Johnson SW. (2002). Excitatory effects of dopamine on subthalamic nucleus neurons: In vitro study of rats pretreated with 6-hydroxydopamine and levodopa. Brain Res 945, 31–40. [DOI] [PubMed] [Google Scholar]
- Zhuang QX, Li GY, Li B, Zhang CZ, Zhang XY, Xi K, Li HZ, Wang JJ & Zhu JN. (2018). Regularizing firing patterns of rat subthalamic neurons ameliorates parkinsonian motor deficits. J Clin Invest 128, 5413–5427. [DOI] [PMC free article] [PubMed] [Google Scholar]
- Zold CL, Escande MV, Pomata PE, Riquelme LA & Murer MG. (2012). Striatal NMDA receptors gate cortico-pallidal synchronization in a rat model of Parkinson’s disease. Neurobiol Dis 47, 38–48. [DOI] [PubMed] [Google Scholar]
- Zold CL, Larramendy C, Riquelme LA & Murer MG. (2007). Distinct changes in evoked and resting globus pallidus activity in early and late Parkinson’s disease experimental models. Eur J Neurosci 26, 1267–1279. [DOI] [PubMed] [Google Scholar]
Associated Data
This section collects any data citations, data availability statements, or supplementary materials included in this article.