

Abstract
Dietary fibre (DF) functionalized with polyphenols is a functional ingredients as it provides the health benefits associated with consumption of both DF and polyphenols. The present study endeavoured to prepare DF-anthocyanin formulation with different ratio of pigment-matrix where DF and anthocyanin were extracted from culinary banana bracts. The formulated powders were studied for its antioxidant, structural properties and fluorescent properties. DF-anthocyanin formulation exhibited enhancement in anthocyanin content with increase in antioxidant content and it was highest for DF-A3 with better color values (L*, a*, C*) compared to other formulations. The structure of the formulation was mainly attributed to the structure of DF and anthocyanin as evidenced by FT-IR. Moreover, changes in the degree of crystallinity were found after addition of anthocyanin in fibre matrix. The morphology study by SEM confirmed the entrapment of particles (1.97–3.88 µm) on the network structure and surface of DF. Additionally, Akin fluorescence emission spectra of DF-A3 with anthocyanin extract further confirmed the formation of DF-anthocyanin complex. Storage stability study showed DF-A3 with lowest degradation rate (k = 0.0002 day−1) and half-life period of 87 days.
Keywords: Dietary fibre, Culinary banana bracts, Anthocyanin, Physicochemical properties, Storage stability
Introduction
India is the largest producer of banana in the world. But, banana farms generate several tons (220 tonnes) of underused by-products and wastes every year (Padam et al. 2014). Currently, considerable emphasis has been given on valorisation of waste fruit and vegetable materials. Flowers of all bananas including culinary banana is a byproduct of post-harvest cultivation and is rich source of dietary fibre (DF) (Sheng et al. 2010; Begum and Deka 2018). The outer and inner bracts of culinary banana flower contain 61.13 and 66.22% of DF, respectively (Begum and Deka 2019a). It is also a good source of antioxidants and numbers of phytochemicals, which are desirable for human health. The purple colored outer bracts of banana flower are disposed as residue after harvesting banana (Preethi and Balakrishnamurthy 2011). However, it shows great potential as an economical source of natural pigments with the attractive hue of the pigments (Pazmino-Duran et al. 2001; Begum and Deka 2017).
In recent years, “Antioxidant dietary fibre” (AODF) has given high importance by researchers. AODF are phenolic compounds associated with the cell wall of plants (Pérez-Jiménez and Saura-Calixto 2015). This interaction between plant polysaccharides and phenolics occur during fruit ripening, food processing or during the gastrointestinal process. Polysaccharides have the ability to bind and trap phenolics at several sites on the cell wall as phenolics contain both hydrophobic aromatic rings and hydrophilic hydroxyl groups (Macagnana et al. 2016). Interaction between two phenolic antioxidant of olive fruits, namely, hydroxytyrosol (HT) and 3,4-dihydroxyphenylglycol (DHPG) with DF of strawberry fruit occurred after drying. Bermúdez-Oria et al. (2019) reported that this strong interaction was due to the combination of covalent (ester bond) and non-covalent bonds (hydrogen bonding, electrostatic interaction). DF is associated in lowering blood cholesterol levels, normalizing blood glucose and insulin levels, promoting normal laxation, avoid constipation, increase satiety, and reduce the risk of colon cancer (Wickramarachchi and Ranamukhaarachchi 2005). Our recent study has shown that the extracted DF (ultrasound-assisted extracted DF) with higher water holding capacity (WHC), α-amylase inhibition ratio (α-AAIR) and glucose absorption capacity (GAC). α-Amylase was absorbed by DF and starch molecules get entrapped in the fibrous network due to its smaller particle size and higher crystallinity. Thus, the contact between α-amylase and starch got inhibited and the amount of glucose in serum decreased (Begum and Deka 2019b). Many studies claimed that the polyphenols associated with DF is mainly responsible for beneficial effects of DF, especially in the prevention and management of chronic and degenerative diseases (Aruna et al. 2017). Moreover, the effectivity of polyphenols has got increased when they are combined with DF (Kosmalaa et al. 2014). Transportation of dietary antioxidants through gastrointestinal tract is an essential function of dietary fibre (Saura-Calixto 2011). Studies reported that apple polyphenols combined with apple pectin exhibited a positive synergic effect on caecal fermentation and plasma lipid in rats (Aprikian et al. 2003). The fruit extract-DF preparation (strawberry extract in grain DF matrix) exhibited high antioxidant potential per unit of polyphenol content as well as the most beneficial influence on short-chain fatty acid (SCFA) production in the caecum of rats (Kosmalaa et al. 2014).
In the present study, we have made an attempt to formulate DF-anthocyanin complex with different ratio of pigment-matrix where DF extracted from culinary banana bract was used as matrix to entrap anthocyanin in its fibrous structure. The formulated powders were studied for its anthocyanin, antioxidant, structural and fluorescent properties. Further, the storage stability of different formulations was also studied.
Materials and methods
Chemicals
n-Hexane, trolox, methanol, formic acid and cellulose were supplied by Merck Millipore. Amberlite XAD7HP, HPLC standards viz., cyanidin-3-o-rutinoside, cyaniding-3-o-glucoside, peonidin-3-o-glucoside were purchased from Sigma Aldrich Corporation, USA and all the chemicals and reagents used in this study were of high purity AR grade.
Preparation of banana bract flour
Culinary banana (Musa ABB) flowers were obtained from Tezpur University Campus, Assam (India). Samples were washed, colored outer bracts were separated from inner bract and some portion of it was used further for extraction of anthocyanin. The remaining portion of outer and inner bracts were dried at 40 °C in a tray drier (Labotech, BDI-51, India). Samples were ground, packed in air tight container and stored at room temperature (25 ± 5 °C) until further analysis.
Extraction of anthocyanin from colored outer bract
Anthocyanin was extracted and purified from the colored outer bract according to our previous study (Begum and Deka 2017). Purified anthocyanin extract (14° Brix) was further used for preparation of DF-anthocyanin formulation.
Identification of anthocyanins by HPLC
Identification of anthocyanin by HPLC was performed following the method given by García-Tejeda et al. (2015). The purified anthocyanin of banana bract was identified by HPLC (Waters Corporation, USA, UV/visible detector-2489). Water, methanol, formic acid (14:5:1) was used as solvent. The flow rate was 1.5 ml/min and the elutes were monitored by visible spectrometry at maximum wavelength 530 nm.
Extraction of dietary fibre
Dietary fibre was extracted from culinary banana bract according to the method described in our previous study (Begum and Deka 2019b). To prepare DF using ultrasound-assisted extraction method, firstly, deoiled culinary banan bract (CBB) was suspended in 0.5 M NaOH solution (1:21.45 solute to solvent ratio) at 50 °C and an agitation speed of 500 rpm using laboratory stirrer (RQT-127D, Remi, Maharashtra, India) for 30 min. Further it was sonicated at 20 kHz for 14.28 min at temperature 77.68 °C using probe type ultrasonicator (Q700-220 DSgitalSonicator, Qsonica LLC, USA) and 37.27% sonication amplitude. The extraction condition of DF was optimized in our preliminary screening. The mixture was neutralized using 0.5 M HCl. The extracted DF was then dried at 40 °C overnight to obtain DF.
Preparation of DF-anthocyanin formulation
Purified anthocyanin extract was mixed with DF with different ratio (2:1–4:1) and were homogenised. The TSS of the mixture was adjusted to 20° Brix using refractometer Abbe Tropenmodell I (Carl Zeiss Jena, Germany) for soluble solids. The preparation was then freeze dried (Lyolab_3S, Lyophilization System India Pvt Ltd Hyderabaad, India). The anthocyanin-fibre preparation with different anthocyanin and DF as matrix ratio were named as DF-A2 (2:1), DF-A3 (3:1) and DF-A4 (4:1). A control without anthocyanin was prepared and named as DF-C. Cellulose was used as a replacement for DF and was coded as CEL-A.
Physicochemical analysis
Moisture content of DF-anthocyanin formulation was determined according to the method described in AOAC (1998).
The total anthocyanin (TA) content of formulation was determined according to the spectrophotometric pH differential method (Lee et al. 2005). The TA content was calculated as cyanidin-3-glucoside equivalents. Absorbance was calculated as given in the following equation
The total anthocyanin content was calculated as cyanidin-3-glucoside equivalents as shown in the following equation
where A is the absorbance; MW is the molecular weight (MW = 449.2 g mol−1); DF is the dilution factor; ε is the molar absorptivity (ε = 26,900 L cm−1 mol−1); V = volume of solvent in ml; l is the path length.
DPPH free radical scavenging activity of formulation was determined following the method of Brand-Williams et al. (1995).
The hygroscopicity of the formulation were determined according to Cai and Corke (2000) and Tonon et al. (2008).
Color characteristics of DF-anthocyanin formulation
Color characteristics of DF-anthocyanin formulation were determined following the methodology of our previous study (Begum and Deka 2017). L*, a*, and b* colour values of the formulated powder were measured using a Hunter Color Measurement Spectrophotometer (UltraScan VIS, Hunter Lab) after equipment standardization. Chroma (C*) and hue angle (H°) were determined using the following equations:
FT-IR analysis of DF-anthocyanin formulation
FT-IR analysis of DF-anthocyanin formulation was done according to Khor et al. (2017). The characterization and functional groups of DF-anthocyanin formulation were determined using spectrometer (Nicolet Instruments 410 FTIR, Thermo Scientific, USA) and spectra were attained over the range of 400–4000 cm−1 with 4 cm−1 resolution and 16 scans were collected.
XRD analysis of DF-anthocyanin formulation
The crystallinity of DF-anthocyanin formulation were determined using X-ray Diffractometer (Bruker AXS, Germany) operated at 60 kV. Cu-Kα radiation source with a wavelength of 0.1542 nm was used. The analysis was performed at 2θ range of 5–80 °C and a step size of 0.001°. The degree of crystallinity (Clevan et al. 1978) was calculated as below
where Dc is the degree of crystallinity; Ac is crystallized area; Aa is amorphous area on X-ray diffractogram
SEM analysis of DF-anthocyanin formulation
The structural and morphological features of DF-anthocyanin formulations were analysed by JSM-6390LV (JEOL, Japan) scanning electron microscope. SEM analysis of DF-anthocyanin formulation was done according to the method given by Khor et al. (2017). SEM was operated with 20 kV at magnification of 750× and 3000×.
Analysis of fluorescence property of DF-anthocyanin formulation
The samples were prepared by dissolving in Milli-Q water (2 × 10⁻⁵ mol dm−3) at pH 5.5. The pH is chosen according to the procedure of Drabent et al. (2007). The fluorescence emission spectra were recorded (25.0 ± 0.2 °C) using a fluorescence spectrophotometer (Perkin Elmer, LS 55, Singapore). The excitation wavelength used was 220 and 270 nm.
Storage study
The formulated powder were stored under accelerated storage condition at 35 °C and 75% RH. Samples were analysed at every 7-day interval for anthocyanin content. The reaction rate constant (k) and half-lives (t1/2) were calculated for all three reaction kinetic model using the following equations.
First-order reaction kinetic model
Second-order reaction kinetic model
Third-order reaction kinetic model
C0 is the initial anthocyanin content, Ct is the anthocyanin content at reaction time t and k is the reaction rate.
t1/2 is the time when the anthocyanin content was reduced by 50% with respect to zero time (Desobry et al. 1997). Three reaction kinetic models were applied to data and based on the best fits (higher R2), the kinetic model was selected for the storage study.
Statistical analysis
Experiments were carried out in triplicate. Means of data obtained were evaluated using Duncan’s multiple range test to identify significant differences at the 0.05 probability (p < 0.05) using the SPSS 16.
Results and discussion
Identification of anthocyanin using HPLC
Total anthocyanin content (TAC) of culinary banana bract is 56.98 mg/100 g (Begum and Deka 2017). As shown in Fig. 1, three anthocyanin viz., cyanidin-3-o-glucoside, cyanidin-3-o-rutinoside and peonidin-3-o-glucoside were identified in the anthocyanin extract. All the peak except cyanidin-3-o-rutinoside were identified in our previous study (Begum and Deka 2017). The quantifications were also done and shown in Table 1.
Fig. 1.
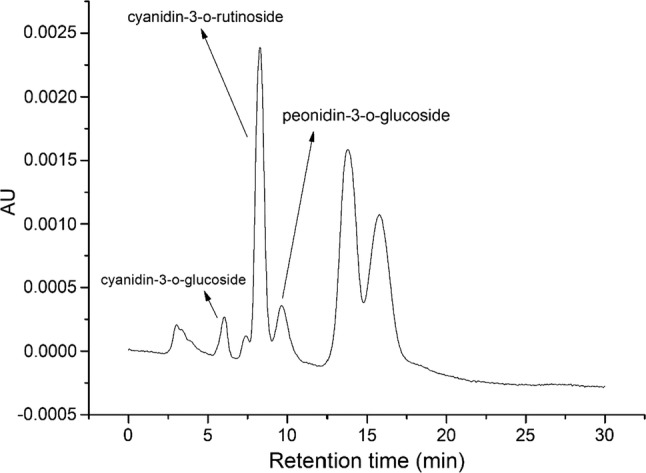
HPLC chromatogram of anthocyanin extracted from culinary banana bract
Table 1.
Estimation and quantification of anthocyanin in culinary banana bract
| Anthocyanin | Quantity (mg/100 g) |
|---|---|
| Cyanidin-3-o-glucoside | 0.88 |
| Cyanidin-3-o-rutinoside | 4.06 |
| Peonidin-3-o-glucoside | 3.69 |
Anthocyanin content of DF-anthocyanin formulations increased significantly (p < 0.05) with the increase of pigment-matrix ratio and it was highest in DF-A3. The anthocyanin content decreased in DF-A4 due to inadequate amount matrix as compared to the pigment (Tonon et al. 2010). The total anthocyanin content in CEL-A was lesser relative to DF-anthocyanin formulation. The antioxidant content was found to be highest in DF-A3 which was related to high anthocyanin content. For CEL-A, the antioxidant content was 0.36 µmol TE/g fresh mass (Table 2) which was lesser significantly (p < 0.05) to other DF-anthocyanin formulations. Hygroscopity as shown in Table 2, did not follow any special trend and varied from 7.01 to 12.11%. Hygroscopicity was significantly (p < 0.05) higher in CEL-A compared to the DF-anthocyanin formulations.
Table 2.
Physicochemical properties of DF-anthocyanin formulation
| DF-C | DF-A2 | DF-A3 | DF-A4 | CEL-A | |
|---|---|---|---|---|---|
| Moisture content (g/100 g) | 8.57 ± 0.05a | 8.9 ± 0.61b | 9.21 ± 0.12c | 9.56 ± 0.30d | 10.4 ± 0.23e |
| Total anthocyanin (mg/100 g) | 3.39 ± 0.23a | 15.24 ± 0.25b | 41.64 ± 0.13e | 28.41 ± 0.08d | 18.38 ± 0.15c |
| DPPH (µmol TE/g fresh mass) | 0.07 ± 0.08a | 0.57 ± 0.02c | 1.33 ± 0.15e | 1.11 ± 0.07d | 0.36 ± 0.02b |
| Hygroscopicity (%) | 7.78 ± 0.12b | 7.01 ± .22a | 8.71 ± 0.16c | 9.29 ± 0.15d | 12.11 ± 0.8e |
Mean with different superscript letters in the same row represent a significant difference at p < 0.05, values represent mean ± SD; n = 3
Color characteristics of formulated powder
The color characteristics of DF-anthocyanin formulation are shown in Table 3. L* value increased significantly (p < 0.05) with increase in the pigment content up to DF-A3 and then again decreased. Chroma (C*) was significantly (p < 0.05) higher in DF-A4 among the DF-anthocyanin formulations. Chroma (C*) was found to be highest in CEL-A. The higher b* value of DF-anthocyanin formulation influenced the bright purple colored pigment (Begum and Deka 2017).
Table 3.
Color characteristics of DF-anthocyanin formulation
| Sample code | Colour values | ||||
|---|---|---|---|---|---|
| L* | a* | b* | C* | H° | |
| DF-C | 44.43 ± 0.07a | 6.8 ± 0.12a | 10.02 ± 0.31e | 12.10b | 55.83d |
| DF-A2 | 46.32 ± 0.22b | 7.76 ± 0.21b | 9.18 ± 0.05d | 12.02a | 49.79c |
| DF-A3 | 50.42 ± 1.19d | 9.12 ± 0.12c | 8.14 ± 0.24b | 12.22c | 41.75b |
| DF-A4 | 48.72 ± 0.52c | 9.27 ± 0.16d | 8.27 ± 0.20c | 12.42d | 41.73b |
| CEL-A | 64.31 ± 1.16e | 15.15 ± 0.17e | 1.23 ± 0.32a | 15.19e | 4.64a |
Mean with different superscript letters in the same column represent a significant difference at p < 0.05, values represent mean ± SD; n = 3
FT-IR analysis of DF-anthocyanin formulation
The functional group of DF-anthocyanin formulation along with the anthocyanin extract were analysed by FT-IR and are shown in Fig. 2. The absorption band at 3434, 2925, 1634, 1447 and 1049 cm−1 in all the formulations, confirmed the typical polysaccharide structure (Zhao et al. 2013). However peak at 1516, 1261 and 1072 cm−1 corresponds to vibrational stretching of aromatic rings (=C–O–C group) in flavonoids were observed in the anthocyanin extracts (Favaro et al. 2018). The individual bands were seen in all the formulations. As reported by Khor et al. (2017), an unchanged structure of quercetin was observed in quercetin-fibre formulations before and after nanoformulation.
Fig. 2.
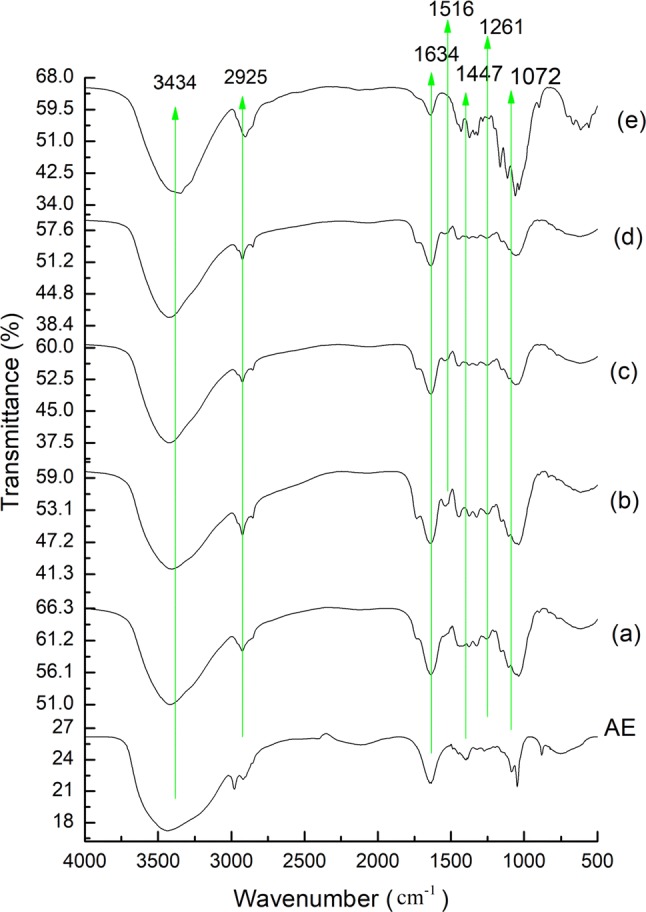
FT-IR analysis of anthocyanin extract (AE) and DF-anthocyanin formulation. (a) DF-C, (b) DF-A2, (c) DF-A3, (d) DF-A4, and (e) CEL-A
X-ray diffraction analysis of DF-anthocyanin formulation
The degree of crystallinity (DC) was determined from the X-ray diffraction analysis and is shown in Fig. 3. DF-C does not exhibit any distinct peak, indicating its amorphous nature. The crystallinity of the DF-anthocyanin formulation (Table 4) increased after addition of anthocyanin extract and varied from 25.86 to 41.70%. The DC for CEL-A was maximum (56.90%). Increased crystallinity of quercetin-fibre nanoformulation compared to the pure fibre and weaker as compared to pure quercetin was also observed by Khor et al. (2017).
Fig. 3.
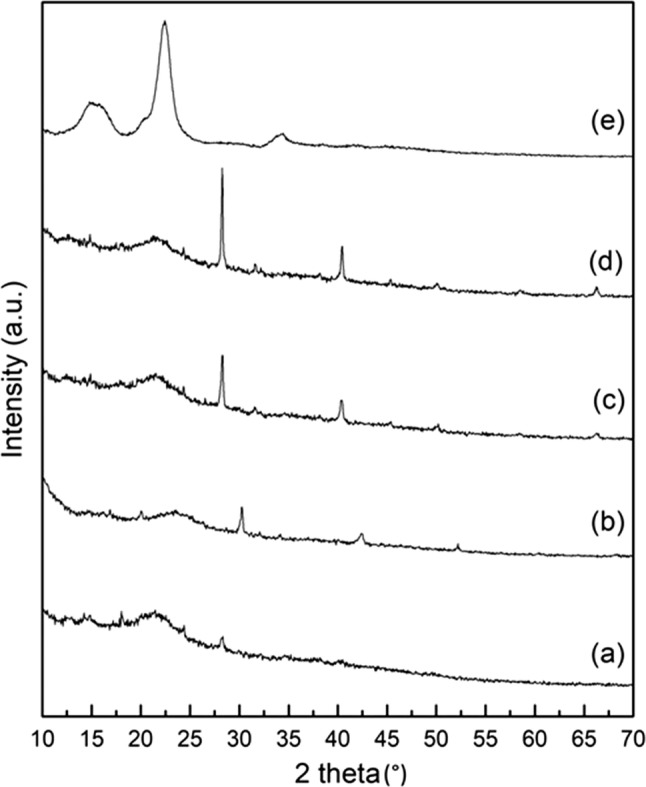
X-ray diffraction analysis of DF-anthocyanin formulation. (a) DF-C, (b) DF-A2, (c) DF-A3, (d) DF-A4, and (e) CEL-A
Table 4.
Degree of crystallinity (Dc) of DF-anthocyanin formulation
| Sample code | Degree of crystallinity (%) |
|---|---|
| DF-C | 25.86 ± 0.07a |
| DF-A2 | 28.11 ± 0.10b |
| DF-A3 | 38.32 ± 0.21c |
| DF-A4 | 41.70 ± 0.11d |
| CEL-A | 56.90 ± 0.20e |
Mean with different superscript letters in the same column represent a significant difference at p < 0.05, values represent mean ± SD; n = 3
Morphology study of DF-anthocyanin formulation
The morphology of the formulated DF-anthocyanin formulations were studied using SEM. The typical honey-comb structure with holes and crack was observed in DF-C (Fig. 4a). Spherical particle of size ranges from 1.97 to 3.86 µm are seen in Fig. 4(b2). These particles were appeared to be entrapped in network structure of DF. As shown in Fig. 4(c2), surface attachment of some particles in the cellulose rod structure was observed. Similar kind of morphology was found in quercetin-fibre nanoformulation with quercetin particles (1–5 µm), wrapped inside the fibre outer shell. Moreover, small rod like particles (100 nm) and their agglomerates were observed on the surfaces of cellulose fibre (Khor et al. 2017).
Fig. 4.

SEM micrograph of DF-anthocyanin formulation a DF-C; b1 DF-A3 at ×750, b2 at ×3000; c1 CEL-A at ×750, c2 at ×3000
Fluorescence properties of DF-anthocyanin formulation
The fluorescence emission spectra (at pH-5.5) of anthocyanin extract, DF-C and DF-A3 are shown in Fig. 5. Akin emission spectra (λexc = 270 nm) was observed for anthocyanin extract and DF-A3 with the maxima at 322 nm and in the visible range at 546 nm. However, the fluorescence emission intensity of the extract was significantly higher as compared to DF-A3. Besides, DF-C does not exhibit any prominent fluorescence emission band and can be regarded as non-fluorescent. Hence, the complex formation between anthocyanin extract and DF in DF-anthocyanin formulation was confirmed by fluorescence characterization.
Fig. 5.

Fluorescence emission spectra at excitation wavelength a λexc = 220 nm; b λexc = 270 nm. (a) Anthocyanin extract; (b) DF-A3; (c) DF-C
Anthocyanin stability of DF-anthocyanin formulation
The rate of degradation (k), half-life period (t1/2), actual t1/2 with R2 values for all three kinetic reaction model are shown in Table 5. Degradation of pigments and vitamin during processing or storage, generally follow first order reaction kinetics (Moura et al. 2012). Moura et al. (2018) also explained that thermal degradation of the anthocyanins can be described in terms of first order reaction kinetics. But, in our study, the best fits model (higher R2) was found for the second order reaction kinetics (Table 5). A fast degradation was observed for the first fourth week followed by gradual degradation. The degradation of anthocyanin content using second order reaction kinetics is shown in Fig. 6. The fast degradation (up to fourth week) might be due the oxidation of surface anthocyanin. The lower degradation rate could be explained by limitation in oxygen transfer rate to the entrapped anthocyanin in DF matrix (Tonon et al. 2010). Moreover, the degradation was lower in DF-A3 compared to the other formulations (k = 0.0002 day−1) with half-life period of 87 days. Thus, the formulation of DF-anthocyanin (3:1) showed better storage stability with longest half-life period.
Table 5.
Degradation kinetics of the DF-anthocyanin formulation
| Sample code | k (days−1) | t1/2 (days) | R2 | Actual t1/2 (days) |
|---|---|---|---|---|
| Zero order | ||||
| DF-A2 | 0.1224 | 61.25 | 0.6428 | 59.50 |
| DF-A3 | 0.2768 | 75.32 | 0.9129 | 77.49 |
| DF-A4 | 0.2570 | 55.16 | 0.7092 | 40.67 |
| CEL-A | 0.1442 | 63.56 | 0.7728 | 65.94 |
| First order | ||||
| DF-A2 | 0.0121 | 56.98 | 0.8559 | 59.50 |
| DF-A3 | 0.0087 | 79.03 | 0.9681 | 77.49 |
| DF-A4 | 0.0145 | 47.51 | 0.8974 | 40.67 |
| CEL-A | 0.0113 | 61.11 | 0.9225 | 65.94 |
| Second order | ||||
| DF-A2 | 0.0041 | 56.56 | 0.9506 | 59.50 |
| DF-A3 | 0.0002 | 87.57 | 0.9786 | 77.49 |
| DF-A4 | 0.0007 | 46.48 | 0.9616 | 40.67 |
| CEL-A | 0.0008 | 62.44 | 0.9818 | 65.94 |
Fig. 6.

Anthocyanin degradation a zero order kinetic model, b first order kinetic model and c second order kinetic model. a DF-A2; b DF-A3; c DF-A4; d CEL-A, exp experimental, pre predicted
Conclusion
The present study revealed that addition of anthocyanin in DF matrix greatly improved the anthocyanin and antioxidant content of DF-anthocyanin formulation and was highest in DF-A3. Moreover, the color values were also improved by addition anthocyanin which was summarized in the color characteristics study. No structural change was noticed by FT-IR spectra after addition of anthocyanin in DF matrix, although the DC increased with increase of pigment-matrix ratio as showed in X-ray diffraction analysis. The morphology study (DF-A3 and CEL-A) by SEM confirmed entrapment and surface attachment of particles (1.97–3.86 µm) in the network structure of DF. The fluorescence emission spectra of DF-anthocyanin complex confirmed the interaction between anthocyanin and DF. The storage stability study showed that anthocyanin degradation of DF-anthocyanin followed second order kinetics. In addition DF-A3 showed lowest degradation with the longest half-life period relative to other formulations. Thus, the pigment-matrix ratio (3:1) was optimum for DF-anthocyanin formulation with improved antioxidant content and storage stability. Further investigation is required to obtain the information about the kind of complex formation between anthocyanin and dietary fibre in the complex. The results of the present investigation has the credentials to support that the developed DF-anthocyanin formulation (DF-A3) could be an excellent “antioxidant dietary fibre” with an interesting color and can be used as supplement or functional ingredients for value-added food products.
Acknowledgements
Financial assistance received as MAN Fellowship from UGC, New Delhi, Govt. of India during the study is duly acknowledged.
Footnotes
Publisher's Note
Springer Nature remains neutral with regard to jurisdictional claims in published maps and institutional affiliations.
References
- Aprikian O, Duclos V, Gujot S, Besson C, Manach C, Bernalier A, et al. Apple pectin and polyphenol-rich apple concentrate are more effective together than separately on cecal fermentations and plasma lipids in rats. J Nutr. 2003;133:1860–1865. doi: 10.1093/jn/133.6.1860. [DOI] [PubMed] [Google Scholar]
- Aruna KB, Thomas S, Reshmitha TR, Akhila GC, Nishaa P. Dietary fibre and phenolic-rich extracts from Musa paradisiaca inflorescence ameliorates type 2 diabetes and associated cardiovascular risks. J Funct Foods. 2017;31:198–207. doi: 10.1016/j.jff.2017.02.001. [DOI] [Google Scholar]
- Association of Official Analytical Chemists (AOAC) Official methods of analysis of the association of analytical chemists. 16. Washington: Association of Official Analytical Chemists; 1998. [Google Scholar]
- Begum YA, Deka SC. Stability of spray-dried microencapsulated anthocyanins extracted from culinary banana bract. Int J Food Prop. 2017;20(12):3135–3148. doi: 10.1080/10942912.2016.1277739. [DOI] [Google Scholar]
- Begum YA, Deka SC. Banana flower: a potential source of functional ingredients and its health beneficial effects. In: Aguilar CN, Carvajal-Millan E, editors. Applied food science and engineering with industrial applications. 1265 Goldenrod Circle NE Palm Bay, Florida 32905, USA: International Apple Academic Press, Inc. (CRC Press, Taylor and Francis Group); 2018. pp. 47–64. [Google Scholar]
- Begum YA, Deka SC. Chemical profiling and functional properties of dietary fibre rich inner and outer bracts of culinary banana flower. J Food Sci Technol. 2019;56(12):5298–5308. doi: 10.1007/s13197-019-04000-4. [DOI] [PMC free article] [PubMed] [Google Scholar]
- Begum YA, Deka SC. Effect of processing on structural, thermal, and physicochemical properties of dietary fiber of culinary banana bracts. J Food Process Preserv. 2019 doi: 10.1111/jfpp.14256. [DOI] [Google Scholar]
- Bermúdez-Oria A, Rodríguez-Gutiérrez G, Fernández-Prior A, Vioque B, Fernández-Bolaños J. Strawberry dietary fiber functionalized with phenolic antioxidants from olives. Interactions between polysaccharides and phenolic compounds. Food Chem. 2019;280:310–320. doi: 10.1016/j.foodchem.2018.12.057. [DOI] [PubMed] [Google Scholar]
- Brand-Williams W, Cuvelier ME, Berset C. Use of a free-radical method to evaluate antioxidant activity. LWT-Food Sci Technol. 1995;28(1):25–30. doi: 10.1016/S0023-6438(95)80008-5. [DOI] [Google Scholar]
- Cai YZ, Corke H. Production and properties of spray-dried amaranthusbetacyanin pigments. J Food Sci. 2000;65(6):1248–1252. doi: 10.1111/j.1365-2621.2000.tb10273.x. [DOI] [Google Scholar]
- Clevan R, Van den Berg C, Van Der Plas L. Crystal structure of hydrated potato starch. Starch-Starke. 1978;30(7):223–228. doi: 10.1002/star.19780300703. [DOI] [Google Scholar]
- Desobry SA, Netto FM, Labuza TP. Comparison of spray-drying, drum-drying and freeze-drying for β-carotene encapsulation and preservation. J Food Sci. 1997;62(6):1158–1162. doi: 10.1111/j.1365-2621.1997.tb12235.x. [DOI] [Google Scholar]
- Drabent R, Pliszka B, Huszcza-Ciołkowska G, Smyk B. Ultraviolet fluorescence of cyanidin and malvidin glycosides in aqueous environment. Spectrosc Lett. 2007;40:165–182. doi: 10.1080/00387010600854279. [DOI] [Google Scholar]
- Favaro LIL, Balcão VM, Rocha LKH, Silva EC, Oliveira JM, Jr, Vila MMDC, Tubino M. Physicochemical characterization of a crude anthocyanin extract from the fruits of Jussara (Euterpe edulis Martius): potential for food and pharmaceutical applications. J Braz Chem Soc. 2018;29(10):2072–2088. [Google Scholar]
- García-Tejeda YV, Salinas-Moreno Y, Martínez-Bustos F. Acetylation of normal and waxy maize starches as encapsulating agents for maize anthocyanins microencapsulation. Food Bioprod Process. 2015;94:717–726. doi: 10.1016/j.fbp.2014.10.003. [DOI] [Google Scholar]
- Khor CM, Ng WK, Chan KP, Dong Y. Preparation and characterization of quercetin/dietary fibre nanoformulations. Carbohydr Polym. 2017;161:109–117. doi: 10.1016/j.carbpol.2016.12.059. [DOI] [PubMed] [Google Scholar]
- Kosmalaa M, Zduńczyk Z, Karlińska E, Juśkiewicz J. The effects of strawberry, black currant, and chokeberry extracts in a grain dietary fiber matrix on intestinal fermentation in rats. Food Res Int. 2014;64:752–761. doi: 10.1016/j.foodres.2014.07.010. [DOI] [PubMed] [Google Scholar]
- Lee J, Durst RW, Wrolstad RE. Determination of total monomeric anthocyanin pigment content of fruit juices, beverages, natural colorants, and wines by the pH differential method: collaborative study. J AOAC Int. 2005;88(5):1269–1288. doi: 10.1093/jaoac/88.5.1269. [DOI] [PubMed] [Google Scholar]
- Macagnana FT, da Silvab LP, Hecktheuer L. Dietary fibre: the scientific search for an ideal definition and methodology of analysis, and its physiological importance as a carrier of bioactive compounds. Food Res Int. 2016;85:144–154. doi: 10.1016/j.foodres.2016.04.032. [DOI] [PubMed] [Google Scholar]
- Moura SCSR, Tavares PER, Germer SPM, Nisida ALAC, Alves AB, Kanaan AS. Degradation kinetics of anthocyanin of traditional and low sugar blackberry jam. Food Bioprocess Technol. 2012;5:2488–2496. doi: 10.1007/s11947-011-0578-7. [DOI] [Google Scholar]
- Moura SCSR, Berling CL, Germer SPM, Alvim ID, Hubinger MD. Encapsulating anthocyanins from Hibiscus sabdariffa L. calyces by ionic gelation: pigment stability during storage of microparticles. Food Chem. 2018;241:317–327. doi: 10.1016/j.foodchem.2017.08.095. [DOI] [PubMed] [Google Scholar]
- Padam BS, Tin HS, Chye FY, Abdullah MI. Banana by-products: an under-utilized renewable food biomass with great potential. J Food Sci Technol. 2014;51(12):3527–3545. doi: 10.1007/s13197-012-0861-2. [DOI] [PMC free article] [PubMed] [Google Scholar]
- Pazmino-Duran A, Giutsi MM, Wrolstad RE, Gloria MBA. Anthocyanin from banana bract (Musa X paradisiaca) as potential food colorant. Food Chem. 2001;73:327–332. doi: 10.1016/S0308-8146(00)00305-8. [DOI] [Google Scholar]
- Pérez-Jiménez J, Saura-Calixto F. Macromolecular antioxidants or non extractable polyphenols in fruit and vegetables: intake in four European countries. Food Res Int. 2015;74:315–323. doi: 10.1016/j.foodres.2015.05.007. [DOI] [PubMed] [Google Scholar]
- Preethi P, Balakrishnamurthy G. Assessment of banana cultivars for pigment extraction from bracts, Its suitability and stability as food colorant. Int J Process Post Harvest Technol. 2011;2(2):98–101. [Google Scholar]
- Saura-Calixto F. Dietary fibre as a carrier of dietary antioxidants: an essential physiological function. J Agric Food Chem. 2011;59:43–49. doi: 10.1021/jf1036596. [DOI] [PubMed] [Google Scholar]
- Sheng Z, Ma W, Jin Z, Bi Y, Sun Z, Dou H, Gao J, LiJ Han L. Investigation of dietary fibre, protein, vitamin E and other nutritional compounds of banana flowers of two cultivars grown in china. Afr J Biotechnol. 2010;9(25):3888–3895. [Google Scholar]
- Tonon RV, Brabet C, Rubinger MD. Influence of process conditions on the physicochemical properties of açai (Euterpe oleraceae Mart.) powder produced by spray drying. J Food Eng. 2008;88:411–418. doi: 10.1016/j.jfoodeng.2008.02.029. [DOI] [Google Scholar]
- Tonon RV, Brabet C, Hubinger MD. Anthocyanin stability and antioxidant activity of spray-dried acai (Euterpe oleracea Mart.) juice produced with different carrier agents. Food Res Int. 2010;43(3):907–914. doi: 10.1016/j.foodres.2009.12.013. [DOI] [Google Scholar]
- Wickramarachchi KS, Ranamukhaarachchi SL. Preservation of fibre-rich banana blossom as a dehydrated vegetable. Sci Asia. 2005;31:265–271. doi: 10.2306/scienceasia1513-1874.2005.31.265. [DOI] [Google Scholar]
- Zhao XY, Chen J, Chen FL, Wang XC, Zhu QJ, Ao Q. Surface characterization of corn stalk superfine powder studied by FT-IR and XRD. Colloids Surf B Biointerfaces. 2013;104:207–212. doi: 10.1016/j.colsurfb.2012.12.003. [DOI] [PubMed] [Google Scholar]