

Abstract
Mealiness in apple fruit can occur during storage or because of harvesting in an inappropriate time; it degrades the quality of the fruit and has a considerable role in the fruit industry. In this paper, a novel non-destructive approach for detection of mealiness in Red Delicious apple using acoustic and deep learning techniques was proposed. A confined compression test was performed to assign labels of mealy and non-mealy to the apple samples. The criteria for the assignment were hardness and juiciness of the samples. For the acoustic measurements, a plastic ball pendulum was used as the impact device, and a microphone was installed near the sample to record the impact response. The recorded acoustic signals were converted to images. Two famous pre-trained convolutional neural networks, AlexNet and VGGNet were fine-tuned and employed as classifiers. According to the result obtained, the accuracy of AlexNet and VGGNet for classifying the apples to the two categories of mealy and non-mealy apples was 91.11% and 86.94%, respectively. In addition, the training and classification speed of AlexNet was higher. The results indicated that the suggested method provides an effective and promising tool for assessment of mealiness in apple fruit non-destructively and inexpensively.
Keywords: Apple mealiness assessment, Red Delicious, Impact response, Classification, Convolutional neural networks
Introduction
A considerable portion of the harvested apple fruit is stored in the world in order to respond the market needs throughout the year. The harvested apples are often regularly firm, crisp and juicy. However, during the storage, the texture of the fresh apples may gradually become soft, dry and mealy (Seppä et al. 2013). A number of factors can cause mealiness in apples, such as harvest date, fruit size, long-term storage and storage conditions (Huang and Lu 2010). Mealiness reduces quality of apples and negatively influences their market value. Therefore, precise and rapid assessment of apples mealiness during the storage is crucial to monitor their quality and to sort them. Non-destructive methods are preferred because they can be applied to real-time procedures and also can reduce the measurements costs. Mealiness analysis can also be useful in choosing the optimal date for harvesting.
A basic method used to detect mealiness in apples has been the trained sensory panel. Instrumental tests such as puncture, shear, compression, and tensile tests have also been applied as an alternative to the sensory panel. It has been shown that these two methods have a good correlation. But both the approaches are expensive, time-consuming and destructive. In addition they cannot be used for on-line measurements and they are practical for just a small number of samples (Corollaro et al. 2014; Arefi et al. 2015).
Many efforts have been done to develop non-destructive methods for the mealiness assessment of fruit. These methods fall into two main categories, mechanical techniques including ultrasonic (Bechar et al. 2005), acoustic (Zdunek et al. 2011; Zhang et al. 2014), and force impulse response (Gómez et al. 2005), and electromagnetic approaches such as NMR/MRI (Barreiro et al. 2000), NIR spectroscopy (Mendoza et al. 2014), time resolved spectroscopy (Valero et al. 2005), hyperspectral backscattering imaging (Huang and Lu 2010) and fluorescence measurement (Moshou et al. 2003). Arefi et al. (2015) reviewed the methods in detail.
Among the mentioned non-destructive methods, acoustic sensing is known as a reliable approach for texture assessment of agricultural products (Zhang et al. 2014). Application of this technique for textural evaluation of fruit during harvest and postharvest processes is increasing (Tiplica et al. 2010). The approach has been used for measuring textural characteristics of fruit such as apple (Arana et al. 2004; Zdunek et al. 2011), peach (Ortíz et al. 2001), and pear (Zhang et al. 2014; Gómez et al. 2005).
The need for accurate and reliable systems that can predict fruit quality has been motivated researchers to further investigate on using different techniques. In this study, we also tried to propose a novel method based on a combination of acoustic sensing and deep learning (DL) to assess mealiness in apple fruit. For this purpose, recorded acoustic signals of apples were converted to images; the images were then classified to mealy and non-mealy (fresh) apples using DL algorithms. As reviewed by Kamilaris and Prenafeta-Boldú (2018) the main source of data in agricultural applications used for training DL algorithms has been images taken from target subjects. In addition, based on our literature review, using acoustic signals as source data to train DL networks has not been applied in agriculture and especially in mealiness detection. Therefore, combination of acoustic sensing and DL for mealiness assessment in apple can be regarded as a novel study.
DL (LeCun et al. 2015) as a recent and modern machine learning method combines techniques of image processing and data analysis; it is based on the use of artificial neural network (ANN) architectures that are deeper than the traditional ANNs. DL has been successfully applied in various domains including the domain of agriculture to solve highly complex classification and prediction problems with high accuracy and low error (Kamilaris and Prenafeta-Boldú 2018). Another major advantage of DL is automatic extraction of adequate features from the data (the images) for dealing with the given problem.
Convolutional Neural Networks (CNNs) are the most popular DL architectures (Kamilaris and Prenafeta-Boldú 2018). CNNs have been used in agriculture for identification and classification of plant species, diseases, weeds and insects (Dyrmann et al. 2016; Mehdipour Ghazi et al. 2017; Lu et al. 2017; Tang et al. 2017; Shen et al. 2018).
Since training CNNs from scratch needs a large amount of data (millions of samples) and high computational resources, many of researchers have adapted pre-trained networks (e.g. AlexNet and VGGNet) to their specific task with limited number of data, through fine-tuning. This procedure is called transfer learning (Pan and Yang 2010). Transfer learning of CNNs has been also applied in some agricultural applications such as disease detection (Fuentes et al. 2017) and weed classification (Suh et al. 2018).
In this study, transfer learning of the two well-known CNNs with different depths, AlexNet and VGGNet was employed to classify mealy and non-mealy apples.
Materials and methods
Apple samples
The experiment was done on ‘Red Delicious’ apples. A total of 180 samples without any visible external damage were used. Apples at commercial maturity were hand harvested in September 2015. A digital balance (accuracy of 0.01 g.) was used to measure fruit mass. The mass of apples ranged from 115.76 to 291.40 g with an average of 181.92 g and a standard deviation of 30.8 g. The average diameter of the apples was 72.8 mm, with sizes varying from 60.3 to 92.7 mm.
In the literature, various combinations of temperature, humidity and storage time have been used to develop different degrees of apple mealiness (Bechar et al. 2005; Huang et al. 2012; Arefi et al. 2016). Temperature has an important role in controlling mealiness. For inducing mealiness, apples have to be stored at room temperature, while mealiness is not expected for those apples kept in a cold room (Huang and Lu 2010). Relative humidity has also a significant effect on inducing mealiness. Apples at high relative humidity preserved their firmness better than those that were stored at low relative humidity (Arefi et al. 2016). In addition, the loss of water due to long storage time will cause mealiness (Arefi et al. 2016).
Accordingly, room temperature (21 °C) and cold temperature (6 °C) were selected for storage conditions, to produce mealy and non-mealy apples, respectively. Different storage treatments were applied to the apples. 60 of them were selected randomly and transported to the laboratory (without storage). Then the remaining samples were divided randomly and equally into four groups and stored at different conditions. The treatments are listed below:
Harvest: 60 fresh harvested fruit, without storage.
Cold 1: 30 fruit were kept in a cold room (6 °C and 50% RH) for 1 month.
Room 1: 30 fruit were kept at room temperature (21 °C and 37% RH) for 1 month.
Cold 2: 30 fruit were kept in a cold room (6 °C and 50% RH) for 2 months.
Room 2: 30 fruit were kept at room temperature (21 °C and 37% RH) for 2 months.
Before the analyses, the fruit were put at room temperature.
Destructive measurements
Instrumental tests are often performed as the standard destructive method for evaluating texture of fruit; because these methods correlate well with the human perception (the sensory panel method) (Bourne 2002). Generally, the non-destructive methods are evaluated against the destructive tests (Zude 2008). In the other words, the destructive measurements are needed to verify the quality of the fruit used for the non-destructive analyses. Therefore, performing destructive measurements is inevitable for developing a new non-destructive method (Arefi et al. 2015).
In the past two decades a number of researchers have used confined compression test as a reference for fruit mealiness detection (Barreiro et al. 2000; Bechar et al. 2005; Huang et al. 2012; Arefi et al. 2016). We carried out the confined compression on samples of the fruit by using a SANTAM universal testing machine (Model SMT-20). The test was performed according to what described by the literature. Cylindrical samples of 17 mm height and diameter were extracted from the outer part of the fruit. A disk with a hole which had almost the same size as the samples was made; and the cylindrical samples were confined in it one by one. A probe of 15.3 mm diameter was compressed on the samples by 2.5 mm at a rate of 20 mm/min. Juiciness and hardness of the samples were recorded. Juiciness was defined by the area of the juice spot that spread on a filter paper during the test (in cm2). The slope between 1/3 and 2/3 of the maximum force of the force–deformation curve was used to determine hardness (in kN/m) (Huang and Lu 2010).
The 5 cm2 spot area and 40 kN/m compression force were considered as threshold values of the juiciness and hardness, respectively (Huang and Lu 2010). Apples with a juiciness area below 5 cm2 and a hardness value less than 40 kN/m were considered as mealy; and the others were labeled as non-mealy apples. Thus, we had two classes of apples regarding mealiness and tried to classify them using the acoustic method and machine learning technique described in the next subsections.
The destructive procedure was applied to all the 180 apples after non-destructive acoustic measurements.
Acoustic measurements
A plastic ball pendulum was used as the impact device. The diameter and mass of the ball was 17 mm and 3.3 g, respectively. For the impact tests, the ball was released from a height of 95 mm. A microphone was installed near the sample, on the opposite side of the impact point to record the impact response.
In this study, the acoustic signals were recorded using BSWA equipment including a data acquisition system (Model MC3022), two microphones (Model MA231) and two amplifiers (Model MP201). All signals were saved on a desktop computer, using Scope V1.32 software. Before beginning the measurement, microphone calibration was performed by a calibrator (Model CA111).
Visual representation of signals
In this research, an alternative approach based on visual representation of the sound signal was used for apple mealiness detection. There are different methods to convert sound signal to texture image. The spectrogram which conveys the signal strength is known as a good visual representation of the audio signal (Deshpande et al. 2001). For this purpose, each impact signal was converted into a spectrogram image using the short time Fourier transform (STFT) with the hamming window and 50% overlap between adjacent windows.
Image pre-processing
As mentioned before, the DL approaches have many advantages; however, the drawback of them is the overfitting problem. Data augmentation can prevent overfitting when the image dataset is small (Krizhevsky et al. 2012); it can also improve the overall learning procedure and performance (Kamilaris and Prenafeta-Boldú 2018). As the dataset of this study had a limited number of images, it was artificially enlarged using label-preserving transformations such as image translation, rotation and reflection.
Since the images’ size of the dataset was different with the required image size for the CNNs’ input, they were resized to match the input size of each network.
Structure of pre-trained CNNs
Similar to ANN, CNN architecture is composed of some computational layers such as the convolutional layer (Conv layer), pooling layer and fully-connected layer (FC layer). The Conv layer is the main part of the structure; its kernels (or filters) perform convolutional operation on the input image and create output image representations (i.e. feature maps). The pooling layer follows a Conv layer and reduces dimension of the feature maps, number of parameters and training time. The FC layers are often used as classifiers which exploit the high-level features learned to classify input images.
To create non-linearity in the network, the result of the convolution is passed through an activation function such as Rectified Linear Units (ReLU). In addition, CNNs usually use dropout regularization to reduce overfitting in the FC layers (Krizhevsky et al. 2012).
The structure of the two pre-trained CNNs used in this study, is briefly described in the following subsections. Both the networks have been primarily trained on the ImageNet dataset1 to classify 1000 object categories such as plants, animals, tools, etc.
AlexNet (Krizhevsky et al. 2012) is the first CNN which was successfully applied onto image recognition and classification problems and won the ImageNet Large Scale Visual Recognition Challenge (ILSVRC) in 2012 with an error rate of 16.4% (Russakovsky et al. 2015). In addition to input and output layers, AlexNet has eight layers, five Conv layers and three FC layers. Max-pooling layers are used after some of the Conv layers. The activation function (ReLU) is applied to the output of every Conv and FC layer. AlexNet takes advantage of using Dropout regularization in the first two FC layers to reduce overfitting. The last FC layer feeds a 1000-way sofmax, which creates the probabilistic distribution over the 1000 classes. The size of input images for the network is 227 × 227 × 3. The network consists of 60 million parameters and 650,000 neurons.
VGGNet (Simonyan and Zisserman 2015), is another famous pre-trained CNN which was the runner up of the 2014 ILSVRC with an error rate of 7.3% (Russakovsky et al. 2015). This CNN was developed with the aim of investigating the effect of increasing the convolutional network depth on its performance. There are two versions for this network, VGG16 containing 13 Conv layers and 138 million parameters and VGG19 with 16 Conv layers and 144 million parameters. Beside the Conv layers, they both have five max-pooling layers, three FC layers and a softmax layer in the output. The input images to this network have to have a fixed-size of 224 × 224 × 3. Similar to AlexNet, VGGNet are also equipped with the ReLU and Dropout layers. Since VGGNet is a very deep network, to reduce the number of parameters, small size filters of 3 × 3 in Conv layers have been used. Moreover, VGGNet has a higher number of parameters than AlexNet, which makes it computationally more expensive. In this study, we used VGG19 network.
Fine-tuning the pre-trained networks
The described CNNs have been primarily developed for classifying 1000 categories of objects from the ImageNet dataset. Therefore, for the classification problem of this study, all their layers except the last three layers were transferred. The three layers were replaced with a FC layer, a softmax layer and a classification output layer which was conformable with the new classes. The initial learning rate was set to 0.0001; the weight learning rate and the bias learning rate for the FC layer were both set to 20. The networks were trained using stochastic gradient descent with momentum.
In order to investigate the influence of various setting parameters for training the networks, different number of mini-batches,2 5, 10 and 20, and different epochs,3 30, 40 and 50 were used to train the CNNs. As the dataset of the study was small, for the investigation, all the images were used for training (70% train and 30% validation). The training of each setting was repeated 10 times, and the average validation accuracy (VA), error (loss) and training time were recorded.
After selecting the optimal setting for training of each network, the dataset was divided into three subsets, train (65%), validation (15%) and test (unseen data) (20%); and the networks with the selected settings were run with 10 replications on the data. The average classification accuracy (CA), VA, training time and classification time were reported.
The procedure was implemented in MATLAB software (Version 9.4, R2018a, the Mathworks Company, Natick, MA, USA) using Neural Network Toolbox and particular toolbox of each pre-trained network. As computing hardware, a personal computer equipped with an Intel® CPU Core™ i5-6400 (2.70 GHz) processor, 16 GB memory, Intel® HD Graphics 530 and 64-bit Windows 7 operating system, was employed.
Results and discussion
Destructive tests results
Effect of storage condition on hardness and juiciness of Red Delicious apple is shown in Fig. 1. The figure clearly shows that the storage had significant effect on the two textural characteristics of the fruit comparing with the untreated apples (Harvest samples). Among the storage treatments, the attributes for Cold 1 (i.e. storing at 6 °C and 50% RH for 1 month) was more toward those of the untreated apples. Figure 1 also specifies the samples which fell into the classes of mealy and non-mealy. Lower-left quarter of the graph is the area of mealy class and the other parts are for the non-mealy class. All samples of the Harvest group, nearly two-thirds of the Cold 1 group and a few of the Room 1 group, were non-mealy. On the other hand, all the samples of the Cold 2, about all of the Room 2, most of the Room 1 and almost one-third of the Cold 1 placed in the mealy class.
Fig. 1.
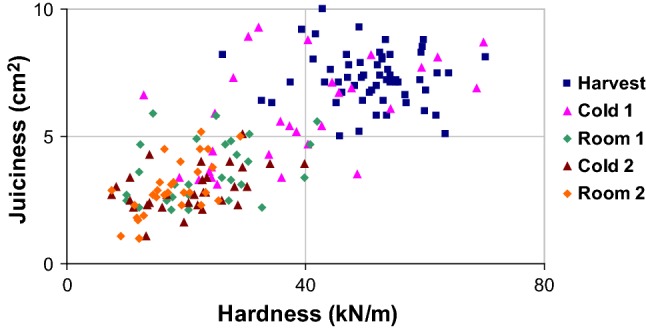
Effect of the storage condition on the results of the destructive confined compression test
Table 1 shows the effect of the storage condition on the hardness and juiciness as obtained via an analysis of variance (ANOVA). The analysis revealed that the storage had significant effect (P < 0.01) on the both parameters. The average values of the hardness and juiciness were compared by means of the Duncan’s test and results are illustrated in Fig. 2. This figure also shows that the storage conditions of Room 1, Cold 2 and Room 2 caused mealiness in apples during the storage. The average hardness and juiciness of the groups Harvest and Cold 1 were significantly higher than the others. The average values of the characteristics for the other three groups were not so different.
Table 1.
Analysis of variance of the effect of the storage on the apple hardness and juiciness
| Source | Dependent variable | df | Mean square | F value |
|---|---|---|---|---|
| Storage condition | Hardness | 4 | 9409.527 | 91.385** |
| Juiciness | 4 | 173.865 | 103.099** | |
| Error | Hardness | 175 | 102.965 | – |
| Juiciness | 175 | 1.686 | – | |
| Total | Hardness | 180 | – | – |
| Juiciness | 180 | – | – |
**Significant at 1%
Fig. 2.

Means comparison of the destructive parameters (means with common letters are not significantly different according to the Duncan’s test)
Classification results
Table 2 summarizes performance of AlexNet and VGGNet for classification of mealy and non-mealy apples during training with different setting parameters. For AlexNet, number of mini-batches did not make significant difference in case of classification accuracy of validation data (VA); except for epoch 30 in which increasing number of mini-batches increased VA. Loss for training the network with 20 mini-batches was much less than with the two others. Training time required per epoch was higher for higher numbers of mini-batches. Training the network with increased number of epochs did not increase VA and did not decrease Loss remarkably (excluding 5 mini-batches from epoch 30 to epoch 40).
Table 2.
Effects of the setting parameters for training the CNNs on their performance (the values followed by ± indicate the standard deviation)
| No of training epochs | 30 | 40 | 50 | 30 | 40 | 50 |
|---|---|---|---|---|---|---|
| AlexNet | VGG19 | |||||
| VA (%) | VA (%) | |||||
| No of mini-baches | ||||||
| 5 | 88.89 ± 4.18 | 92.22 ± 4.84 | 93.15 ± 2.48 | 91.85 ± 2.79 | 90.33 ± 4.22 | 92.78 ± 3.54 |
| 10 | 90.00 ± 3.72 | 91.30 ± 3.15 | 92.78 ± 4.14 | 91.48 ± 4.26 | 92.18 ± 3.44 | 90.94 ± 4.76 |
| 20 | 93.33 ± 1.99 | 92.22 ± 2.44 | 92.59 ± 2.89 | 90.81 ± 2.97 | 90.13 ± 5.48 | 89.63 ± 3.51 |
| Loss | Loss | |||||
| 5 | 0.31 ± 0.14 | 0.19 ± 0.07 | 0.20 ± 0.06 | 0.23 ± 0.15 | 0.27 ± 0.15 | 0.27 ± 0.23 |
| 10 | 0.22 ± 0.09 | 0.21 ± 0.11 | 0.19 ± 0.11 | 0.27 ± 0.21 | 0.14 ± 0.08 | 0.18 ± 0.11 |
| 20 | 0.10 ± 0.03 | 0.09 ± 0.04 | 0.12 ± 0.05 | 0.19 ± 0.14 | 0.21 ± 0.16 | 0.19 ± 0.13 |
| Training time (s/epoch) | Training time (s/epoch) | |||||
| 5 | 11.82 ± 0.49 | 10.92 ± 0.25 | 10.74 ± 0.19 | 148.08 ± 14.39 | 150.4 ± 4.34 | 140.22 ± 8.45 |
| 10 | 12.84 ± 2.55 | 15.78 ± 0.40 | 15.90 ± 0.51 | 197.76 ± 1.38 | 192.40 ± 21.64 | 188.88 ± 4.45 |
| 20 | 25.02 ± 0.29 | 25.62 ± 1.33 | 27.48 ± 1.26 | 263.33 ± 21.15 | 282.34 ± 27.18 | 276.54 ± 35.90 |
VA validation accuracy, Loss the error of the model
To sum up, for training AlexNet in this research, mini-batches number of 20 can be suggested; and training with 30 epochs would be enough.
For VGGNet, there was not specific trend for effect of mini-batch size on VA. Yet, mini-batches numbers of 5 and 10 showed slightly better results. Except for epoch 30, Loss of mini-batches number of 10 was less than that of the others. Training speed decreased with increasing the number of mini-batches. Number of epochs in the range of 30–50 did not have significant effect on VA; it did not affect Loss of mini-batches numbers of 5 and 20 either. The least value for Loss was obtained for mini-batches number of 10 and epoch 40.
In conclusion, for training of VGGNet for the purpose of this study, 10 mini-batches and 40 epochs or more are recommended.
Finally, the two settings for training the networks, AlexNet (20 mini-batches and 30 epochs) and VGGNet (10 mini-batches and 40 epochs) were chosen to apply to the dataset which included test subset. The results obtained for classification of mealy and non-mealy apples are listed in Table 3. As it can be seen, even though VGGNet is deeper than AlexNet, but its CA was lower. CAs for AlexNet and VGGNet were obtained 91.11% and 86.94%, respectively. In addition, VGGNet required much more time for training and classification of the images than AlexNet (Tables 2, 3).
Table 3.
Performance of the selected settings for training the CNNs and apple mealiness classification
| Network | CA (%) | VA (%) | Training time (s/epoch) | Classification time (s/image) |
|---|---|---|---|---|
| AlexNet | 91.11 | 91.92 | 19.82 | 0.0237 |
| VGG19 | 86.94 | 90.39 | 128.04 | 0.2274 |
CA classification accuracy, VA validation accuracy
As mentioned before, several studies have focused on the confined compression test as a destructive mealiness detection approach. This method is inefficient to quantify mealiness levels in fruit (Huang et al. 2012). Thus, it is necessary to develop novel methods for effective mealiness discrimination.
Overall, the combination of the acoustic and deep learning techniques provided a promising method for non-destructive classification of the apples according to mealiness. However, the classification accuracies need to be improved. Since the dataset of the current study was relatively small, using more training data may further improve the performance of the method.
Huang and Lu (2010) concluded that using fruit samples with greater range of mealiness can lead to better classification accuracies. In this work, some of the stored groups had samples in both the classes (such as Cold 1 and Room 1) (Fig. 1) which indicates that there was a small variability in mealiness within the groups. Therefore, choosing such treatment conditions for the storage that creates more recognizable mealiness, can improve the accuracy of the proposed method.
As reviewed in “Introduction” section, different methods have been employed for apple mealiness detection in the literature. Table 4 lists the previous works and their performance together with the results of this study.
Table 4.
Comparison of different methods used for apple mealiness detection
| Method | Cultivar | Groups | Classifier | Accuracy (%) | Reference |
|---|---|---|---|---|---|
| Time resolved spectroscopy | Cox | Mealy and non-mealy | DA | 80 | Valero et al. (2005) |
| Ultrasonic | Cox | Fresh and overripe mealiness | LDA | 94.2 | Bechar et al. (2005) |
| Magnetic resonance imaging | Top-Red | Fresh, intermediate and mealy | SDA | 87.5 | Barreiro et al. (2000) |
| Hyperspectral imaging | Red Delicious | Mealy and non-mealy | PLS-DA | 86.7 | Huang and Lu (2010) |
| Biospeckle imaging | Red Delicious | Fresh and semi-mealy | ANN | 79.8 | Arefi et al. (2016) |
| Fluorescence | Jonagold | Mealy, mid-mealy and non-mealy | SOM | 90 | Moshou et al. (2003) |
| Impact response | Golden Delicious | Mealy and healthy | DA | 80 | Arana et al. (2004) |
| Impact response | Red Delicious | Mealy and non-mealy | CNN-AlexNet | 91.1 | This study |
| Impact response | Red Delicious | Mealy and non-mealy | CNN-VGG19 | 86.9 | This study |
DA discriminant analysis, LDA linear discriminant analysis, SDA stepwise discriminant analysis, PLS-DA partial least squares discriminant analysis, ANN artificial neural networks, SOM self-organizing map, CNN convolutional neural networks
As it can be observed from Table 4, the results obtained using the proposed method, are comparable with -and in many cases better than- those of the previous works. Among the listed works, one conducted by Bechar et al. (2005) who applied ultrasonic sensing and linear discriminant analysis (LDA) for the classification, yielded the best overall accuracy. Nevertheless, using the method did not provide acceptable result for other apple cultivars such as Jonagold (Bechar et al. 2005).
The results of this study outperformed the findings of the previous investigations on Red Delicious apple (Huang and Lu 2010; Arefi et al. 2016) and also that of the research which employed the impact response sensing (Arana et al. 2004). For classifying Red Delicious cultivar with respect to mealiness, Huang and Lu (2010) obtained a classification accuracy of 86.7% using a hyperspectral imaging system and the partial least squares discriminant analysis (PLS-DA); while the best performance reported by Arefi et al. (2016) based on using a biospeckle imaging method and ANN was 79.8%. Similar to the current study, Arana et al. (2004) applied the impact response analysis for the mealiness detection; but they used the method for Golden Delicious apple and their statistical procedure was the discriminant analysis (DA). The best classification accuracy reported by them, was 80%.
The results showed that the proposed method in this study was effective for apple mealiness detection in a non-destructive manner. The analysis indicated that CA of AlexNet was about 4% higher than that of VGGNet.
Accuracy is not the only criterion for evaluation of a method. Other criteria would be simplicity, robustness and being low-cost. The non-destructive techniques used in the previous studies for the mealiness detection, are mostly expensive methods (Arefi et al. 2015). On the other hand, design and application of an acoustic sensing system is simple, inexpensive and rapid in comparison with the other systems used in the literature. Therefore, based on the good results obtained in this research, the proposed method can be considered as a low-cost tool for applications like monitoring the fruit quality during storage, on-line sorting and estimation of proper harvest date. Considering the climate change and its effect on varying the harvest time of fruit, the latter application may find more importance.
Conclusion
This research dealt with application of a novel method for mealiness assessment in Red Delicious apple using acoustic measurements and convolutional neural networks (CNNs). We compared performance of two famous pre-trained CNNs with different depths (AlexNet and VGGNet which the latter is deeper), for classification of apples in two classes, mealy and non-mealy.
Promising results obtained using the proposed approach so that it outperformed the previous related works. Between the two networks, AlexNet showed superior ability for the classification of mealy and non-mealy apples. Using more data for training the networks can potentially improve the obtained accuracies. We conclude that using an acoustic sensing system in combination with a CNN classifier provides a promising, rapid, inexpensive and simple tool for mealiness detection in apple fruit non-destructively. AlexNet is recommended as the classifier, because it showed better performance in terms of the classification accuracy, training and classification speed comparing to VGGNet.
Acknowledgments
We would like to thank Arak University, Arak, Iran, for providing facilities and financial support for this project.
Compliance with ethical standards
Conflict of interest
The authors do not declare any conflict of interest.
Footnotes
The ImageNet dataset contains 1,281,167 training images and 50,000 test images, with each image labeled with one of 1000 classes (Deng et al. 2009).
A mini-batch is a subset of the training set that is used to evaluate the gradient of the loss function and update the weights.
An epoch is a full training cycle on the entire training data set.
Publisher's Note
Springer Nature remains neutral with regard to jurisdictional claims in published maps and institutional affiliations.
References
- Arana I, Jarén C, Arazuri S. Apple mealiness detection by non-destructive mechanical impact. J Food Eng. 2004;62(4):399–408. doi: 10.1016/S0260-8774(03)00256-5. [DOI] [Google Scholar]
- Arefi A, Moghaddam PA, Mollazade K, Hassanpour A, Valero C, Gowen A. Mealiness detection in agricultural crops: destructive and nondestructive tests—a review. Compr Rev Food Sci Food Saf. 2015;14(5):657–680. doi: 10.1111/1541-4337.12152. [DOI] [Google Scholar]
- Arefi A, Moghaddam PA, Hassanpour A, Mollazade K, Motlagh AM. Non-destructive identification of mealy apples using biospeckle imaging. Postharvest Biol Technol. 2016;112:266–276. doi: 10.1016/j.postharvbio.2015.09.001. [DOI] [Google Scholar]
- Barreiro P, Ortiz C, Ruiz-Altisent M, Ruiz-Cabello J, Fernández-Valle ME, Recasens I, Asensio M. Mealiness assessment in apples and peaches using MRI techniques. Magn Reson Imaging. 2000;18(9):1175–1181. doi: 10.1016/S0730-725X(00)00179-X. [DOI] [PubMed] [Google Scholar]
- Bechar A, Mizrach A, Barreiro P, Landahl S. Determination of mealiness in apples using ultrasonic measurements. Biosyst Eng. 2005;91(3):329–334. doi: 10.1016/j.biosystemseng.2005.04.008. [DOI] [Google Scholar]
- Bourne M. Food texture and viscosity: concept and measurement. London: Academic Press; 2002. [Google Scholar]
- Corollaro ML, Aprea E, Endrizzi I, Betta E, Demattè ML, Charles M, Bergamaschi M, Costa F, Biasioli F, Grappadelli LC, Gasperi F. A combined sensory-instrumental tool for apple quality evaluation. Postharvest Biol Technol. 2014;96:135–144. doi: 10.1016/j.postharvbio.2014.05.016. [DOI] [Google Scholar]
- Deng J, Dong W, Socher R, Li L-J, Li K, Fei-Fei L (2009) ImageNet: a large-scale hierarchical image database. In: CVPR09
- Deshpande H, Singh R, Nam U (2001) Classification of music signals in the visual domain. In: Proceedings of the COST-G6 conference on digital audio effects, pp 1–4. 6 Dec 2001
- Dyrmann M, Karstoft H, Midtiby HS. Plant species classification using deep convolutional neural network. Biosyst Eng. 2016;151:72–80. doi: 10.1016/j.biosystemseng.2016.08.024. [DOI] [Google Scholar]
- Fuentes A, Yoon S, Kim SC, Park DS. A robust deep-learning-based detector for real-time tomato plant diseases and pests recognition. Sensors (Basel) 2017;17(9):2022. doi: 10.3390/s17092022. [DOI] [PMC free article] [PubMed] [Google Scholar]
- Gómez AH, Wang J, Pereira AG. Impulse response of pear fruit and its relation to Magness–Taylor firmness during storage. Postharvest Biol Technol. 2005;35(2):209–215. doi: 10.1016/j.postharvbio.2004.07.006. [DOI] [Google Scholar]
- Huang M, Lu R. Apple mealiness detection using hyperspectral scattering technique. Postharvest Biol Technol. 2010;58(3):168–175. doi: 10.1016/j.postharvbio.2010.08.002. [DOI] [Google Scholar]
- Huang M, Zhu Q, Wang B, Lu R. Analysis of hyperspectral scattering images using locally linear embedding algorithm for apple mealiness classification. Comput Electron Agric. 2012;89:175–181. doi: 10.1016/j.compag.2012.09.003. [DOI] [Google Scholar]
- Kamilaris A, Prenafeta-Boldú FX. Deep learning in agriculture: a survey. Comput Electron Agric. 2018;147:70–90. doi: 10.1016/j.compag.2018.02.016. [DOI] [Google Scholar]
- Krizhevsky A, Sutskever I, Hinton GE (2012) ImageNet classification with deep convolutional neural networks. In: Advances in neural information processing systems. Curran Associates, Inc., Lake Tahoe, pp 1097–1105. 10.1016/j.protcy.2014.09.007
- LeCun Y, Bengio Y, Hinton G. Deep learning. Nature. 2015;521(7553):436–444. doi: 10.1038/nature14539. [DOI] [PubMed] [Google Scholar]
- Lu Y, Yi S, Zeng N, Liu Y, Zhang Y. Identification of rice diseases using deep convolutional neural networks. Neurocomputing. 2017;267:378–384. doi: 10.1016/j.neucom.2017.06.023. [DOI] [Google Scholar]
- Mehdipour Ghazi M, Yanikoglu B, Aptoula E. Plant identification using deep neural networks via optimization of transfer learning parameters. Neurocomputing. 2017;235:228–235. doi: 10.1016/j.neucom.2017.01.018. [DOI] [Google Scholar]
- Mendoza F, Lu R, Cen H. Grading of apples based on firmness and soluble solids content using VIS/SWNIR spectroscopy and spectral scattering techniques. J Food Eng. 2014;125:59–68. doi: 10.1016/j.jfoodeng.2013.10.022. [DOI] [Google Scholar]
- Moshou D, Wahlen S, Strasser R, Schenk A, Ramon H. Apple mealiness detection using fluorescence and self-organising maps. Comput Electron Agric. 2003;40(1):103–114. doi: 10.1016/S0168-1699(03)00014-0. [DOI] [Google Scholar]
- Ortíz C, Barreiro P, Correa E, Riquelme F, Ruiz-Altisent M. Non-destructive identification of woolly peaches using impact response and near-infrared spectroscopy. J Agric Eng Res. 2001;78(3):281–289. doi: 10.1006/jaer.2000.0570. [DOI] [Google Scholar]
- Pan SJ, Yang Q. A survey on transfer learning. IEEE Trans Knowl Data Eng. 2010;22(10):1345–1359. doi: 10.1109/TKDE.2009.191. [DOI] [Google Scholar]
- Russakovsky O, Deng L, Su H, Krause J, Satheesh S, Ma S, Huang Z, Karpathy A, Khosla A, Bernstein M, Berg AC, Fei-Fei L. ImageNet large scale visual recognition challenge. Int J Comput Vis. 2015;115(3):211–252. doi: 10.1007/s11263-015-0816-y. [DOI] [Google Scholar]
- Seppä L, Peltoniemi A, Tahvonen R, Tuorila H. Flavour and texture changes in apple cultivars during storage. LWT Food Sci Technol. 2013;54:500–512. doi: 10.1016/j.lwt.2013.06.012. [DOI] [Google Scholar]
- Shen Y, Zhou H, Li J, Jian F, Jayas DS. Detection of stored-grain insects using deep learning. Comput Electron Agric. 2018;145:319–325. doi: 10.1016/J.COMPAG.2017.11.039. [DOI] [Google Scholar]
- Simonyan K, Zisserman A (2015) Very deep convolutional networks for large-scale image recognition. In: International conference on learning representations (ICLR 2015). ICLR, San Diego, pp 1–14. 10.1016/j.infsof.2008.09.005
- Suh HK, IJsselmuiden J, Hofstee JW, van Henten EJ. Transfer learning for the classification of sugar beet and volunteer potato under field conditions. Biosyst Eng. 2018;174:50–65. doi: 10.1016/j.biosystemseng.2018.06.017. [DOI] [Google Scholar]
- Tang J, Wang D, Zhang Z, He L, Xin J, Xu Y. Weed identification based on K-means feature learning combined with convolutional neural network. Comput Electron Agric. 2017;135:63–70. doi: 10.1016/j.compag.2017.01.001. [DOI] [Google Scholar]
- Tiplica T, Vandewalle P, Verron S, Grémy-Gros C, Mehinagic E (2010) Identification of apple varieties using acoustic measurements. In: Conférence Internationale en Métrologie (CAFMET’10)
- Valero C, Barreiro P, Ruiz-Altisent M, Cubeddu R, Pifferi A, Taroni P, Torricelli A, Valentini G, Johnson D, Dover C. Mealiness detection in apples using time resolved reflectance spectroscopy. J Texture Stud. 2005;36(4):439–458. doi: 10.1111/j.1745-4603.2005.00026.x. [DOI] [Google Scholar]
- Zdunek A, Cybulska J, Konopacka D, Rutkowski K. Evaluation of apple texture with contact acoustic emission detector: a study on performance of calibration models. J Food Eng. 2011;106(1):80–87. doi: 10.1016/j.jfoodeng.2011.04.011. [DOI] [Google Scholar]
- Zhang W, Cui D, Ying Y. Nondestructive measurement of pear texture by acoustic vibration method. Postharvest Biol Technol. 2014;96:99–105. doi: 10.1016/j.postharvbio.2014.05.006. [DOI] [Google Scholar]
- Zude M. Optical monitoring of fresh and processed agricultural crops. Boca Raton: CRC Press; 2008. [Google Scholar]