Abstract
Jabuticaba (Myrciaria cauliflora) is a dark berry, endemic to the south and central regions of South America, rich in anthocyanins and polyphenols. This study evaluated the ultrasound-assisted extraction of bioactive compounds from jabuticaba peel, developed a new mathematical model for the process, and estimated the model parameters. Extraction was carried out using water as solvent aiming its direct use in food formulations. The main anthocyanin (cyanidin-3-O-glucoside) and the main polyphenol (ellagic acid) from jabuticaba peel were extracted and quantified by LC–MS and HPLC. The results indicate that lowering the pH increased the extraction of the anthocyanin and had only slight effect on the extraction of ellagic acid. The application of ultrasound at 25 kHz favored the extraction of both compounds. Processing time of 20 min increased the yield of both compounds, while over processing (> 20 min) let to the sonochemical-induced hydrolysis of cyanidin-3-O-glucoside and ellagic acid. The highest yield of bioactive compounds was attained at 25 kHz, 20 min of extraction and pH 1.5 (8.9 mg/g dry peel of gallic acid equivalent, 0.9 mg/g dry peel of ellagic acid, and 7.9 mg/g dry peel of cyanidin-3-O-glucoside). The new mathematical model considered the mass transfer between the powder and the liquid media, and the sonochemical-induced hydrolysis of the compound. The model was able to predict satisfactorily the extraction process and the hydrolysis effect.
Keywords: Jabuticaba, Cyanidin, Ellagic acid, Modeling, Extraction
Introduction
Jabuticaba (Myrciaria cauliflora) is a native plant from the south and central regions of South America. Its fruits measures from 2 to 4 cm in diameter and contains up to four seeds. The fruit has a white soft juicy pulp, has sweet, but acidic flavor (pH ~ 4.5) and has a dark purple color. The pulp is rich in minerals and ascorbic acid (Teixeira et al. 2011), while the dark peel is rich in polyphenols and anthocyanins.
The main anthocyanins found in jabuticaba is cyanidin-3-O-glucoside (Einbond et al. 2004; Santos et al. 2010), which has well-described biological properties including antioxidant, anti-obesity, anti-inflammatory and anti-diabetic properties (Leite et al. 2011; Wu et al. 2013). The anthocyanins are found in the fruit non-edible peel. Given its properties and its characteristic color, the peel is used to produce jams, ice cream and beverages. Among the polyphenols, jabuticaba is rich in ellagic acid (Alezandro et al. 2013).
Jabuticaba peel needs to be processed to be used in food formulations, since its colored pigments need to be extracted from the peel. Ultrasound-assisted extraction (UAE) could be used to extract its high valuable compounds since the enhancement of the mass transfer is obtained by acoustic-induced cavitation and its compression cycle (Rodrigues and Fernandes 2009). The main effect of the compression cycles is the disruption of the cell tissue increasing the access of the solvent to the target compounds resulting in an improvement of the extraction rate (Rodrigues et al. 2008; Fernandes and Rodrigues 2009; Araujo et al. 2013). A efficient extraction process maximizes the recovery of target biocompounds, reduces the degradation of these compounds, and uses environmentally friendly solvents, such as water (Santos et al. 2010).
Modeling of extraction processes can be done by simple empirical modeling that can predict the extraction results, such as neural networks (Skenderidis et al. 2017), or by more complex mechanistical modeling that can better explain the phenomena. Mechanistic models for extraction processes often rely on a first order kinetics or on Fick’s law of diffusion (Gerke et al. 2018). These models are useful for most conventional extraction technologies, but they do not predict the decay, degradation or secondary reaction that may occur during extraction when thermal or non-thermal technologies are applied, such as microwave-assisted extraction or ultrasound-assisted extraction (Zhu et al. 2018). To deal with both extraction and decomposition phenomena, models need to be further developed.
This study evaluates and models the ultrasound-assisted extraction of anthocyanins and phenolics from jabuticaba peels. Acidified water was used as a solvent because of its classification as a GRAS (generally recognized as safe) solvent. The effects of the main process operating conditions, such as pH, sonication time and ultrasound frequency on the recovery of ellagic acid and cyanidin-3-O-glucoside were evaluated. A mathematical model for the extraction process that considers the mass transfer of compounds and the decomposition of these compounds due to sonication was developed.
Materials and methods
Materials
Jabuticaba (Myrciaria cauliflora) fruits were bought from the Municipal Market at São Carlos (São Carlos, SP, Brazil). The peels were removed by hand and dried in an air-circulating oven for 24 h at 60 °C. The peels were milled (mean particle diameter of 300 µm) in an analytical mill and stored at room temperature.
Cyanidin chloride (CAS Number 528-58-5; > 95% purity), ellagic acid (CAS Number 476-66-4; > 95% purity), gallic acid (CAS Number 149-91-7; > 97.5% purity) and Folin–Ciocateau phenol reagent (MDL Number MFCD00132625) were bought from Sigma-Aldrich (Saint Louis, USA). Acetonitrile (CAS Number 75-05-8; > 99.9% purity) and methanol (CAS Number 67-56-1; > 99.9% purity), HPLC grade, were purchased from Tedia Company Inc. (Fairfield, USA). Hydrochloric acid (CAS Number 7647-01-0; 37% ACS specification), and sodium carbonate (CAS Number 497-19-8; > 99.5% purity) were bought from Synth (São Paulo, Brazil).
Ultrasound-assisted extraction
The extraction of anthocyanins and phenolics from the jabuticaba peels were carried out in an ultrasonic bath (Unique model USC25, Brazil). An amount of 4 g of peel was added to a Falcon tube along with 40 mL of acidified water (1:10 w/v ratio). The suspension was subjected to ultrasonic waves for 10, 20, 30 and 40 min. After extraction, the suspension was centrifuged at 4900 rpm for 5 min, and the supernatant was collected and analyzed.
Two ultrasonic baths were used, one working at 25 kHz with a power density of 50 W/L and one working at 40 kHz with a power density of 60 W/L. The power density of the ultrasonic baths was determined by the calorimetric method (Löning et al. 2002). The tubes containing the jabuticaba powder was placed in the center of the bath right above the ultrasound transducer.
The acidified water was produced at three levels of pH (1.5, 3.0 and 7.0) by addition of hydrochloric acid. Control experiments were carried out without the application of ultrasound and served to evaluate the effectiveness of the ultrasound-assisted extraction. The acidification of the water was studied because anthocyanins have higher stability at low pH.
Total phenolic content
The Folin–Ciocalteu method was applied to determine the total polyphenols content (Larrauri et al. 1997). A sample of 1.0 mL of the extracts was mixed with 1 mL of Folin–Ciocalteu reagent, 2 mL of distilled water, and 2 mL of 20% (w/v) sodium carbonate solution. After a 2 min incubation period, the absorbance was measured at 700 nm in a UV–Vis spectrophotometer (Thermos model Evolution 200, USA) using a quartz cuvette with optical pathwidth of 10 mm. Results were expressed as gallic acid equivalents (GAE). The relative uncertainty of the results were 1% (Skoog et al. 2017).
Determination of phenolics by LC–MS
This study employed the general procedure for screening of phenolics in plant materials (Lin and Harnly 2007). The screening used a LC-DAD-ESI/MS instrument (Varian HPLC, model 250 HPLC, USA) coupled with a diode array detector (DAD) and a mass spectrometer (Varian model 500-MS IT, USA). The separation was achieved with a Symmetry C18 column (5 μm, 250 × 4.6 mm, Waters Inc, USA) in a column oven set at 30 °C. The mobile phase consisted of a combination of A (0.1% formic acid aqueous solution) and B (0.1% formic acid in acetonitrile) at a flow rate of 0.4 mL/min. The gradient changed linearly from 10 to 26% of B (v/v) in 40 min, to 65% of B at 70 min, and finally to 100% of B at 71 min, holding it at of 100% B for 4 min. The DAD was set at 350, 270 and 520 nm for real-time read-out. The UV–Vis spectra were read from 190 to 650 nm.
Mass spectra were acquired using electrospray ionization in the positive (PI) and negative ionization modes (NI), mass range between 100 and 2000 amu, and fragmentation voltage of 80 V. The drying gas pressure was set at 2.4 bar, drying gas temperature at 370 °C, nebulizer gas pressure at 2.7 bar, spray shield voltages at 600 V, and capillary voltages at 3500 V. After a 50% split, the LC system was coupled to the MSD. The identification of the compounds was based on the mass spectrometry data for molecular ions.
Determination of ellagic acid and cyanidin-3-O-glucoside content
The quantification of ellagic acid and cyanidin-3-O-glucoside was carried out using a HPLC (Varian model 335, USA). The separation was achieved using a Zorbax SB-C18 column (3.5 μm, 150 × 4.6 mm, Agilent, USA) at a flow rate of 1.0 mL/min (Brito et al. 2007). The mobile phase consisted of 10% aqueous formic acid (solvent A) and 10% formic acid in methanol (solvent B). A linear gradient was applied from 12% of B to 25% of B during 32 min, to 60% of B during 48 min, to 100% of B during 50 min, held for 1 min, and then reduced back to 12% of B during 55 min. The UV–Vis detector collected the signal at 370 nm for ellagic acid and at 530 nm for cyanidin-3-O-glucoside. The relative uncertainty of the results were 0.5% (Skoog et al. 2017).
Mathematical modeling
The extraction process was modeled considering the extraction of bioactive compounds from the jabuticaba powder to the extraction medium and the degradation of these bioactive compounds due to the extraction process conditions. Two models were developed because anthocyanins and phenolics behaved differently regarding their decay rates. Anthocyanins decayed as a zero-order reaction (Eq. 1), while phenolics also decayed as a function of extraction time (Eq. 2).
| 1 |
| 2 |
where CA is the concentration of anthocyanin (cyanidin-3-O-glucoside) (mg/L), CP is the concentration of phenolics (ellagic acid) (mg/L), CmaxA is the maximal concentration of anthocyanin that could be achieved in the extraction (mg/L), CmaxP is the maximal concentration of phenolics that could be achieved in the extraction (mg/L), kA is the extraction rate constant for anthocyanin (mg/L/min), kP is the extraction rate constant for phenolics (mg/L/min), kdA is the decay rate constant for anthocyanin (min−1), kdP is the decay rate constant for phenolics (min−2), and t is the time (min).
The mathematical model was implemented in Python programming language version 3.7 using the Anaconda 2018 platform. The equation system was integrated using the 4° order Runge–Kutta method, and the model parameters were determined by applying the Levenberg–Marquardt method, available through the SciPy library version 1.2 for scientific computing.
Only part of the available data was used when estimating the model parameters. Half of the data obtained at 10 min and half of the data obtained at 30 min were not presented during the estimation of the parameters. This data was used to validate the model, by directly comparing the model predictions to the experimental measurements. Validation was done carrying out a F hypothesis test of whether the difference between predicted and real measurements was greater than a 95% level of confidence. The F-test was carried out after the estimation of the model parameters, also using the subroutine available in the SciPy library version 1.2 for scientific computing.
Optimization
The optimization of the process was carried out using the one-factor-at-a-time method, because pH and processing time are continuous variables while sonication frequency is a discrete variable having only three fixed values (0, 25 and 40 kHz).
Results and discussion
The chromatographic analysis of the extracts showed that ellagic acid and cyanidin-3-O-glucoside were the main compounds extracted from jabuticaba peel (Fig. 1). Cyanidin-3-O-glucoside ([M]+ m/z 449; RT 15.6 min) was the dominant anthocyanin, ellagic acid ([M]+m/z 303; RT 18.1 min) was the dominant polyphenol, and other compounds appeared only as traces. Figure 1 presents a representative chromatogram of the extracts, showing the peaks of cyanidin-3-O-glucoside and ellagic acid. The peaks shown in the chromatogram in residence times between 0 and 15 min refer mainly to sugars and not to phenolics nor anthocyanin compounds.
Fig. 1.
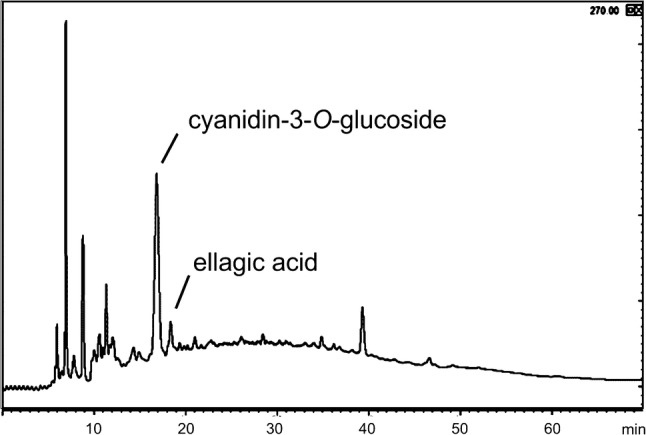
Chromatogram of the jabuticaba peel extract (pH = 1.5; sonicated at 25 kHz; processing time 40 min)
Figures 2, 3 and 4 present, respectively, the total phenolics, ellagic acid and cyanidin-3-O-glucoside content of the extractions carried out at three different pH, processing time and ultrasonic frequency. Water was a suitable solvent for the extraction of phenolics from jabuticaba peel, and its acidification had a slight influence on the extraction process.
Fig. 2.
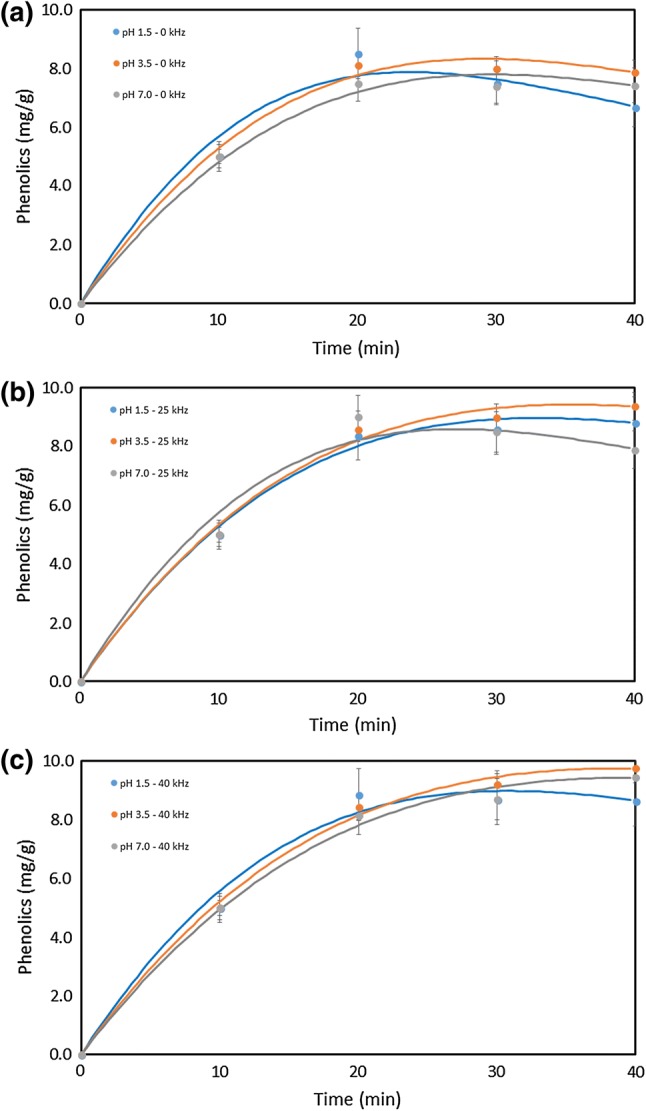
Extraction of total phenolics as a function of pH and processing time: a not subjected to sonication; b sonicated at 25 kHz; c sonicated at 40 kHz
Fig. 3.
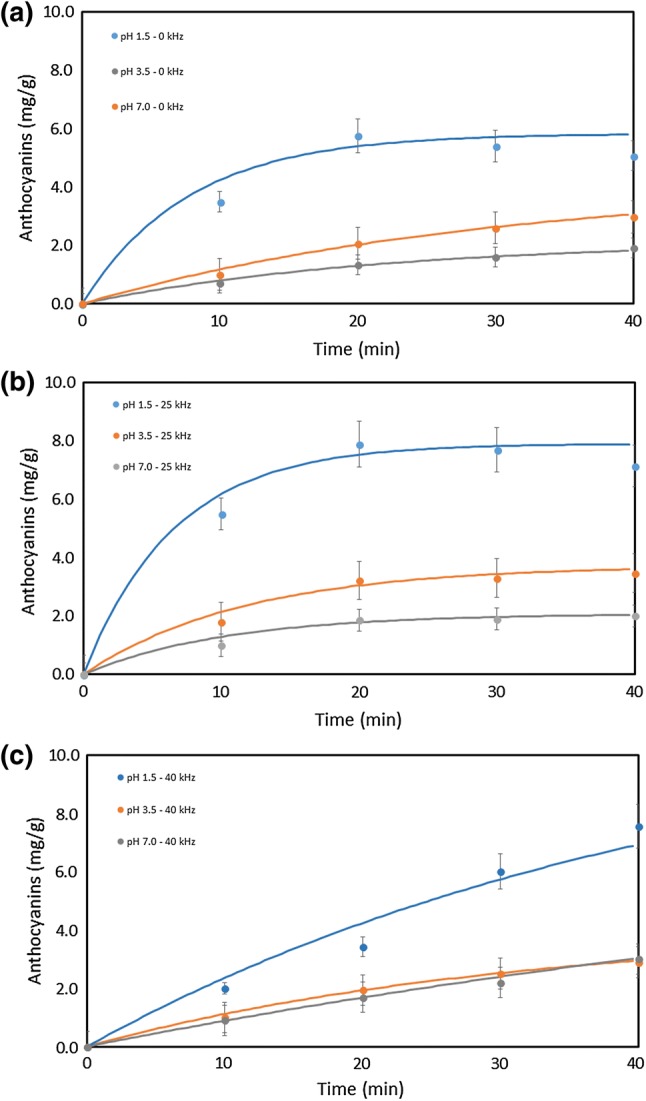
Extraction of cyanidin-3-O-glucoside as a function of pH and processing time: a not subjected to sonication; b sonicated at 25 kHz; c sonicated at 40 kHz
Fig. 4.
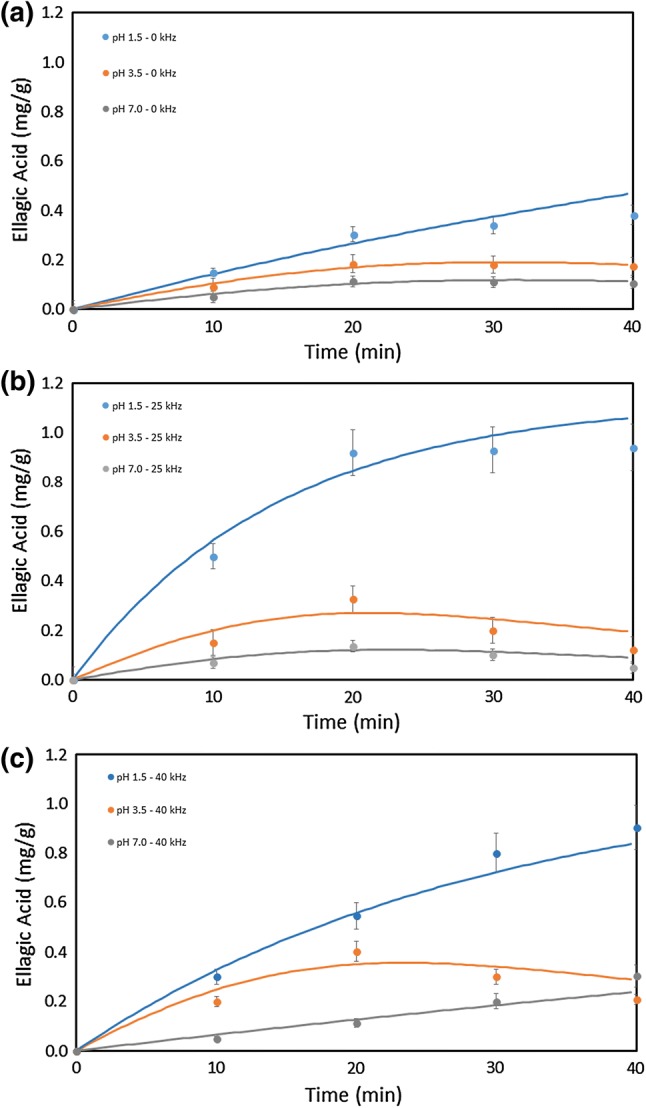
Extraction of ellagic acid as a function of pH and processing time: a not subjected to sonication; b sonicated at 25 kHz; c sonicated at 40 kHz
Effect of ultrasound-application
As an overall trend, the ultrasound-assisted extraction was able to extract more anthocyanins (cyanidin-3-O-glucoside) and polyphenols than the conventional process. The influence of ultrasound-assisted extraction in total phenolic content was small but positive.
Chemical decay of phenolics during extraction, without ultrasound assistance, was noted by the decrease in content from 20 to 40 min of processing time, which was more pronounced at lower pH values (Fig. 2). The use of ultrasound increased the total phenolic content as a function of processing time. Statistical analysis of mean at a 95% of confidence level showed that the processing time was a significant factor and that the ultrasonic frequency did not present a significant difference among the extractions (p < 0.05).
The concentration of cyanidin-3-O-glucoside (anthocyanin) in the extracts was generally higher for the extraction process carried out with the 25 kHz ultrasound, which resulted in the highest recovery of anthocyanin from the jabuticaba peel. The extraction carried out with ultrasound application recovered more anthocyanins than the control extraction (without ultrasound application), especially when carried out at 25 kHz or after 40 min of processing (Fig. 3). Statistical test of means showed that the extractions with and without ultrasound application were statistically different. The means obtained with ultrasound application were higher than the control experiments (without ultrasound application).
The concentration of ellagic acid in the extracts was higher for the extraction carried out with the 25 kHz ultrasound. The extraction carried out with ultrasound application recovered more of this phenolic compound, as observed for the extraction of cyanidin-3-O-glucoside. The recovery of ellagic acid was higher when carried out at 25 kHz or after 40 min of processing (Fig. 4). Statistical test of means showed that the extractions with and without ultrasound application were statistically different. The means obtained with ultrasound application were also higher than the control experiments (without ultrasound application).
The mass of cyanidin-3-O-glucoside recovered using the ultrasonic process (7.9 mg/g dry peel) was higher than the reported for high-pressure carbon dioxide assisted extraction (HPCDA), which obtained 2.2 mg/g of cyanidin-3-O-glucoside (Santos and Meireles 2011). The total phenolics content, however, was 31% lower than the reported for HPCDA (13 mg/g).
Effect of the acidified water pH
The influence of pH in the recovery of anthocyanin and ellagic acid was significant. The mass of anthocyanin and ellagic acid increased as pH decreased. These results indicate that both compounds decay at high pH (7.0) and that they should be extracted and stored at low pH (1.5). The recovery of anthocyanin decreased by 76% when pH went from 1.5 (acid) to 7.0 (neutral). The recovery of ellagic acid decreased even more drastically (89%) when pH went from 1.5 to 7.0. The results evidence the need for acidic conditions for the extraction and storage of the anthocyanin.
The pH peculiarly influences anthocyanins, because its structure can undergo reversible transformations in aqueous media. At pH 1 the flavylium cation predominates, while quinoidal species are predominant at pH values between 2 and 4. A carbinol pseudo base and a chalcone are observed at pH values between 5 and 6, respectively. Anthocyanins degrades at pH higher than 7 (Castañeda-Ovando et al. 2009). All these forms (flavylium, quinoidal, carbonol and charcone) coexist in equilibria but one of them is predominant at specific pHs. Our results indicate that the flavylium cation form is more easily extracted than the other forms, thus the process should be carried out at low pH.
In a related work, Rodrigues et al. (2015) studied the extraction of ellagic acid and cyanidin-3-O-glucoside from jabuticaba peel using an acidified ethanol solution. Their results showed that the influence of pH was very significant and that ethanol solution at pH 1.0 provided the highest extraction of anthocyanins and phenolics from the peel. Comparing the results obtained herein with the results from Rodrigues et al. (2015), it is possible to notice that the use of acidified water resulted in a higher yield of cyanidin-3-O-glucoside but lower yield of ellagic acid. The content of cyanidin-3-O-glucoside extracted with acidified water was 34% higher than using acidified ethanol. The content of ellagic acid, however, was 87% lower than using acidified ethanol. The results show a clear preference of cyanidin-3-O-glucoside towards extraction with water and of ellagic acid towards extraction with ethanol.
Mathematical modeling
Table 1 presents the kinetic rate parameters found for the extraction from jabuticaba peels of ellagic acid, cyanidin-3-O-glucoside, and total phenolics. The mathematical model presented a satisfactory fit to the experimental data due to the values of the statistical R2 parameter close to 1.0. Validation of the model was carried out with the whole dataset applying the F-test resulting in a level of confidence of 95%, which can also be seen visually thought the plots presented in Figs. 2, 3 and 4.
Table 1.
Kinetic rate parameters for the extraction of cyanidin-3-O-glucoside, ellagic acid and total phenolics from jabuticaba peel
| Ultrasonic frequency (kHz) | pH | Extraction rate ke (mg/L/min) | Decay rate kd (min−1) | Maximum concentrationa Cmax (mg/g) | R2 |
|---|---|---|---|---|---|
| Cyanidin-3-O-glucoside | |||||
| 0 | 1.5 | 0.757 | 0.037 | 11.6 | 0.997 |
| 0 | 3.5 | 0.099 | 0.035 | 11.6 | 0.996 |
| 0 | 7.0 | 0.138 | 0.017 | 11.6 | 0.997 |
| 25 | 1.5 | 1.202 | 0.049 | 11.6 | 0.999 |
| 25 | 3.5 | 0.318 | 0.058 | 11.6 | 0.998 |
| 25 | 7.0 | 0.201 | 0.079 | 11.6 | 0.998 |
| 40 | 1.5 | 0.263 | 0.005 | 11.6 | 0.996 |
| 40 | 3.5 | 0.128 | 0.019 | 11.6 | 0.999 |
| 40 | 7.0 | 0.093 | 0.003 | 11.6 | 0.998 |
| Ellagic acid | |||||
| 0 | 1.5 | 0.015 | 0.0005 | 1.13 | 0.997 |
| 0 | 3.5 | 0.012 | 0.0016 | 1.13 | 0.999 |
| 0 | 7.0 | 0.007 | 0.0016 | 1.13 | 0.998 |
| 25 | 1.5 | 0.078 | 0.0005 | 1.13 | 0.999 |
| 25 | 3.5 | 0.024 | 0.0033 | 1.13 | 0.998 |
| 25 | 7.0 | 0.010 | 0.0031 | 1.13 | 0.998 |
| 40 | 1.5 | 0.038 | 0.0005 | 1.13 | 0.999 |
| 40 | 3.5 | 0.031 | 0.0025 | 1.13 | 0.999 |
| 40 | 7.0 | 0.007 | 0.0005 | 1.13 | 0.998 |
| Total phenolics | |||||
| 0 | 1.5 | 0.774 | 0.0020 | 15.1 | 0.996 |
| 0 | 3.5 | 0.682 | 0.0013 | 15.1 | 0.980 |
| 0 | 7.0 | 0.608 | 0.0013 | 15.1 | 0.995 |
| 25 | 1.5 | 0.676 | 0.0009 | 15.1 | 0.990 |
| 25 | 3.5 | 0.680 | 0.0008 | 15.1 | 0.990 |
| 25 | 7.0 | 0.769 | 0.0014 | 15.1 | 0.985 |
| 40 | 1.5 | 0.726 | 0.0011 | 15.1 | 0.995 |
| 40 | 3.5 | 0.655 | 0.0006 | 15.1 | 0.999 |
| 40 | 7.0 | 0.614 | 0.0006 | 15.1 | 0.993 |
aMaximum concentration (Cmax) refer to the theoretical maximal concentration of component devoid of decay
The extraction process using the 25 kHz ultrasonic frequency presented a faster extraction kinetic rate than the 40 kHz ultrasonic frequency and the control extraction (without ultrasound application). Ultrasound at 25 kHz induces stronger cavitation in the liquid medium with a consequent increase in the breakdown of cells, which results in higher extraction of bioactive compounds from the cells (Rodrigues and Fernandes 2009).
The extraction rate of cyanidin-3-O-glucoside was higher than the extraction rate of ellagic acid, despite the higher concentration of cyanidin-3-O-glucoside in jabuticaba peel, denoting that cyanidin-3-O-glucoside is more accessible to extract from jabuticaba peel than ellagic acid. On the other hand, the decay rate of cyanidin-3-O-glucoside was also higher than the decay rate of ellagic acid, denoting that cyanidin-3-O-glucoside is less stable in aqueous solution than ellagic acid. The decay rate of cyanidin-3-O-glucoside subjected to sonication at 25 kHz was higher than its decay rate in the conventional extraction. Thus, a higher degradation of cyanidin-3-O-glucoside will occur during sonication.
Sonochemical-induced hydrolysis
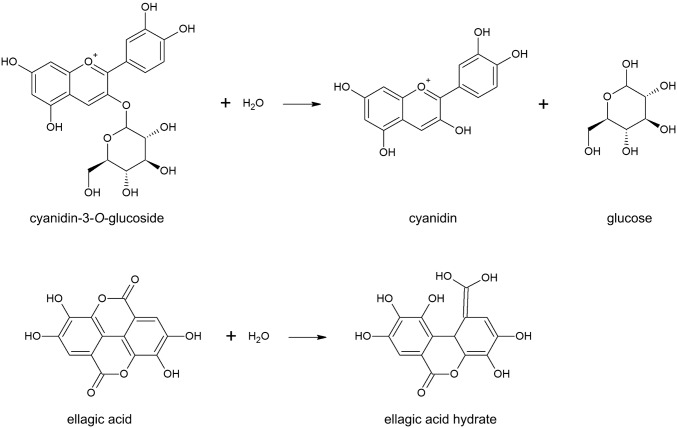
The possible mechanism of cyanidin-3-O-glucoside degradation is due to hydrolysis at the ether bond between cyanidin and the glucoside group (Fig. 5a), in a similar mechanism observed for the sonochemical hydrolysis of alpha-solanidine and alpha-chaconine into beta-solanidine and beta-chaconine (Alves-Filho et al. 2018). Therefore, if a higher concentration of cyanidin-3-O-glucoside is to be attained, the ultrasound-assisted extraction should be carried out for a short period (up to 10 min). Otherwise, the concentration of this molecule will decrease due to sonochemical degradation.
Fig. 5.
Reaction mechanism of the sonochemical hydrolysis of cyanidin-3-O-glucoside (a) and ellagic acid (b)
The decay rate of ellagic acid is significantly lower than the decay rate of cyanidin-3-O-glucoside because the sonochemical hydrolysis of ellagic acid depends on a ring opening reaction, which requires a higher amount of energy than the hydrolysis of the ether bond between cyanidin and the glucoside group (Fig. 5b).
Optimization
The pH of the extraction medium had a significant influence on the extraction rate. Lower pHs induced a higher extraction rate of cyanidin-3-O-glucoside, ellagic acid, and total phenolics, except for the extraction of phenolics at 25 kHz. The pH at 1.5 was de optimal pH for the extraction of both cyanidin-3-O-glucoside and ellagic acid.
The extraction rate of total phenolics has higher than the extraction rate of cyanidin-3-O-glucoside and ellagic acid (except for the ultrasound-assisted extraction at 25 kHz and pH 1.5) mostly because this rate constant is a weighted average of the individual extraction rates of all compounds that can be extracted by this technique. The determination of the extraction rate through mathematical modeling allows us to conclude that minor phenolic compounds in jabuticaba peel are extracted preferentially at pH ranging from 3.5 and 7.0; and that sonication does not affect the extraction of these minor compounds significantly, since the extraction rate coefficient of total phenolics under this pH range is much higher than the coefficients of ellagic acid and cyanidin-3-O-glucoside under the same pH range.
Conclusion
Ultrasound-assisted extraction has successfully extracted the major phenolic compounds in jabuticaba peel: ellagic acid and cyanidin-3-O-glucoside. Extraction time and solution pH were the most significant variables on the ultrasound-assisted extraction of these phenolic compounds. The extraction carried out subjected to sonication for 10 min at 25 kHz, and pH 1.5 was optimal for maximizing the extraction of cyanidin-3-O-glucoside, while the extraction carried out subjected to sonication for 20 min at 25 kHz and pH 1.5 was optimal to extract all major phenolic of the extract. The extraction yielded 8.9 mg/ g dry peel of gallic acid equivalent, 0.9 mg/g dry peel of ellagic acid, and 7.9 mg/g dry peel of cyanidin-3-O-glucoside. The mathematical model developed for the extraction process, and that considered the mass transfer of phenolics and product degradation presented a satisfactory fit to the experimental data (R2 > 0.98).
Acknowledgments
The authors acknowledge the financial support of the Brazilian funding agency Conselho Nacional de Desenvolvimento Científico e Tecnológico (CNPq), INCT Frutos Tropicais, and Fundação Cearense de Apoio ao Desenvolvimento Científico e Tecnológico (Funcap).
Footnotes
Publisher's Note
Springer Nature remains neutral with regard to jurisdictional claims in published maps and institutional affiliations.
References
- Alezandro MR, Dubé P, Desjardins Y, et al. Comparative study of chemical and phenolic compositions of two species of jaboticaba: Myrciaria jaboticaba (Vell.) Berg and Myrciaria cauliflora (Mart.) Berg. Food Res Int. 2013;54:468–477. doi: 10.1016/j.foodres.2013.07.018. [DOI] [Google Scholar]
- Alves-Filho EG, Sousa VM, Ribeiro PRV, et al. Single-stage ultrasound-assisted process to extract and convert alpha-solanine and alpha-chaconine from potato peels into beta-solanine and beta-chaconine. Biomass Convers Biorefinery. 2018;8:689–697. doi: 10.1007/s13399-018-0317-7. [DOI] [Google Scholar]
- Araujo GS, Matos LJBL, Fernandes JO, et al. Extraction of lipids from microalgae by ultrasound application: prospection of the optimal extraction method. Ultrasonics Sonochem. 2013;20:95–98. doi: 10.1016/j.ultsonch.2012.07.027. [DOI] [PubMed] [Google Scholar]
- Brito ES, Araújo MCP, Alves RE, et al. Anthocyanins present in selected tropical fruits: acerola, jambolão, jussara, and guajiru. J Agric Food Chem. 2007;55:9389–9394. doi: 10.1021/jf0715020. [DOI] [PubMed] [Google Scholar]
- Castañeda-Ovando A, Pacheco-Hernández ML, Páez-Hernández ME, et al. Chemical studies of anthocyanins: a review. Food Chem. 2009;113:859–871. doi: 10.1016/j.foodchem.2008.09.001. [DOI] [Google Scholar]
- Einbond LS, Reynertson KA, Luo XD, et al. Anthocyanin antioxidants from edible fruits. Food Chem. 2004;84:23–28. doi: 10.1016/S0308-8146(03)00162-6. [DOI] [Google Scholar]
- Fernandes FAN, Rodrigues S. Ultrasound applications in minimal processing. Stewart Postharvest Rev. 2009;5:1–7. doi: 10.2212/spr.2009.5.3. [DOI] [Google Scholar]
- Gerke IBB, Hamerski F, Scheer AP, Silva VR. Solid-liquid extraction of bioactive compounds from yerba mate (Ilex paraguariensis) leaves: experimental study, kinetics and modeling. J Food Process Eng. 2018;41:e12892. doi: 10.1111/jfpe.12892. [DOI] [Google Scholar]
- Larrauri JA, Rupérez P, Saura-Calixto F. Effect of drying temperature on the stability of polyphenols and antioxidant activity of red grape pomace peels. J Agric Food Chem. 1997;45:1390–1393. doi: 10.1021/jf960282f. [DOI] [Google Scholar]
- Leite AV, Malta LG, Riccio MF, et al. Antioxidant potential of rat plasma by administration of freeze-dried jaboticaba peel (Myrciaria jaboticaba Vell Berg) J Agric Food Chem. 2011;59:2277–2283. doi: 10.1021/jf103181x. [DOI] [PubMed] [Google Scholar]
- Lin L-Z, Harnly JM. A screening method for the identification of glycosylated flavonoids and other phenolic compounds using a standard analytical approach for all plant materials. J Agric Food Chem. 2007;55:1084–1096. doi: 10.1021/jf062431s. [DOI] [PMC free article] [PubMed] [Google Scholar]
- Löning JM, Horst C, Hoffmann U. Investigations on the energy conversion in sonochemical processes. Ultrasonics Sonochem. 2002;9:169–179. doi: 10.1016/S1350-4177(01)00113-4. [DOI] [PubMed] [Google Scholar]
- Rodrigues S, Fernandes FAN. Ultrasound-assisted extraction. Stewart Postharvest Rev. 2009;5:1–11. doi: 10.2212/spr.2009.5.1. [DOI] [Google Scholar]
- Rodrigues S, Pinto GAS, Fernandes FAN. Optimization of ultrasound extraction of phenolic compounds from coconut (Cocos nucifera) shell powder by response surface methodology. Ultrasonics Sonochem. 2008;15:95–100. doi: 10.1016/j.ultsonch.2007.01.006. [DOI] [PubMed] [Google Scholar]
- Rodrigues S, Fernandes FAN, de Brito ES, et al. Ultrasound extraction of phenolics and anthocyanins from jabuticaba peel. Ind Crops Prod. 2015;69:400–407. doi: 10.1016/j.indcrop.2015.02.059. [DOI] [Google Scholar]
- Santos DT, Meireles MAA. Optimization of bioactive compounds extraction from jabuticaba (Myrciaria cauliflora) skins assisted by high pressure CO2. Innov Food Sci Emerg Technol. 2011;12:398–406. doi: 10.1016/j.ifset.2011.02.004. [DOI] [Google Scholar]
- Santos DT, Veggi PC, Meireles MAA. Extraction of antioxidant compounds from Jabuticaba (Myrciaria cauliflora) skins: yield, composition and economical evaluation. J Food Eng. 2010;101:23–31. doi: 10.1016/j.jfoodeng.2010.06.005. [DOI] [Google Scholar]
- Skenderidis P, Petrotos K, Giavasis I, et al. Optimization of ultrasound assisted extraction of goji berry (Lycium barbarum) fruits and evaluation of extracts’ bioactivity. J Food Process Eng. 2017;40:e12522. doi: 10.1111/jfpe.12522. [DOI] [Google Scholar]
- Skoog DA, Holler FJ, Crouch SR. Principles of instrumental analysis. 7. Boston: Cengage Learning; 2017. [Google Scholar]
- Teixeira GHA, Durigan JF, Santos LO, et al. Changes in the quality of jaboticaba fruit (Myriciaria jaboticaba (Vell) Berg. cv. Sabará) stored under different oxygen concentrations. J Sci Food Agric. 2011;91:2844–2849. doi: 10.1002/jsfa.4530. [DOI] [PubMed] [Google Scholar]
- Wu SB, Wu J, Yin Z, et al. Bioactive and marker compounds from two edible dark-colored myrciaria fruits and the synthesis of jaboticabin. J Agric Food Chem. 2013;61:4035–4043. doi: 10.1021/jf400487g. [DOI] [PubMed] [Google Scholar]
- Zhu Y, Sun J, Xu D, et al. Investigation of (+)-catechin stability under ultrasonic treatment and its degradation kinetic modeling. J Food Process Eng. 2018;41:e12904. doi: 10.1111/jfpe.12904. [DOI] [Google Scholar]


