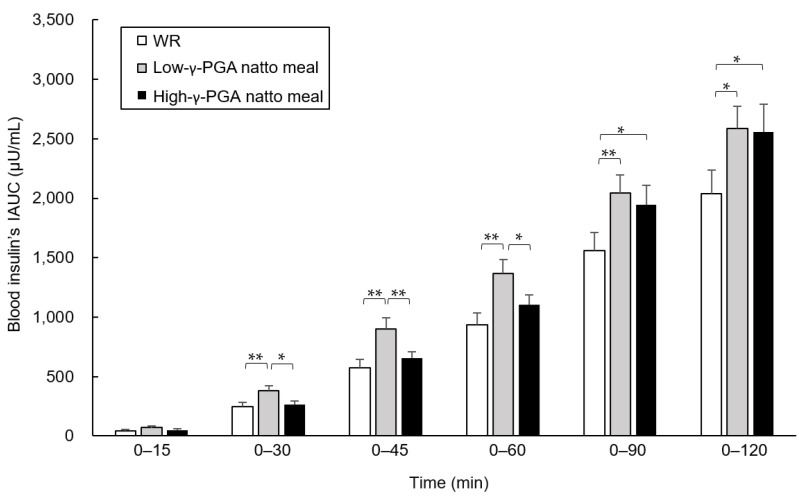
Figure 5.
Comparison of the blood insulin’s incremental area under the curve (IAUC) between the test meals at each time point. The blood insulin’s IAUC at 0–15, 0–30, 0–45, 0–60, 0–90, and 0–120 min were compared using a linear mixed model regression analysis with the test meals and groups as fixed effects, and the data are shown as the estimated mean ± the standard error (est. mean ± SE). * p < 0.05, ** p < 0.01. WR: white rice; γ-PGA: gamma-polyglutamic acid.

