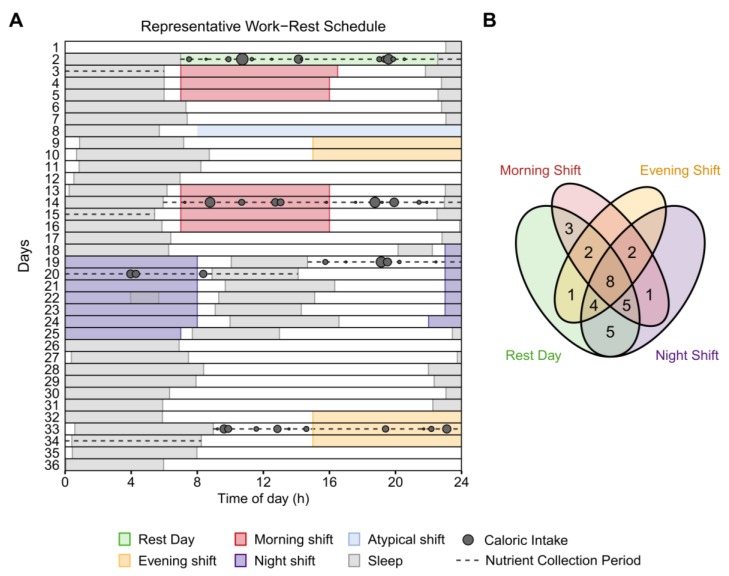
Figure 1.
Raster plot of the study schedule and Venn diagram of day type contributions. (A) Diagram of the work–rest schedule, sleep–wake patterns, and eating behavior of one participant on a 35-day cycle. Successive study days are depicted on the vertical axis and time-of-day along the abscissa. Grey rectangles depict sleep episodes and colored rectangles represent shifts. Dashed horizontal lines identify the relevant nutrient collection periods for each “day type” (from top to bottom: rest, morning-shift, night-shift, and evening-shift days)—beginning from the wake time of the main sleep period prior to each shift/rest day until the wake time of the following main sleep period. Grey circles represent caloric intakes of different sizes. (B) Venn diagram of the number of participants contributing to each combination of day types. Of the 31 participants, 8 contributed to all 4 possible day types, 21 contributed to at least 3 day types, and all 31 contributed to at least 2 day types.

