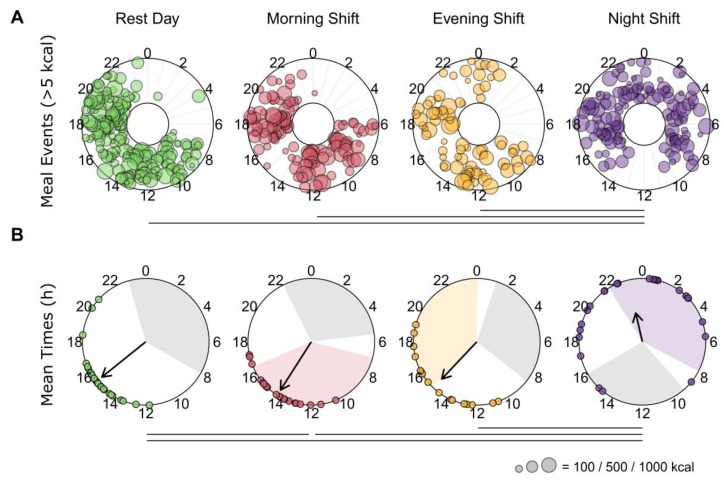
Figure 3.
Meal events and average caloric intake by time-of-day. (A) Individual meal intakes (>5 kcal) are depicted as colored circles in concentric rings for each participant. The sizes of the colored circles reflect the total caloric content of the meal. Horizontal lines represent significant differences in the spread or dispersion of caloric intake around the clock between day types. The spread per participant is derived from rho, the mean resultant vector length of circular data. On average, calories were more dispersed for night-shift days than other day types (Supplementary Table S3). (B) Weighted circular mean times of caloric intake for each participant on each day type are depicted as colored circles. The direction of the arrows identifies the group circular mean time for each day type. The length of the arrows represents the consistency of individual mean intake times, with smaller arrows indicating a larger spread. Colored regions depict the average work hours for each shift type. The grey regions depict the average times of the main sleep period for each shift type (based on the wake and sleep onset times before and after each day, respectively). Horizontal lines represent significant differences (adjusted, p < 0.05) in the timing of caloric intake between day types. Mean times of caloric intake occur later on night-shift days than all other days, and earlier on morning-shift days than rest days (Supplementary Table S3).

