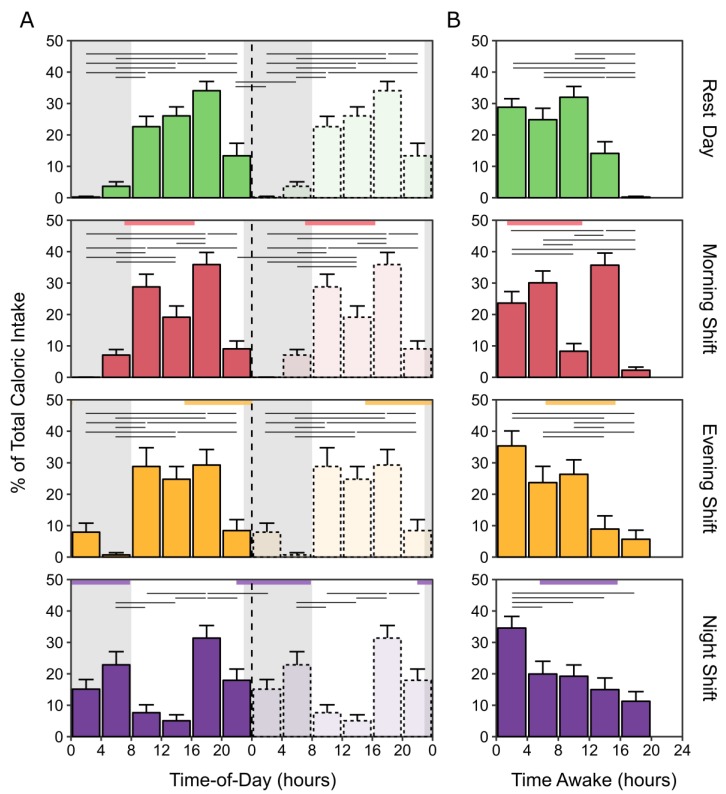
Figure 4.
Distribution of calories by time-of-day (double-plotted) and time awake per day type. Percentages of total caloric intake on rest days, morning-shift days, evening-shift days, and night-shift days are depicted along the abscissa in 4-h bins by (A) time-of-day, replotted on the right, and (B) time awake. Grey regions represent the average sleep periods on rest days. Colored horizontal rectangles indicate the average work start and end times for each shift type. Horizontal black lines indicate significant differences (adjusted, p < 0.05) in the proportion of total calories consumed between time-of-day or time awake bins. Error bars represent the standard error of the mean.

