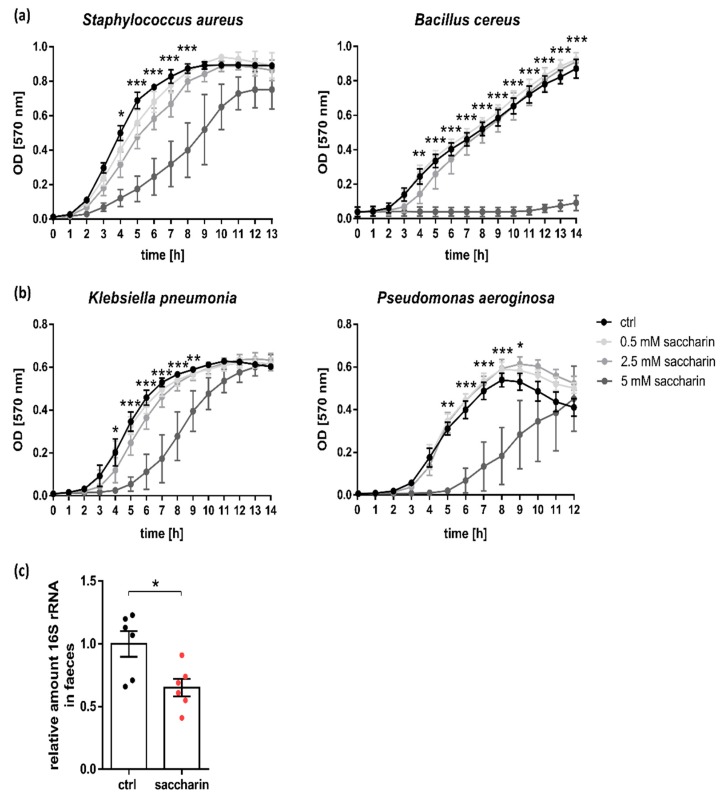
Figure 1.
Saccharin inhibits bacterial growth in vitro and in vivo. Bacterial growth curves of (a) Firmicutes and (b) Proteobacteria in the presence or absence of different saccharin concentrations; n = 3. Statistical significance is shown for 5 mM saccharin versus ctrl analyzed by two-way ANOVA followed by Tukey testing for multiple comparisons. (c) Bacterial load in the feces after 35 days of saccharin supplementation or ctrl feeding was quantified by PCR and is shown as relative amount of 16S rRNA to ctrl; n = 6. Values are shown as mean ± SEM. * p ≤ 0.05; ** p ≤ 0.01; *** p ≤ 0.001.

