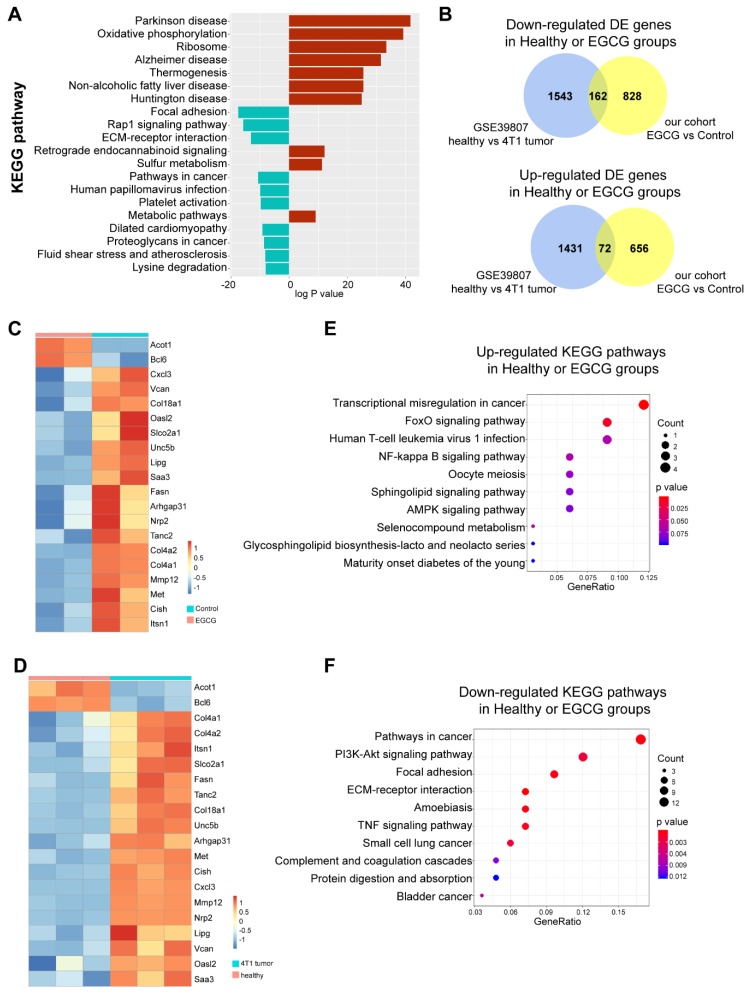
Figure 7.
EGCG restores key genes and pathways in MDSCs. (A). Results from Kyoto Encyclopaedia of Genes and Genomes (KEGG) pathway analysis. The top 20 pathways up- (red color) and down-regulated (blue color) in EGCG treatment groups are shown. (B). Venn-diagrams of the up-regulated and down-regulated differential expressed (DE) genes in our cohort and GSE39807 are shown. The middle area showed the overlapping genes. (C,D). Expressions of 20 top overlapped DE genes are shown in the heatmap. Based on hierarchical clustering, a clear separation can be observed between Control and EGCG groups and between the 4T1 tumor-bearing mice and the healthy mice. (E,F). The top 10 up-/down-regulated KEGG pathways enriched in the shared DE genes are shown.

