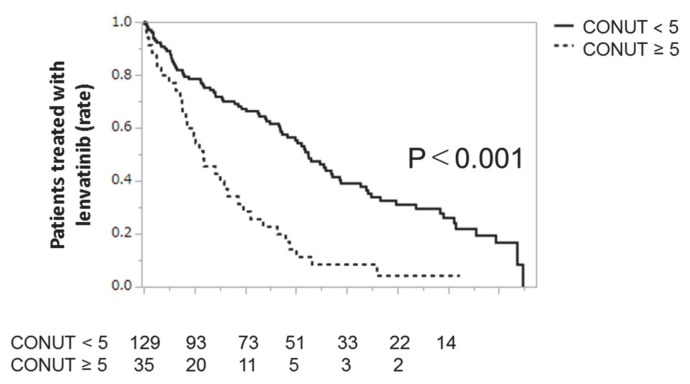
Figure A2.
Duration of treatment with lenvatinib according to CONUT score. Kaplan–Meier curves for the duration of treatment with Lenvatinib, according to CONUT score. The solid line represents the low CONUT group (CONUT score <5). The dotted line represents the high CONUT group (CONUT score ≥5). Abbreviations: CONUT, Controlling Nutritional Status.

