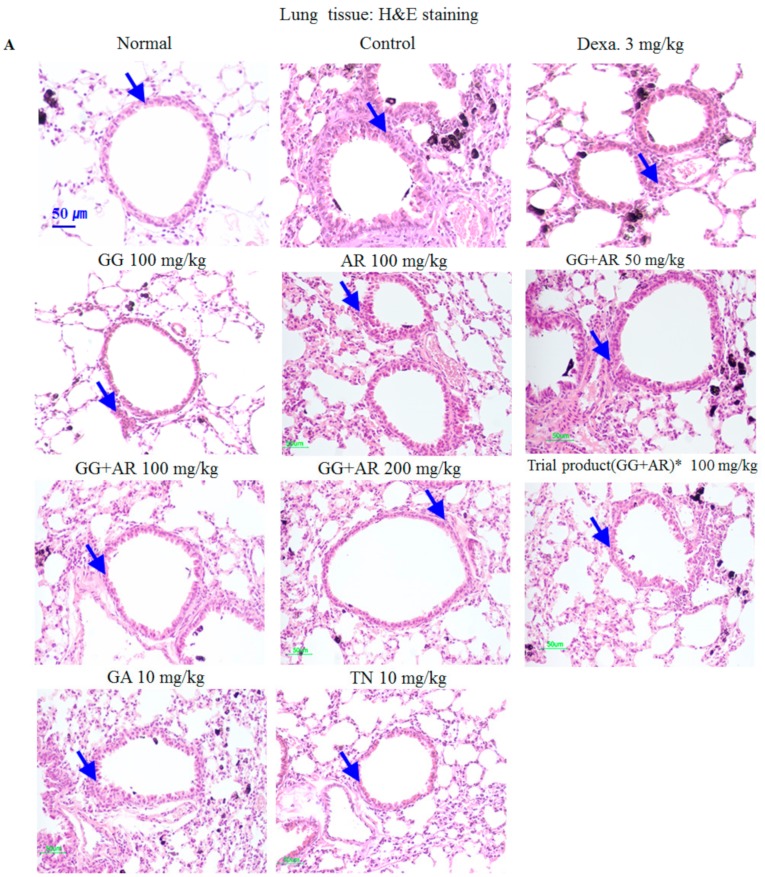
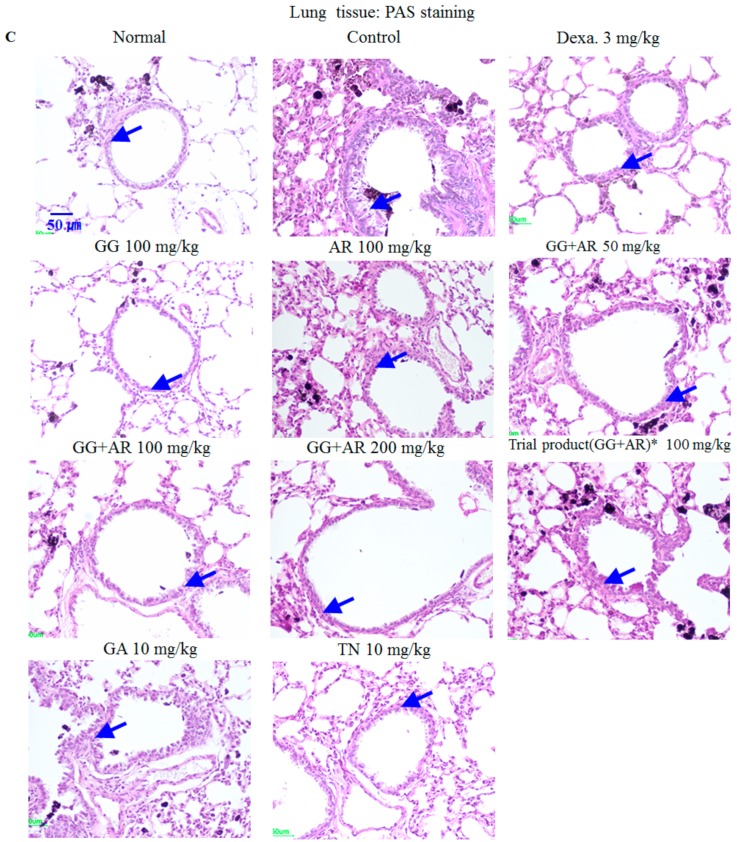
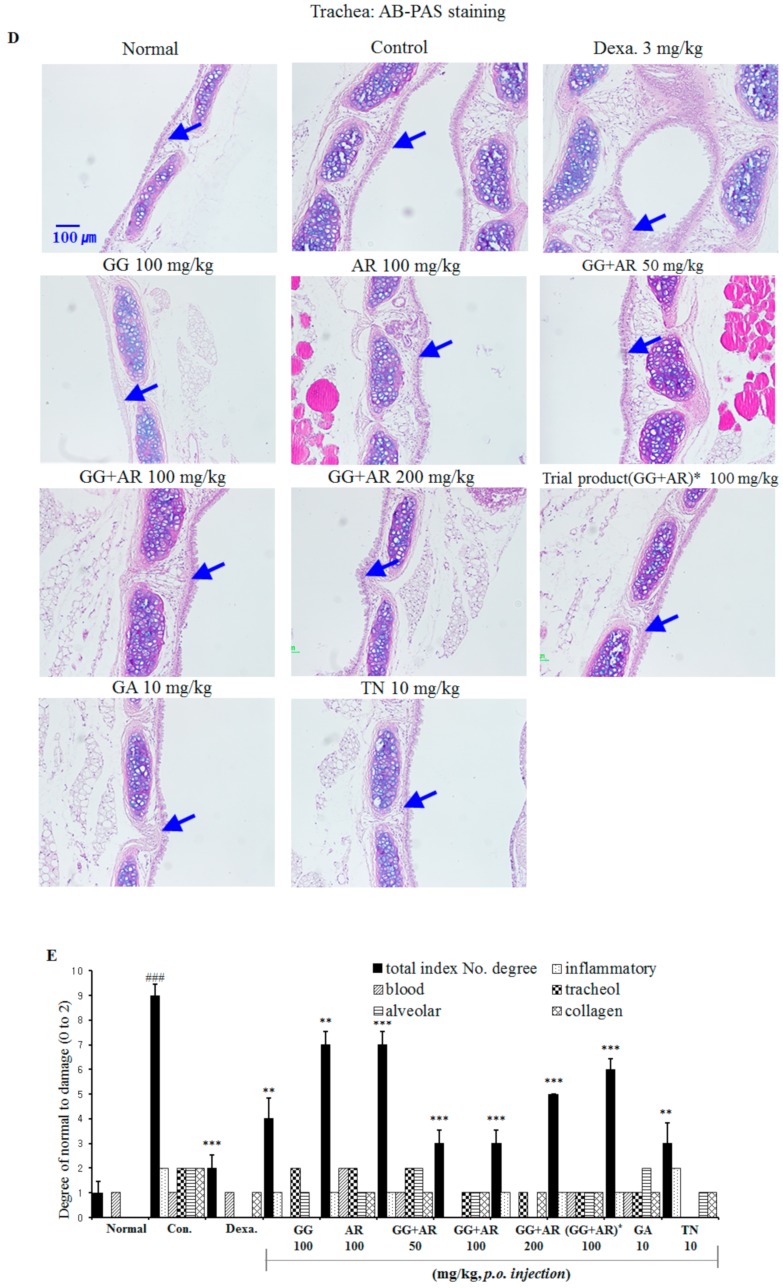
Figure 3.
Inhibitory effects of Glycyrrhiza glabra (GG), Agastache rugosa (AR), GG plus AR, glycyrrhizic acid (GA) and tilianin (TN) on histophathological markers of lung tissue of CFD-induced COPD model mice and drug-treated of each group. Representative H&E staining (A), M-T staining (B), PAS staining (C), AB-PAS staining (D), and quantitative analyses of the degree of lung tissue damage (E), which denote airway inflammation, subepithelial fibrosis, and goblet cell hyperplasia, respectively. Normal: normal group; Con.: CFD, CFD-induced COPD model group; Dexa.: CFD solution and administrated with dexamethasone 3 mg/kg group; GG 100: CFD solution and administrated with GG extract 100 mg/kg group; AR 100: CFD solution and administrated with AR extract 100 mg/kg group; GG + AR 50: CFD solution and administrated with GG plus AR extract 50 mg/kg group; GG + AR 100: CFD solution and administrated with GG plus AR extract 100 mg/kg group; GG + AR 200: CFD solution and administrated with GG plus AR extract 200 mg/kg group; GG + AR 100* (trial product): CFD solution and administrated with GG plus AR (trial product) 100 mg/kg group; GA 10: CFD solution and administrated with GA 10 mg/kg group; TN 10: CFD solution and administrated with TN 10 mg/kg group. The statistical significance of differences between control and treatment groups were assessed by ANOVA and Duncan’s multiple comparison test. (### P < 0.001, significantly different from the value of normal group. ** P < 0.01 and *** P < 0.001 significantly different from the value of control group.). Blue arrows indicate cell infiltration and inflammation (A), fibrosis (B), goblet cells (C), and mucus hypersecretion (D).


