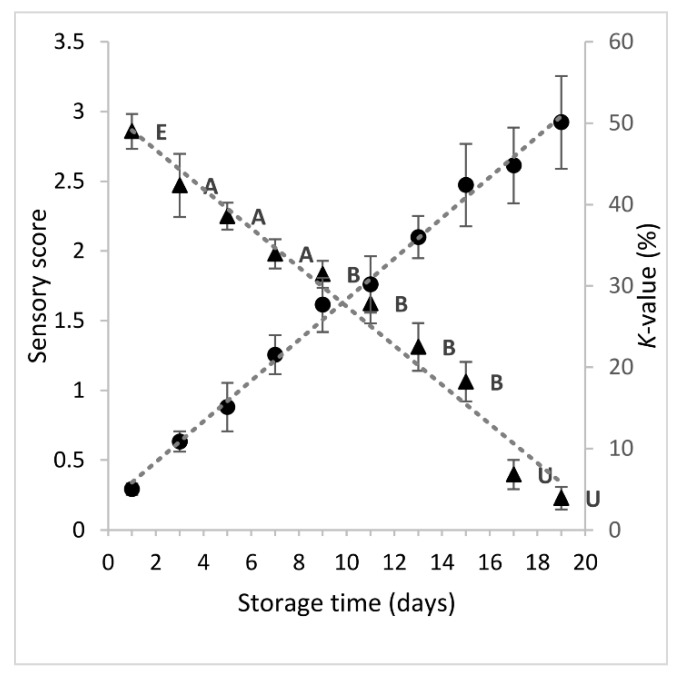
Figure 1.
Changes in sensory score (-▲-) and K-value (-●-) of sea bream stored in ice. Each point represent the mean value of six replicate measurements (three fish samples x two storage experiments at each sampling point). Error bars denote standard deviation. The labels of sensory scores denote the freshness category according to EU grading system.

