Figure 2.
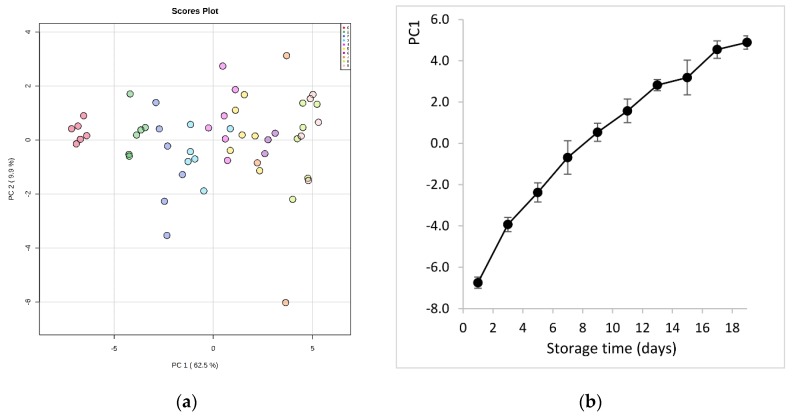
(a) Principal component analysis (PCA) score plot derived from the hydrophilic metabolites of sea bream during storage on ice. The legend indicates the sampling sequence (0-1-2-3-4-5-6-7-8-9) that corresponds to storage day (1-3-5-7-9-11-13-15-17-19), respectively; (b) evolution of sea bream spoilage as described by PC1 scores values vs. storage time on ice.

