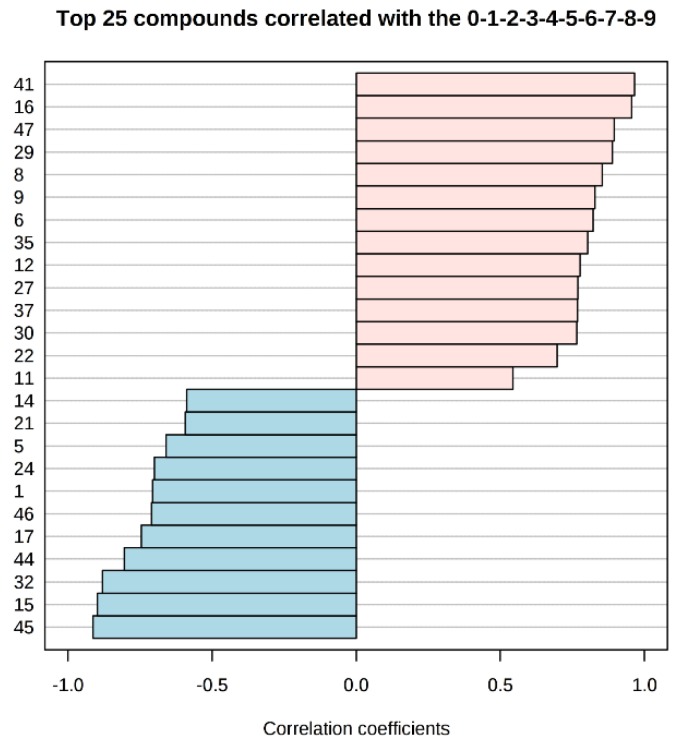
Figure 3.
Pattern recognition—Spearman’s correlation analysis showing the top 25 metabolite features correlated significantly with sampling sequence (0-1-2-3-4-5-6-7-8-9 is equivalent to storage day 1-3-5-7-9-11-13-15-17-19). Each row represents the most significant metabolite identified from the test (p < 0.05). The x-axis shows correlation score, whereas the y-axis corresponds to gas chromatography–mass spectrometry (GC–MS) peak number from peak index (see Table 1).

