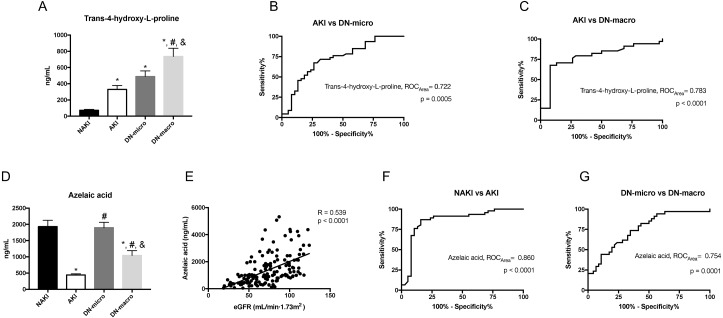
Figure 6. Urine metabolomic abundance in validation cohort were measured by targeted metabolomics analysis.
(A) The absolute concentration levels of trans-4-hydroxy-L-proline in NAKI, AKI, DN-micro and DN-macro groups; (B–C) ROC curves of trans-4-hydroxy-L-proline for distinguishing AKI from DN-micro and DN-macro patients; The sensitivity (true positive rate) is set as the ordinate, and 1-specificity (false positive rate) is set as the abscissa. (D) The absolute concentration levels of azelaic acid in NAKI, AKI, DN-micro and DN-macro groups. (E) Correlation of azelaic acid with eGFR in cohort patients. Pearson correlation coefficient (R) is provided in the picture (F–G) ROC curves of azelaic acid for distinguishing NAKI from AKI patients, DN-micro from DN-macro patients. p < 0.05 was considered significant. *, p < 0.05 vs. NAKI group; #, p < 0.05 vs. AKI group; &, p < 0.05 vs DN-micro group. Abbreviation: ROC, receiver operating characteristic curves.

